While analysing Kido network behaviour we’ve been able to develop an application that helped us to get an in depth insight into the peer-to-peer network communications of the malware, which have been used to distribute updates over the last week. Over a 24 hour observation period, we’ve been able to identify 200652 unique IPs participating in the network, far less then initial estimated Kido infection counts.
This is mostly due to the fact that only the latest variants of Kido are participating in the peer-to-peer network and only a fraction of the nodes infected with earlier variants have been updated with new variants.
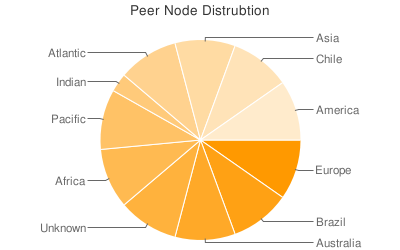
In terms of global distribution, we’re seeing the picture expected from initial infection counts. Brazil and Chile clearly stand out as regions in terms of peer counts:

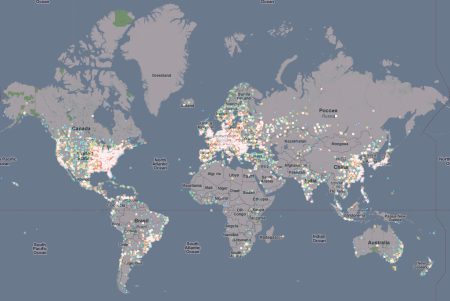
However, there doesn’t seem to be any region spared throughout the world. The density of points in a country isn’t representative of the infection count because of the varying resolution of the IP to GeoLocation database being used:
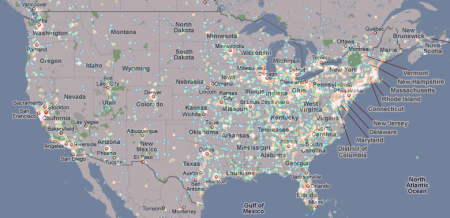
A closer look at the USA reveals that the eastern parts of the US have more peer-to-peer nodes running than the western part:
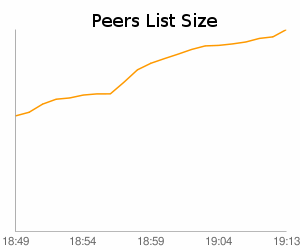
An interesting fact while observing the network is that it’s possible to identify the core of the network (which is well connected) quickly due to the big peer cache maintained by each node. In the first twenty minutes, we found 10.4% of the total peer population didn’t show the exponential growth which would have been expected from smaller peer caches:

It can therefore be assumed that once a node finds any other infected node that is already connected to the network, it can maintain stable connectivity and network partitions are unlikely. However, finding this first node seems to be quite difficult for some hosts – we’ve seen several nodes which weren’t connected to any other node.


Watching the Kido/Conficker P2P Network