
According to a prominent Soviet science fiction writer, beauty is a fine line, a razor’s edge between two opposites locked in a never-ending battle. Today, we would put it less poetically as an ideal compromise between contradictions. An elegant, or beautiful, design is one that allows reaching that compromise.
As an information security professional, I like elegant designs — all the more so because trade-off is a prerequisite for an information security manager’s success: in particular, trade-off between the level of security and its cost in the most practical, literal sense. A common perception in the infosec community is that there can never be too much security, but it is understood that “too much” security is expensive — and sometimes, prohibitively so — from a business perspective. So, where is that fine line that defines “just enough” security, how much is enough, and how does one prove this to decision-makers? This is what I want to talk about.
Mathematics and images
There is a certain language barrier between a chief information security officer (CISO) and the above-mentioned decision-makers — I will refer to them as “business” for brevity. While security professionals speak of “lateral movement” and “attack surface”, business views infosec and the IT department as a whole as costs to be minimized. While the costs of IT are visible as hardware and software, it is hard to do the same with IS, as this is a purely applied function deeply integrated with IT and hardly perceivable at a high level of abstraction. I like to describe IS as one of IT’s many properties, a criterion by which to measure the quality of a company’s information systems. Quality is commonly understood to come at a price. Theoretically, business understands that too, but it asks valid questions: why it should allocate the exact amount articulated by the CISO, and what the company would get for that money.
IS funding requests historically have been backed by all kinds of horror stories: business will hear tales of current security incidents, such as ransomware attacks or data leaks, and then they will be told that a certain solution can help against the aforementioned threats. These arguments are supported by stories from relevant — and occasionally, not so much — publications containing a description and rough estimate of the damage along with the provider’s pricing. This is only good for a start, and there is no guarantee that the approach will work again, whereas we are interested in a continuously improving operational process that will help to measure the threat landscape with a reasonable degree of objectivity and in a way that is understandable to business, and adapt the corporate system of security controls to that. Therefore, let us put the horror stories aside as an approach that seriously lacks in both efficiency and effectiveness, and arm ourselves with relevant parameters.
I will start by highlighting the fact that humans are not particularly good at understanding plain text. Tables work much better, and images, better yet. Therefore, I recommend that your conversation with business about the need to improve the IS management system be illustrated with colorful diagrams and images that reflect the current threat landscape and the capabilities of operational security. The way to succeed is to make sure that the slide deck shows the capabilities of operational security — or simply, the SOC — as being up to current threats.
To compare the threat landscape with SOC performance, the data must be expressed in the same units. The efficiency and effectiveness of the SOC or any other team — let alone one that has any sort of service level agreement (SLA) — are constantly measured, so it is only logical to reuse the SOC metrics for evaluating the sufficiency of security. Measuring the threat landscape is a little less straightforward. Threats should be evaluated by a large number of parameters: the more characteristics of potential attackers we evaluate, the better the chance to obtain an unbiased picture. I would like to delve into two most obvious parameters, which are fairly easy to compute but also easy to explain without resorting to complex technical terms.
Mean time to detect an attack
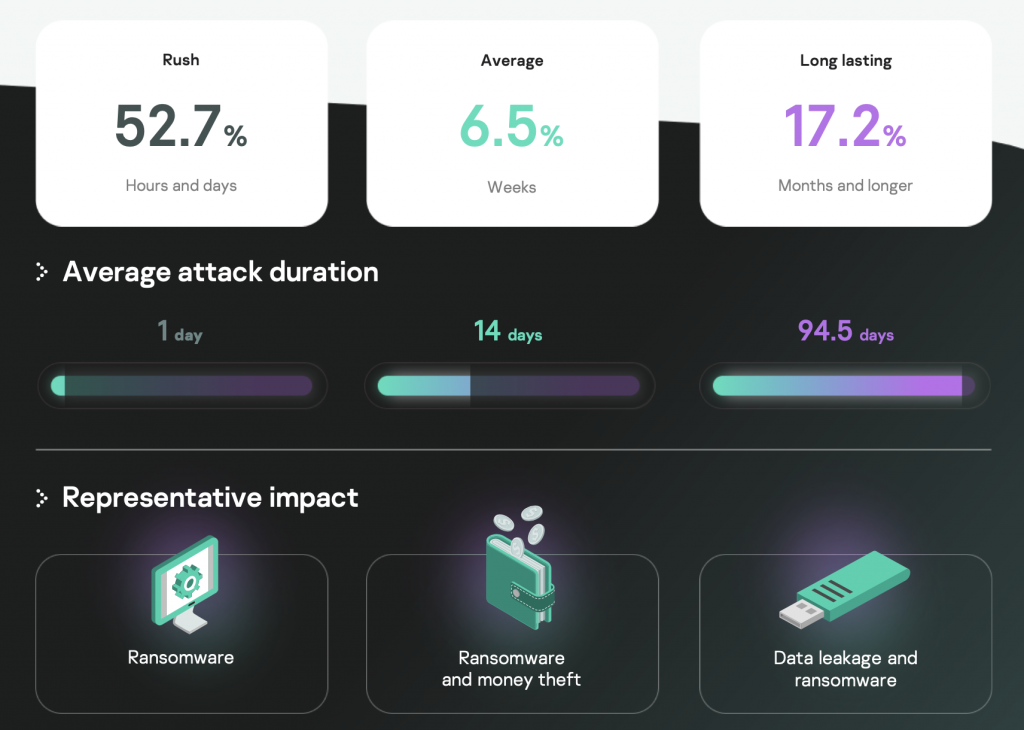
Unfortunately, a complex attack is often noticed only when assessing impact, but our statistics include a fair number of mature companies that detected an attack at an earlier stage, which is favorable for our evaluation. Our analytics show that the mean detection time differs by attack scenario, but the planning of security controls should use the shortest time measured in hours.
As a consequence, the SOC is required to detect and localize the attack in time, which is normally expressed with two indicators: mean time to detect (MTTD) and mean time to respond (MTTR). Both must be less than the attacker’s mean time to reach the target, regardless of the attack type.
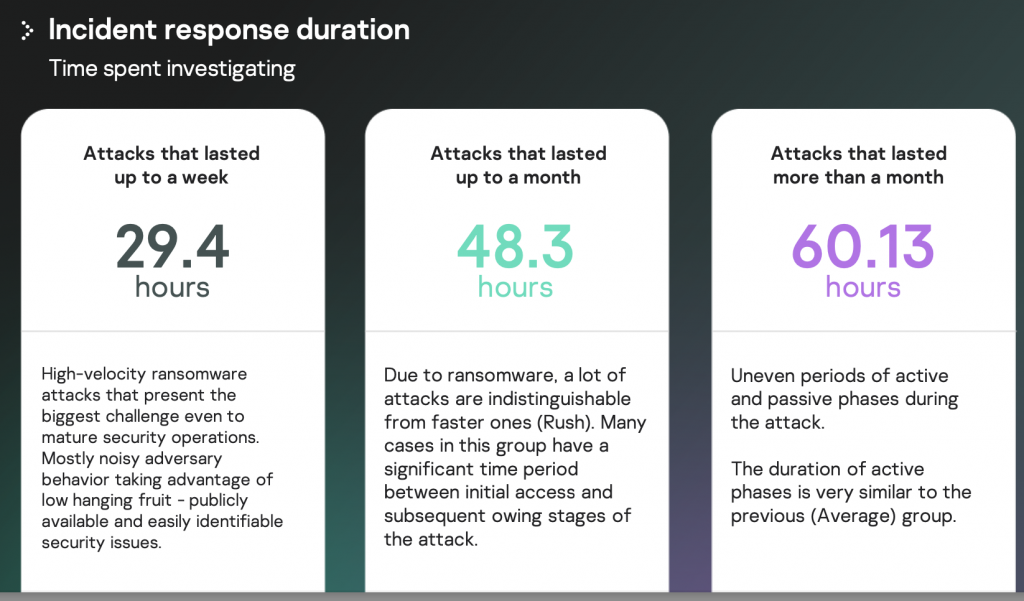
Time to investigate
This is the second, equally important, attribute, which is obviously related to the duration of the attackers’ presence in the compromised infrastructure.
The SOC team must have access to this value and the resources to respond without affecting the quality of monitoring.
I believe that indicators that demonstrate our SOC’s (in)ability to detect the threat before it goes far enough to cause damage are much easier for business to understand. Combined with many other indicators, such as “our SOC’s ability to detect specific attacker techniques and tools” or “our SOC’s ability to monitor specific penetration vectors”, these help to form the most unbiased assessment of the SOC’s operational preparedness and provide better arguments for business in favor of investing in a security area.
Using sources
Once we have settled on indicators to demonstrate to business, the question arises of where to get data from. Members of operational security teams who have accumulated their own incident detection and investigation statistics will immediately respond that a review of past cases should serve as the source of indicators for assessment. The outcome of the investigation will show the attackers’ time expectations and their methods, while the SOC metrics will provide an unbiased assessment of the defenders’ efficiency and effectiveness. Both types of indicators will be directly linked to the company, rather than being abstract assessments.
As for those who have not yet accumulated statistics and experience of their own, I recommend you using analytics from vendors and MSSPs. For instance, every year, we publish the DFIR team’s incident analytics, which can be used as a source of a potential attacker profile, while the SOC team’s analytical report will help to shape potential SOC targets. It goes without saying that the provider’s statistics should be representative for the industry and country the customer operates in rather than contain all sorts of irrelevant data. External sources of data could benefit experienced employees who draw upon their own data, too. These may serve as a source of information about new threats, which are already relevant to the industry as a whole but have not yet caught the eye of the specific organization’s SOC employees. In addition to that, external data will provide a basis for comparing the company’s own performance with that of the service providers to reevaluate the company’s ability to perform the work with in-house resources against the need for outsourcing.
Answering the question
The real cost of requisite security is the difference between attackers’ capabilities and the SOC team’s resources — provided that the former are assessed in terms of actual incidents and relevant statistics, and the latter, in terms of SOC metrics. The aforementioned MTTD and MTTR will work best, as they are easier for business to grasp than the SOC maturity model or other academic arguments. In my opinion, it is the combination of operational metrics based on both the company’s own teams’ past work and analytical reports by IS service providers that can help to achieve the right balance, resulting in the desired level of performance and efficiency at an acceptable cost in the long run, or in a word, in beauty.
How much security is enough?










Vicente
Very good material. Precisely and importantly. Thanks