

Quarterly highlights
Amazon Prime
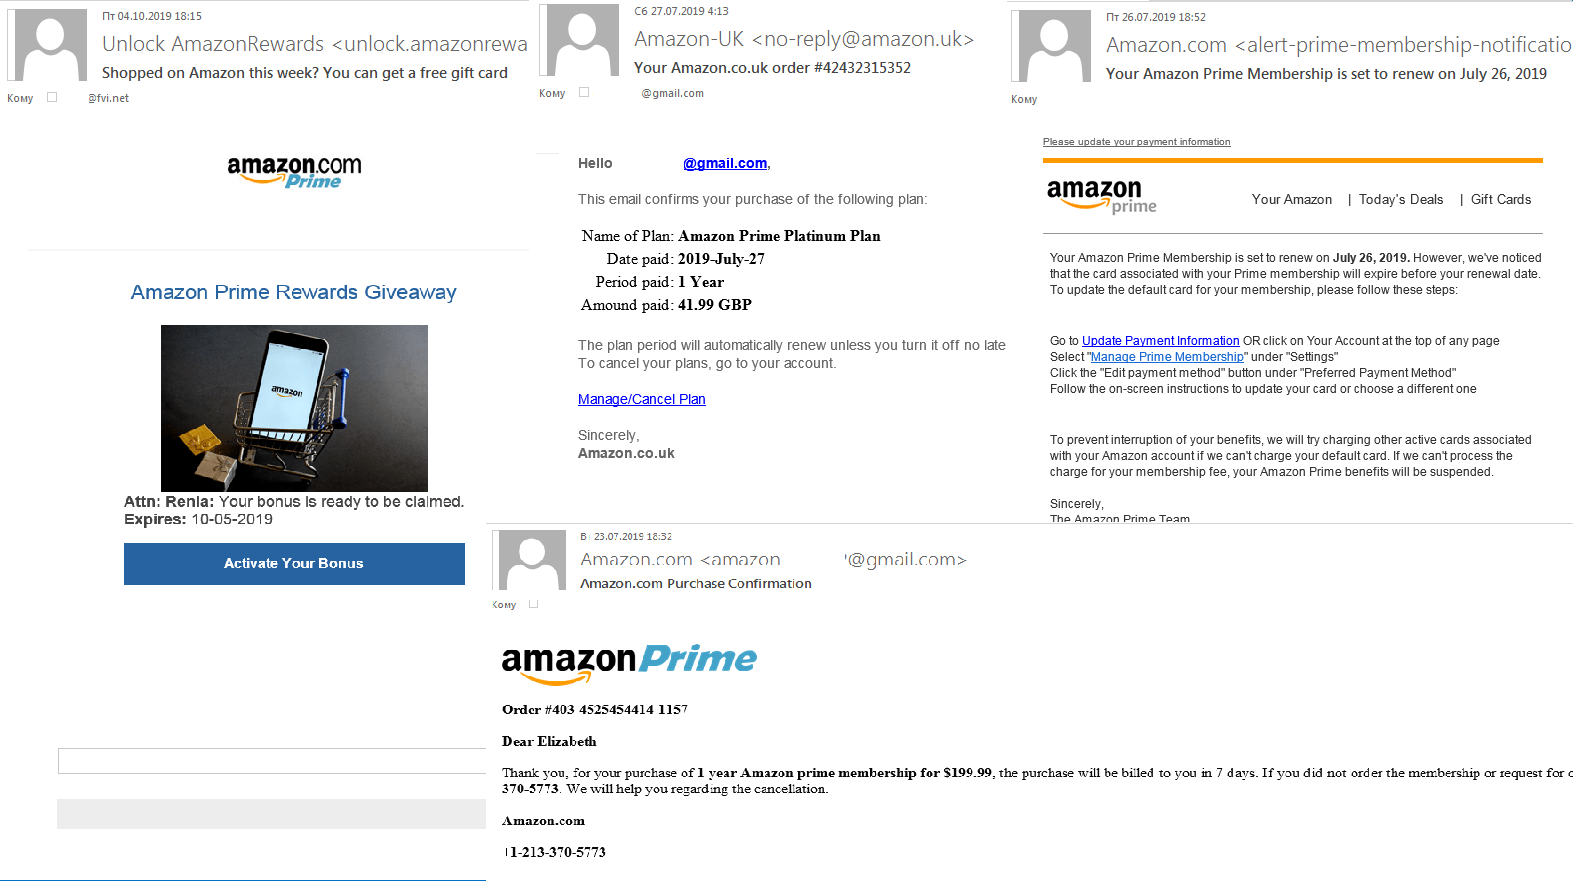
In Q3, we registered numerous scam mailings related to Amazon Prime. Most of the phishing emails with a link to a fake Amazon login page offered new prices or rewards for buying things, or reported problems with membership, etc. Against the backdrop of September’s Prime Day sale, such messages were plausible.
Scammers also used another fraudulent scheme: An email informed victims that their request to cancel Amazon Prime had been accepted, but if they had changed their mind, they should call the number in the message. Fearing their accounts may have been hacked, victims phoned the number — this was either premium-rate and expensive, or, worse, during the call the scammers tricked them into revealing confidential data.
Scammers collect photos of documents and selfies
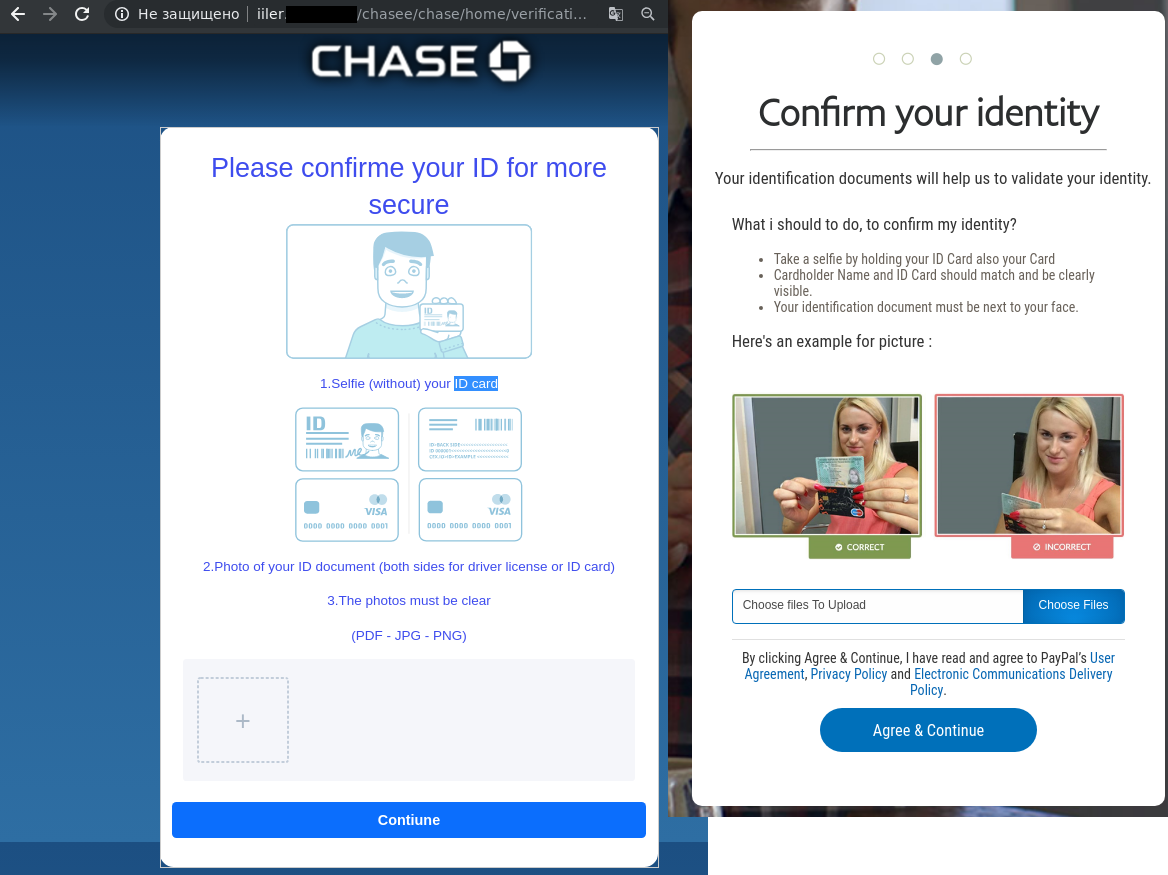
This quarter we detected a surge in fraud related to stealing photos of documents and selfies with them (often required for registration or identification purposes). In phishing emails seemingly from payment systems and banks, users were asked under various pretexts to confirm their identity by going to a special page and uploading a selfie with an ID document. The fake sites looked quite believable, and provided a list of necessary documents with format requirements, links to privacy policy, user agreement, etc.
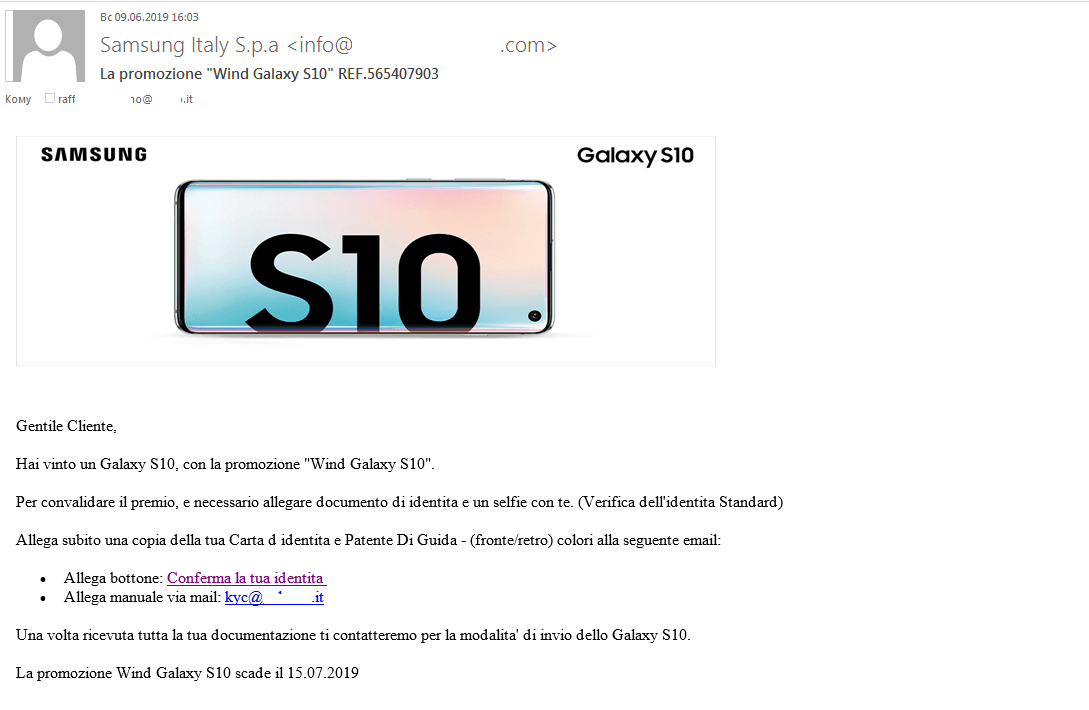
Some scammers even managed without a fake website. For instance, in summer Italian users were hit by a spam attack involving emails about a smartphone giveaway. To receive the prize, hopefuls had to send a photograph of an ID document and a selfie to the specified email address. To encourage victims to respond, the scammers stated that the offer would soon expire.
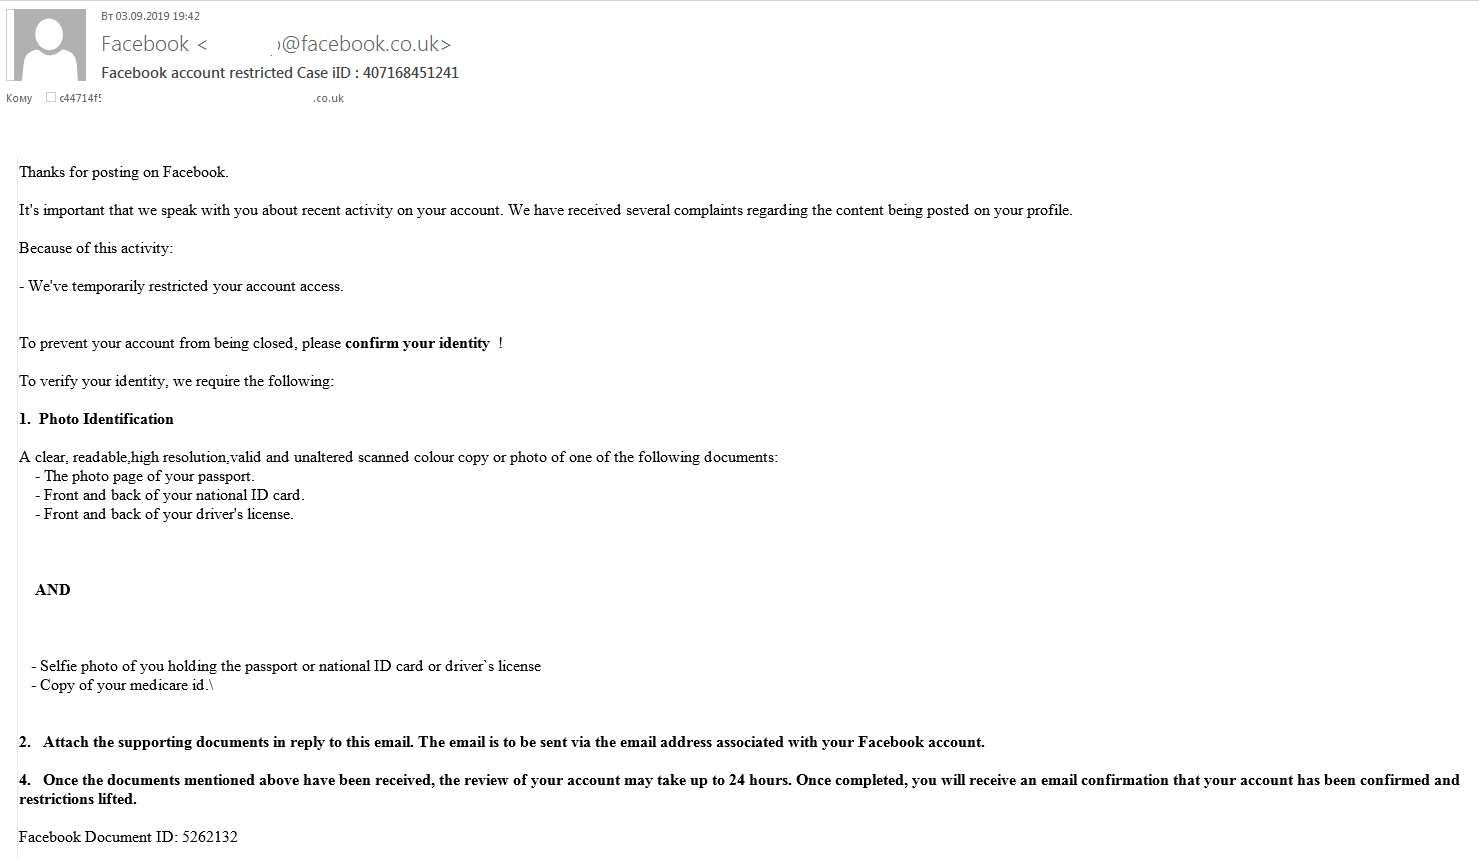
To obtain copies of documents, scammers also sent fake Facebook messages in which recipients were informed that access to their accounts had been restricted due to complaints about the content of some posts. To prevent their account from being deleted, they were instructed to send a photo or scan of a driving license and other ID documents with a selfie, plus medical insurance details.
YouTube and Instagram
Scammers continue to exploit traditional schemes on new platforms, and Q3 was a bumper quarter in this regard. For instance, YouTube ads appeared offering the viewer the chance to earn a lot of quick and easy money. The video explained to users that they had to take a survey and provide personal details, after which they would receive a payout or a gift from a large company, etc. To add credibility, fake reviews from supposedly “satisfied customers” were posted under the video. What’s more, the enthusiastic bot-generated comments did not appear all in one go, but were added gradually to look like a live stream.
All the user had to do was follow the link under the video and then follow the steps in the video instructions. Sure, to receive the handout, a small “commission fee” or payment to “confirm the account” was required.
Similar schemes did the rounds on Instagram. Advertising posts in the name of various celebrities (fake accounts are easily distinguished from real ones by the absence of a blue tick) were often used to lure fans with prize draws or rewards for completing a paid survey. As with the YouTube videos, there were plenty of fake glowing comments under such posts. Given that such giveaways by stars are not uncommon, inattentive users could swallow the bait.
Back to school
In Q3, we registered a series of attacks related in one way or another to education. Phishers harvested usernames and passwords from the personal accounts of students and lecturers using fake pages mimicking university login pages.
The scammers were looking not for financial data, but for university research papers, as well as any personal information that might be kept on the servers. Data of this kind is in high demand on the darknet market. Even data that seems useless at first can be used by cybercriminals to prepare a targeted attack.
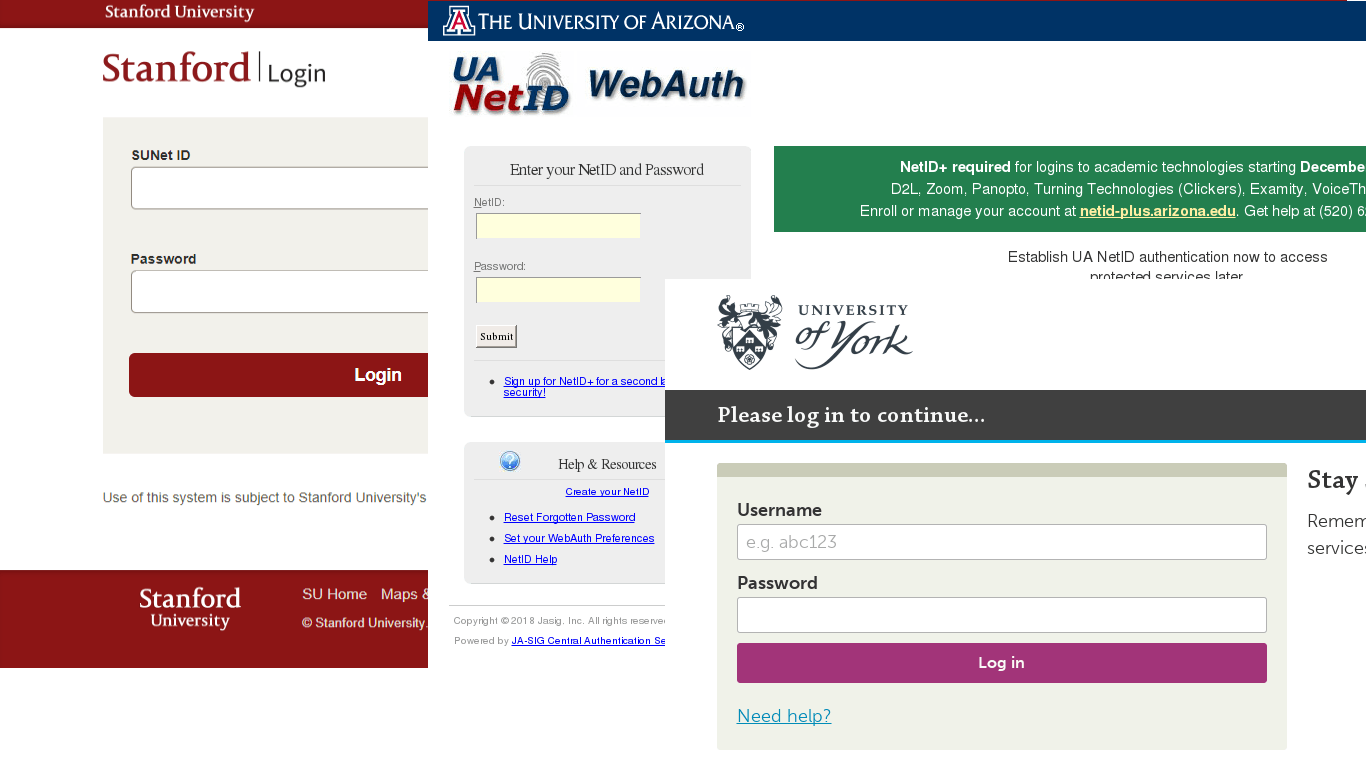
One way to create phishing pages is to hack into legitimate resources and post fraudulent content on them. In Q3, phishers hacked school websites and created fake pages on them to mimic login forms for commonly used resources.

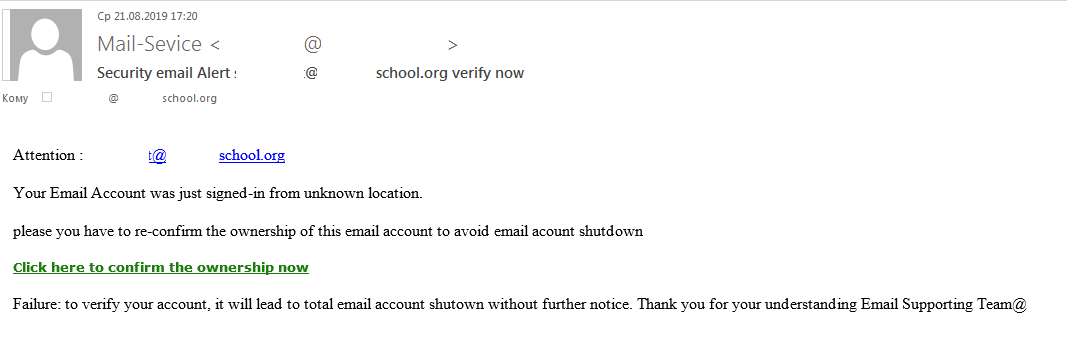
Scammers also tried to steal usernames and passwords for the mail servers of educational service providers. To do so, they mailed out phishing messages disguised as support service notifications asking recipients to confirm that the mail account belonged to them.
Apple product launch
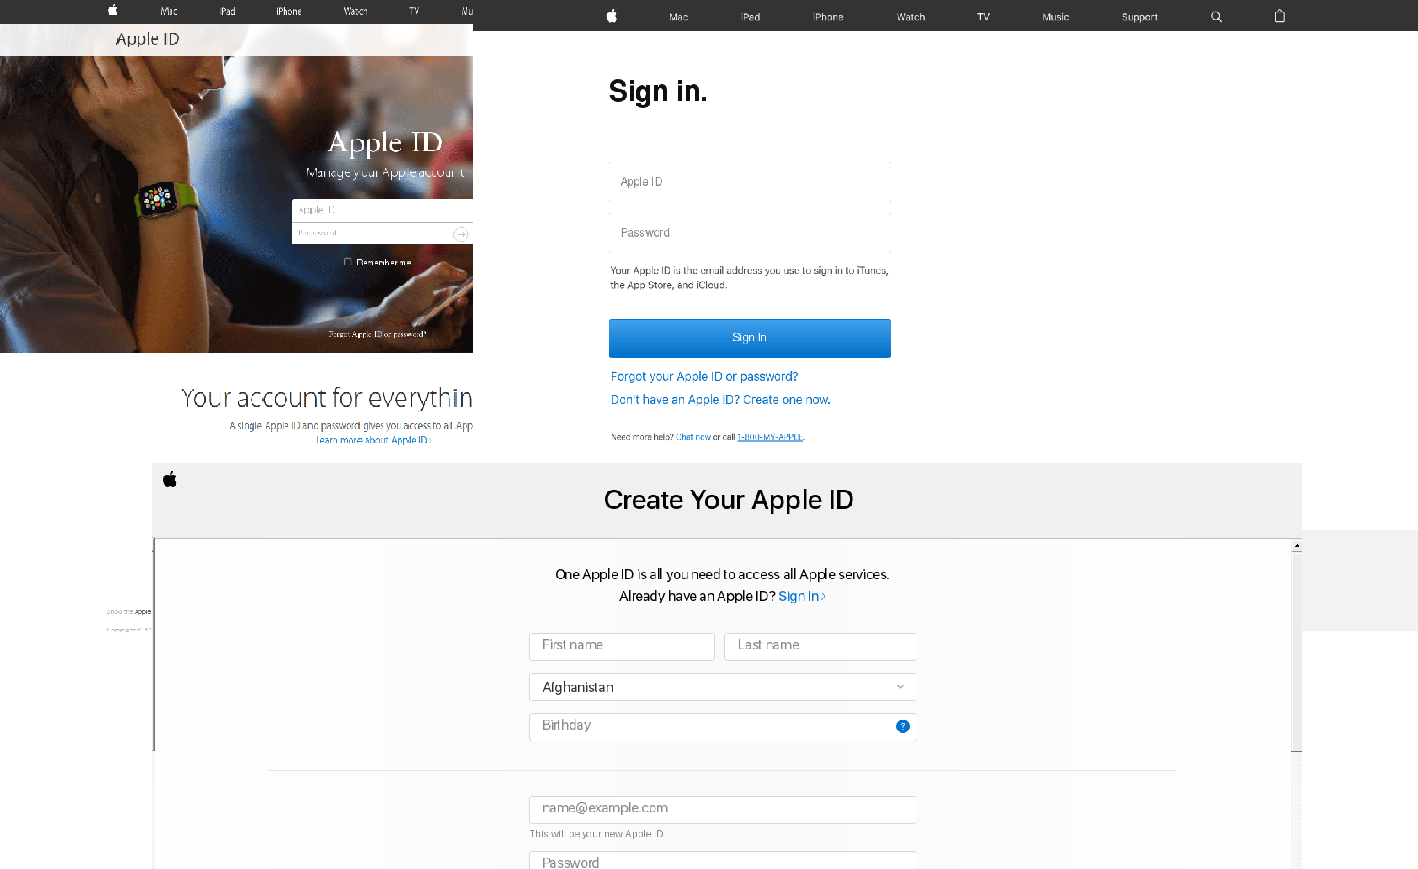
In September, Apple unveiled its latest round of products, and as usual the launch was followed by fans and scammers alike — we detected phishing emails in mail traffic aimed at stealing Apple ID authentication data.

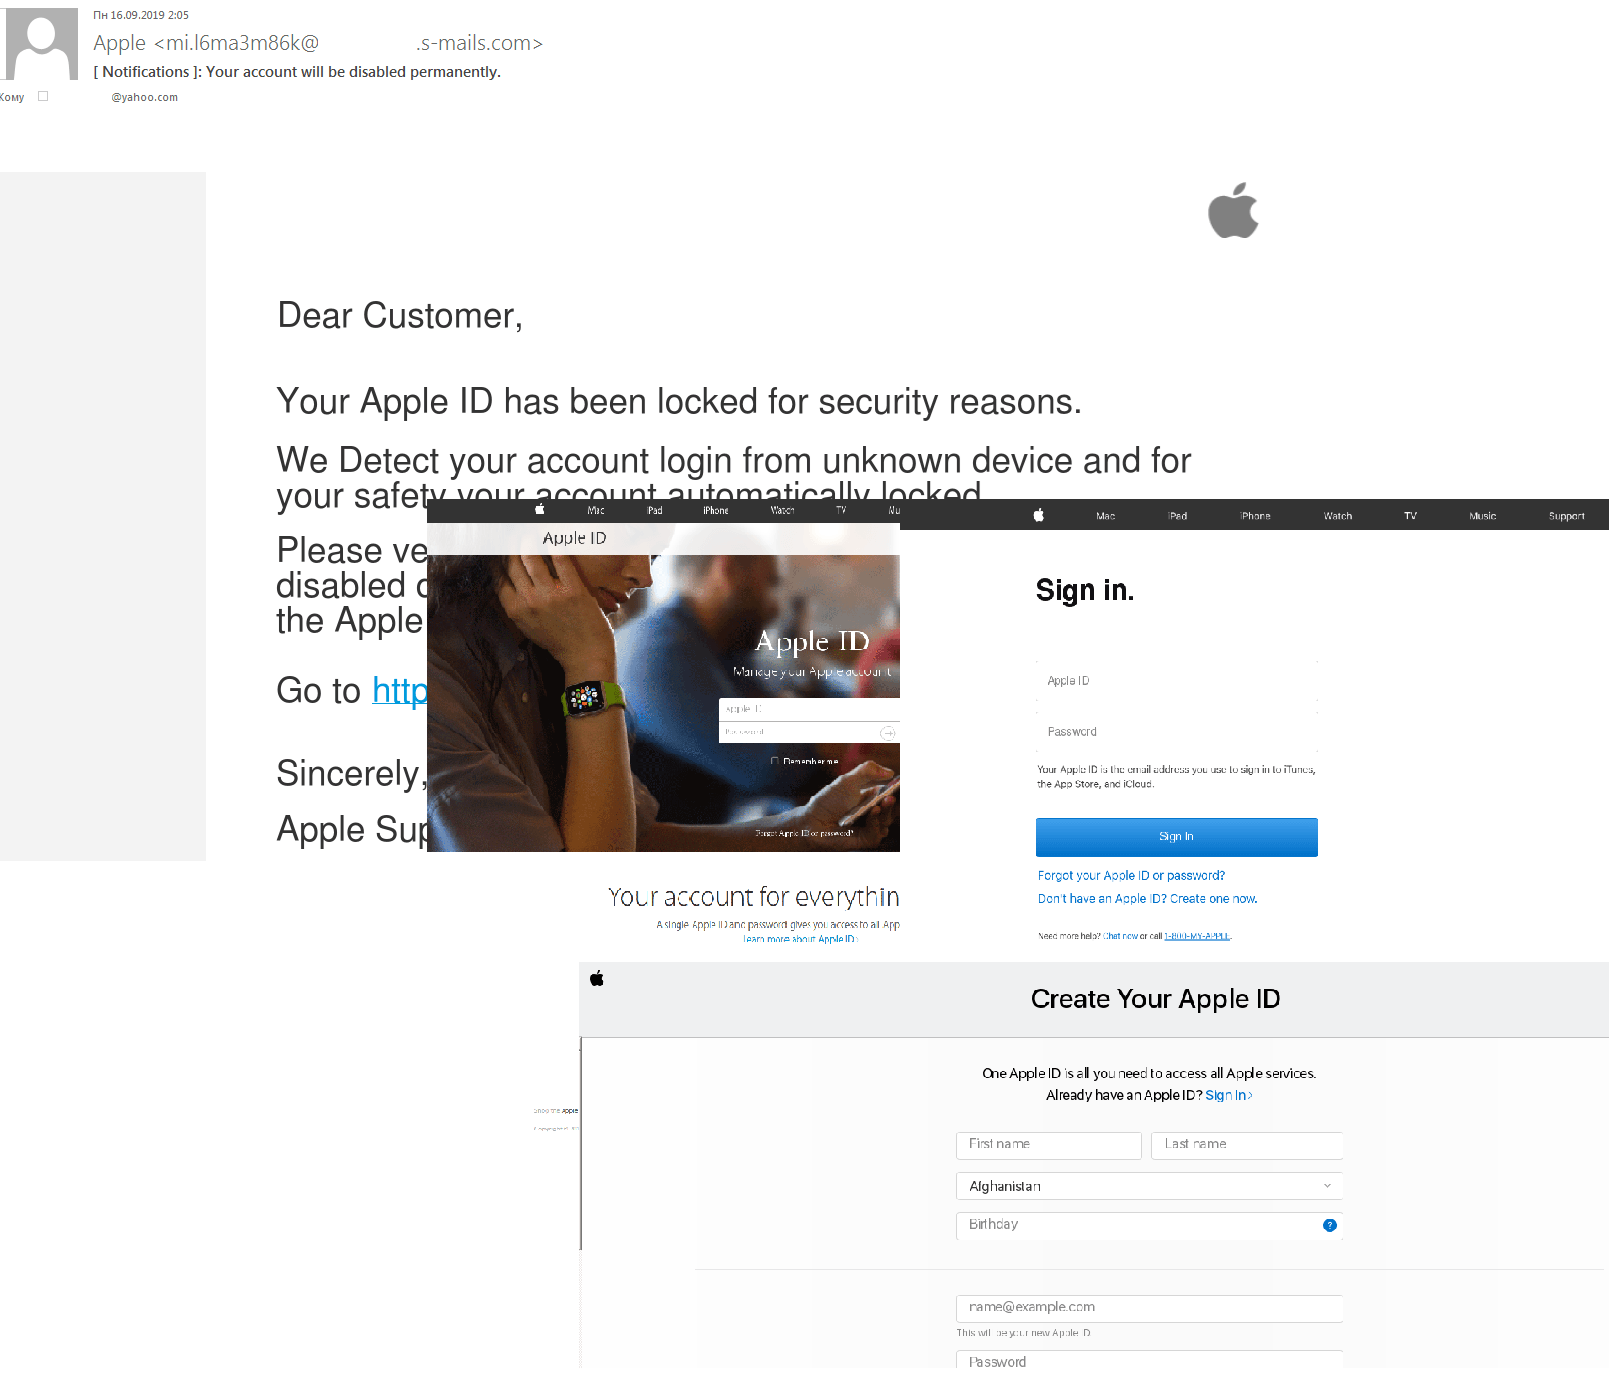
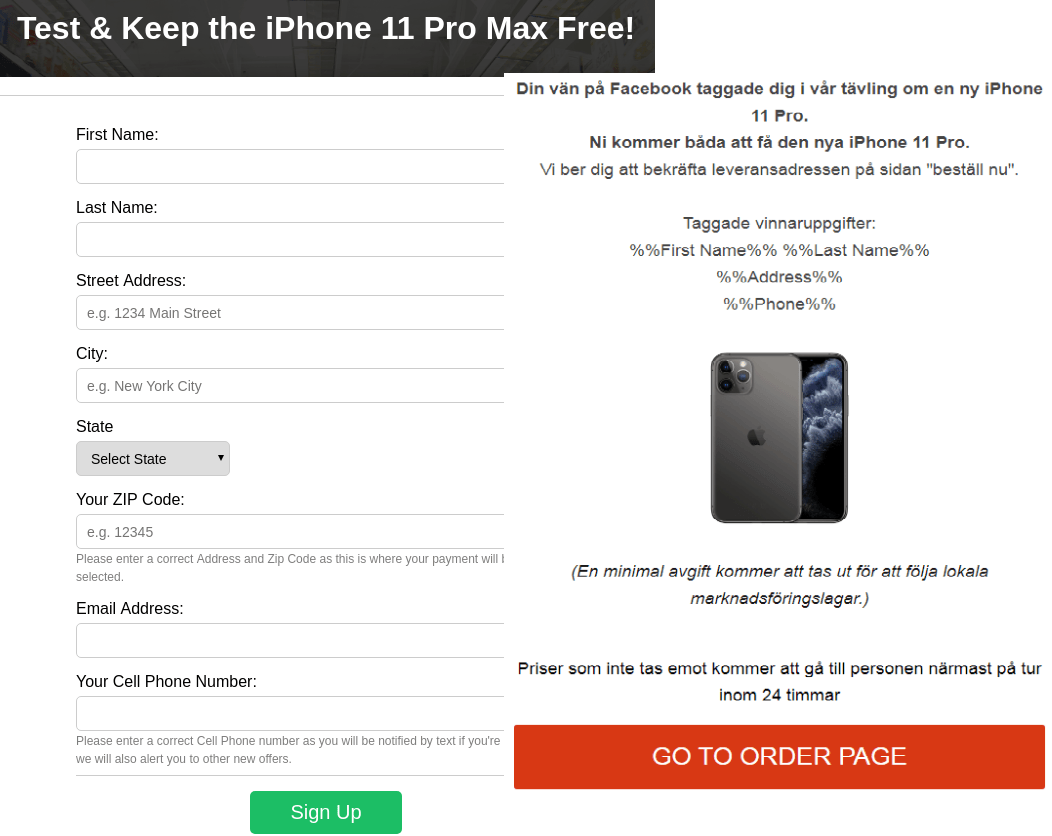
Scammers also harvested users’ personal data by sending spam messages offering free testing of new releases.
The number of attempts to open fake websites mentioning the Apple brand rose in the runup to the unveiling of the new product line and peaked on the actual day itself:

Number of attempts to open Apple-related phishing pages, September 2019 (download)
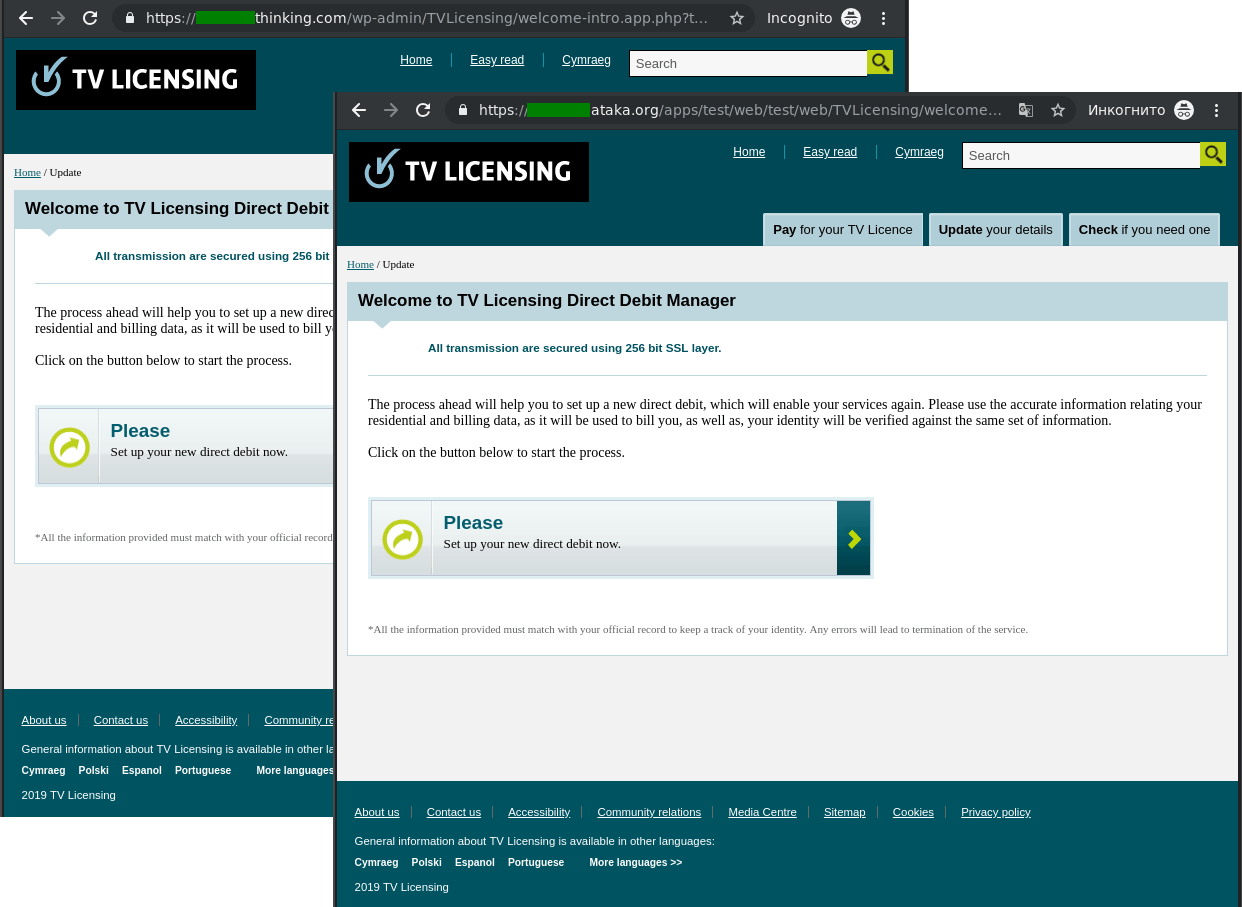
Attacks on pay TV users
To watch TV or record live broadcasts in the UK, a license fee is payable. This was exploited by spammers who sent out masses of fake license expiry/renewal messages. What’s more, they often used standard templates saying that the license could not be renewed because the bank had declined the payment.
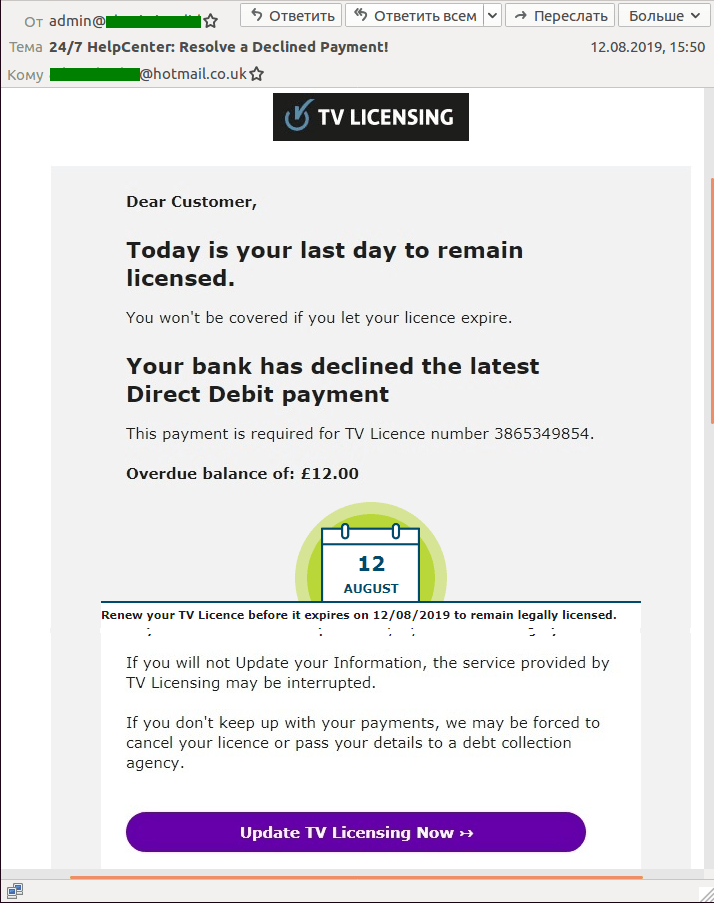
The recipient was then asked to verify (or update) their personal and/or payment details by clicking on a link pointing to a fake data entry and payment form.
Spam through website feedback forms
The website of any large company generally has one or even several feedback forms. These can be used to ask questions, express wishes, sign up for company events, or subscribe to newsletters. But messages sent via such forms often come not only from clients or interested visitors, but from scammers too.
There is nothing new about this phenomenon per se, but it is interesting to observe how the mechanism for sending spam through forms has evolved. If previously spammers targeted company mailboxes linked to feedback forms, now fraudsters use them to send spam to people on the outside.
This is possible because some companies do not pay due attention to website security, allowing attackers to bypass simple CAPTCHA tests with the aid of scripts and to register users en masse using feedback forms. Another oversight is that the username field, for example, accepts any text or link. As a result, the victim whose mailing address was used receives a legitimate confirmation of registration email, but containing a message from the scammers. The company itself does not receive any message.
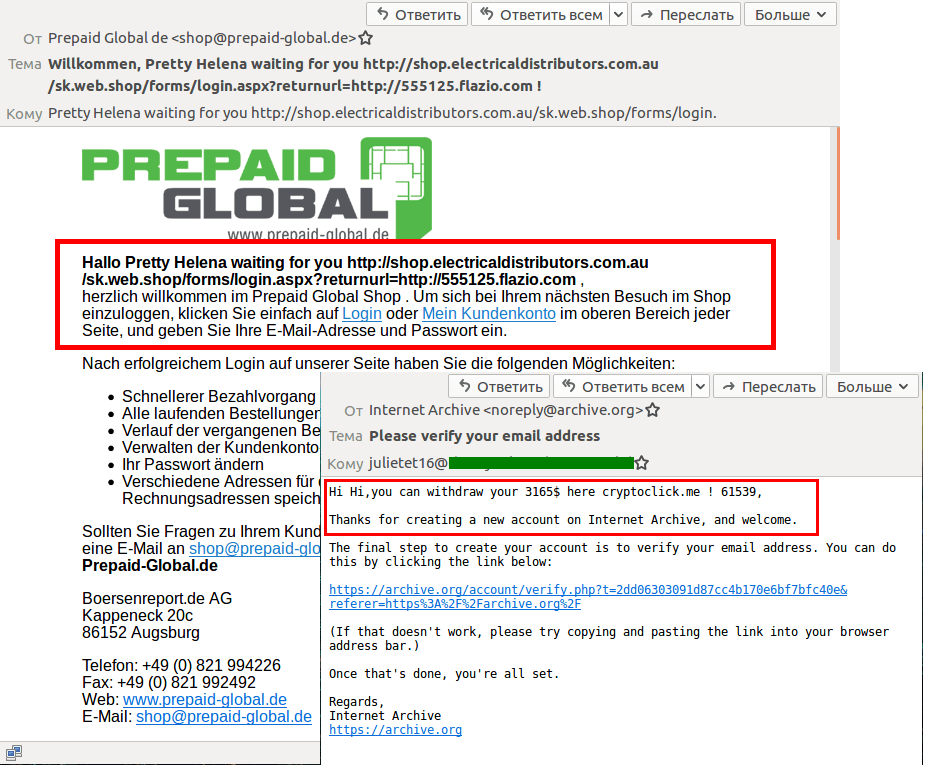
Such spam started to surge several years ago, and has recently become even more popular — in Q3 services for delivering advertising messages through feedback forms began to be advertised in spam mailings.
Attacks on corporate email
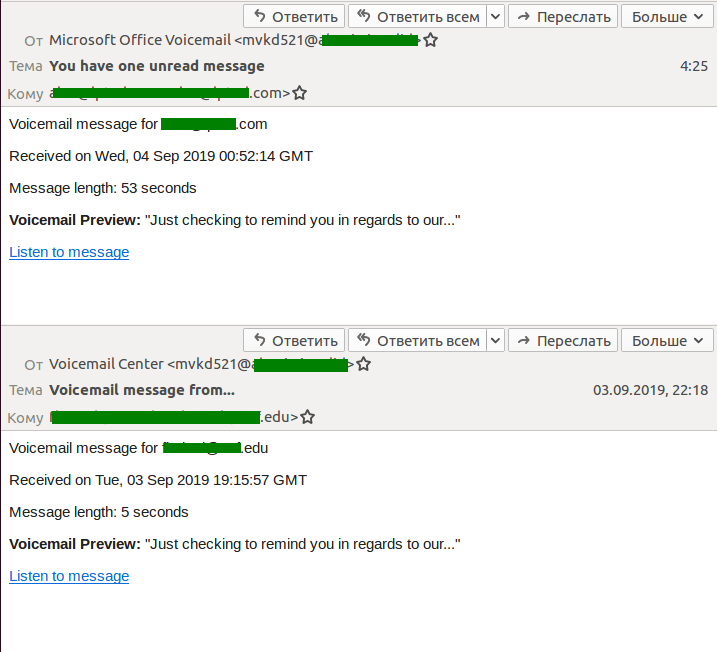
Last quarter, we observed a major spam campaign in which scammers sent emails pretending to be voicemail notifications. To listen to the supposed message, the recipient was invited to click or tap the (phishing) link that pointed to a website mimicking the login page of a popular Microsoft service. It was a page for signing either into Outlook or directly into a Microsoft account.
The attack was aimed specifically at corporate mail users, since various business software products allow the exchange of voice messages and inform users of new ones via email.
It is worth noting that the number of spam attacks aimed specifically at the corporate sector has increased significantly of late. Cybercriminals are after access to employees’ email.
Another common trick is to report that incoming emails are stuck in the delivery queue. To receive these supposedly undeliverable messages, the victim is prompted to follow a link and enter their corporate account credentials on another fake login page, from where they go directly to the cybercriminals. Last quarter, our products blocked many large-scale spam campaigns under the guise of such notifications.
Statistics: spam
Proportion of spam in mail traffic

Share of spam in global mail traffic, Q2 and Q3 2019 (download)
In Q3 2019, the largest share of spam was recorded in August (57.78%). The average percentage of spam in global mail traffic was 56.26%, down 1.38 p.p. against the previous reporting period.
Sources of spam by country
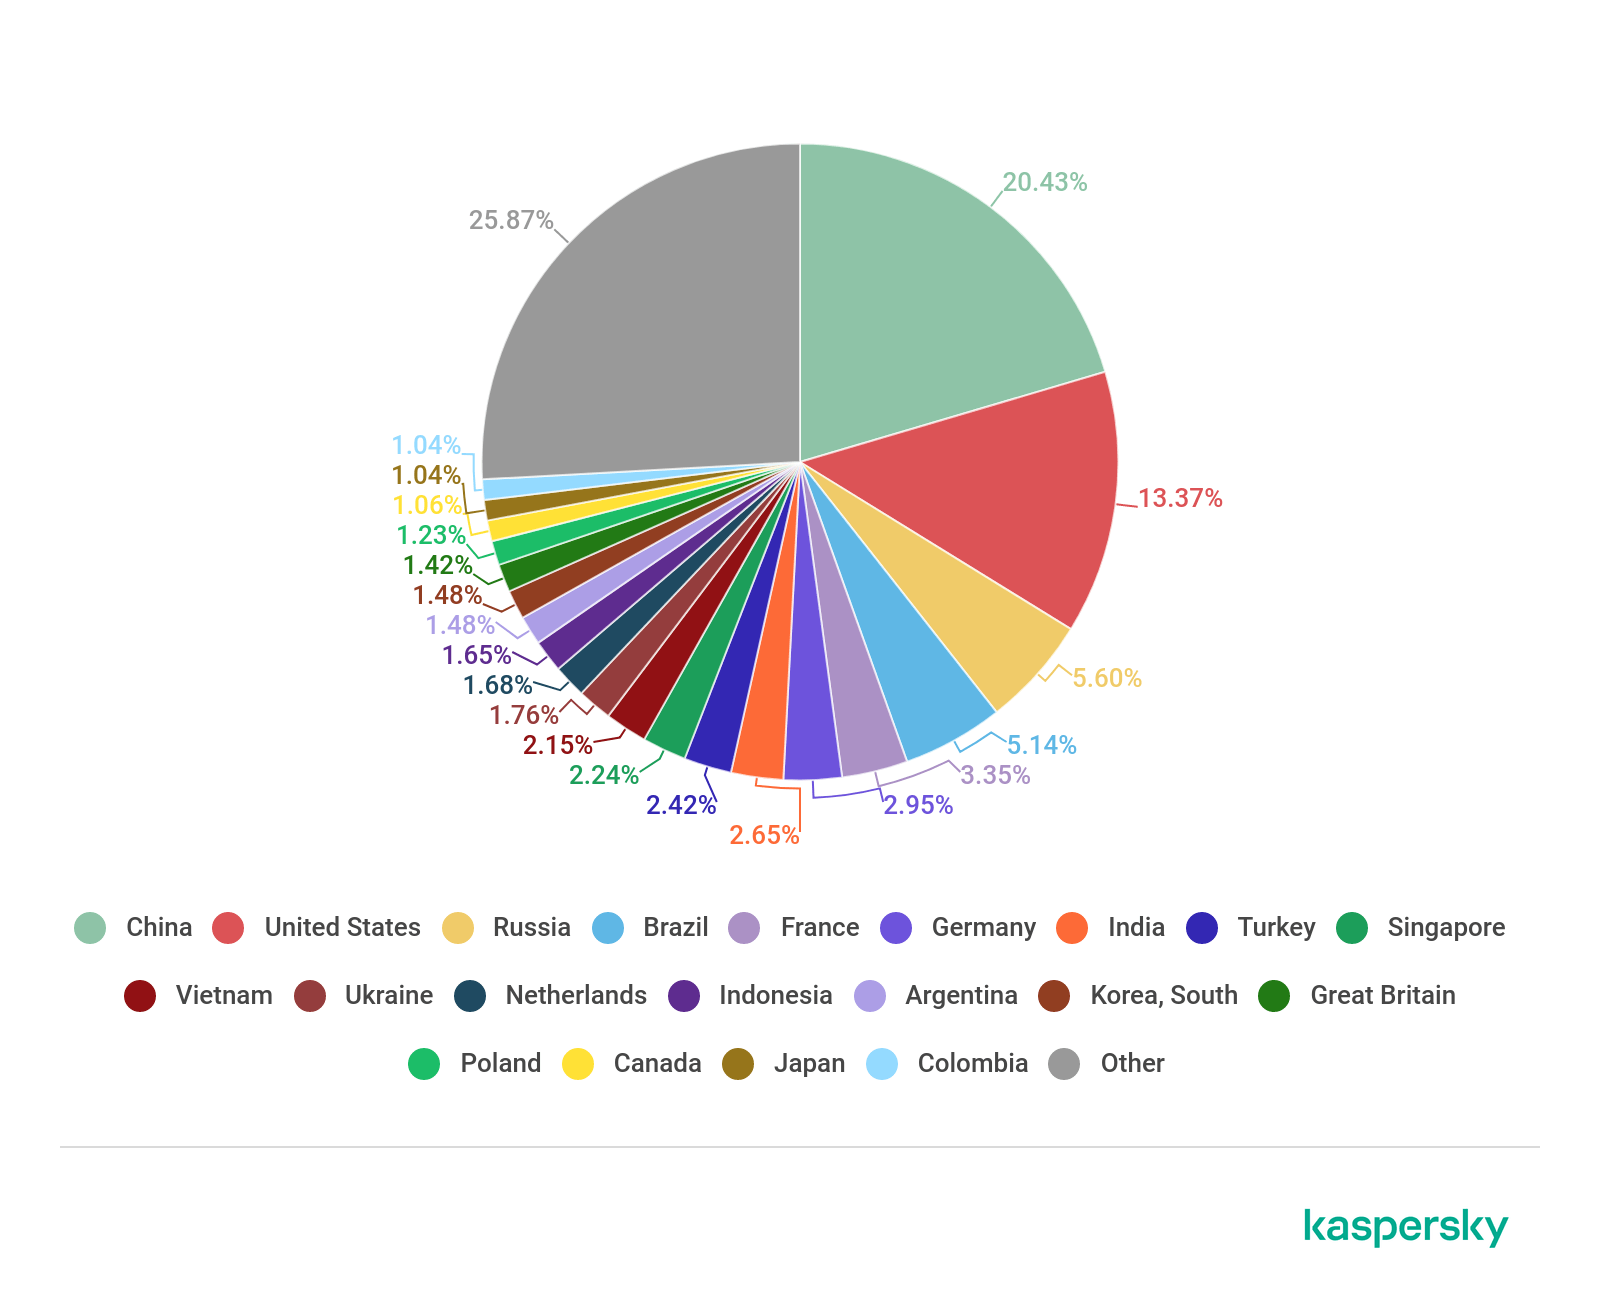
Sources of spam by country, Q3 2019 (download)
The TOP 5 spam-source countries remain the same as last quarter, only their percentage shares are slightly different. China is in first place (20.43%), followed by the US (13.37%) and Russia (5.60%). Fourth position goes to Brazil (5.14%) and fifth to France (3.35%). Germany took sixth place (2.95%), followed — with a gap of less than 0.5 p.p. — by India (2.65%), Turkey (2.42%), Singapore (2.24%), and Vietnam (2.15%).
Spam email size
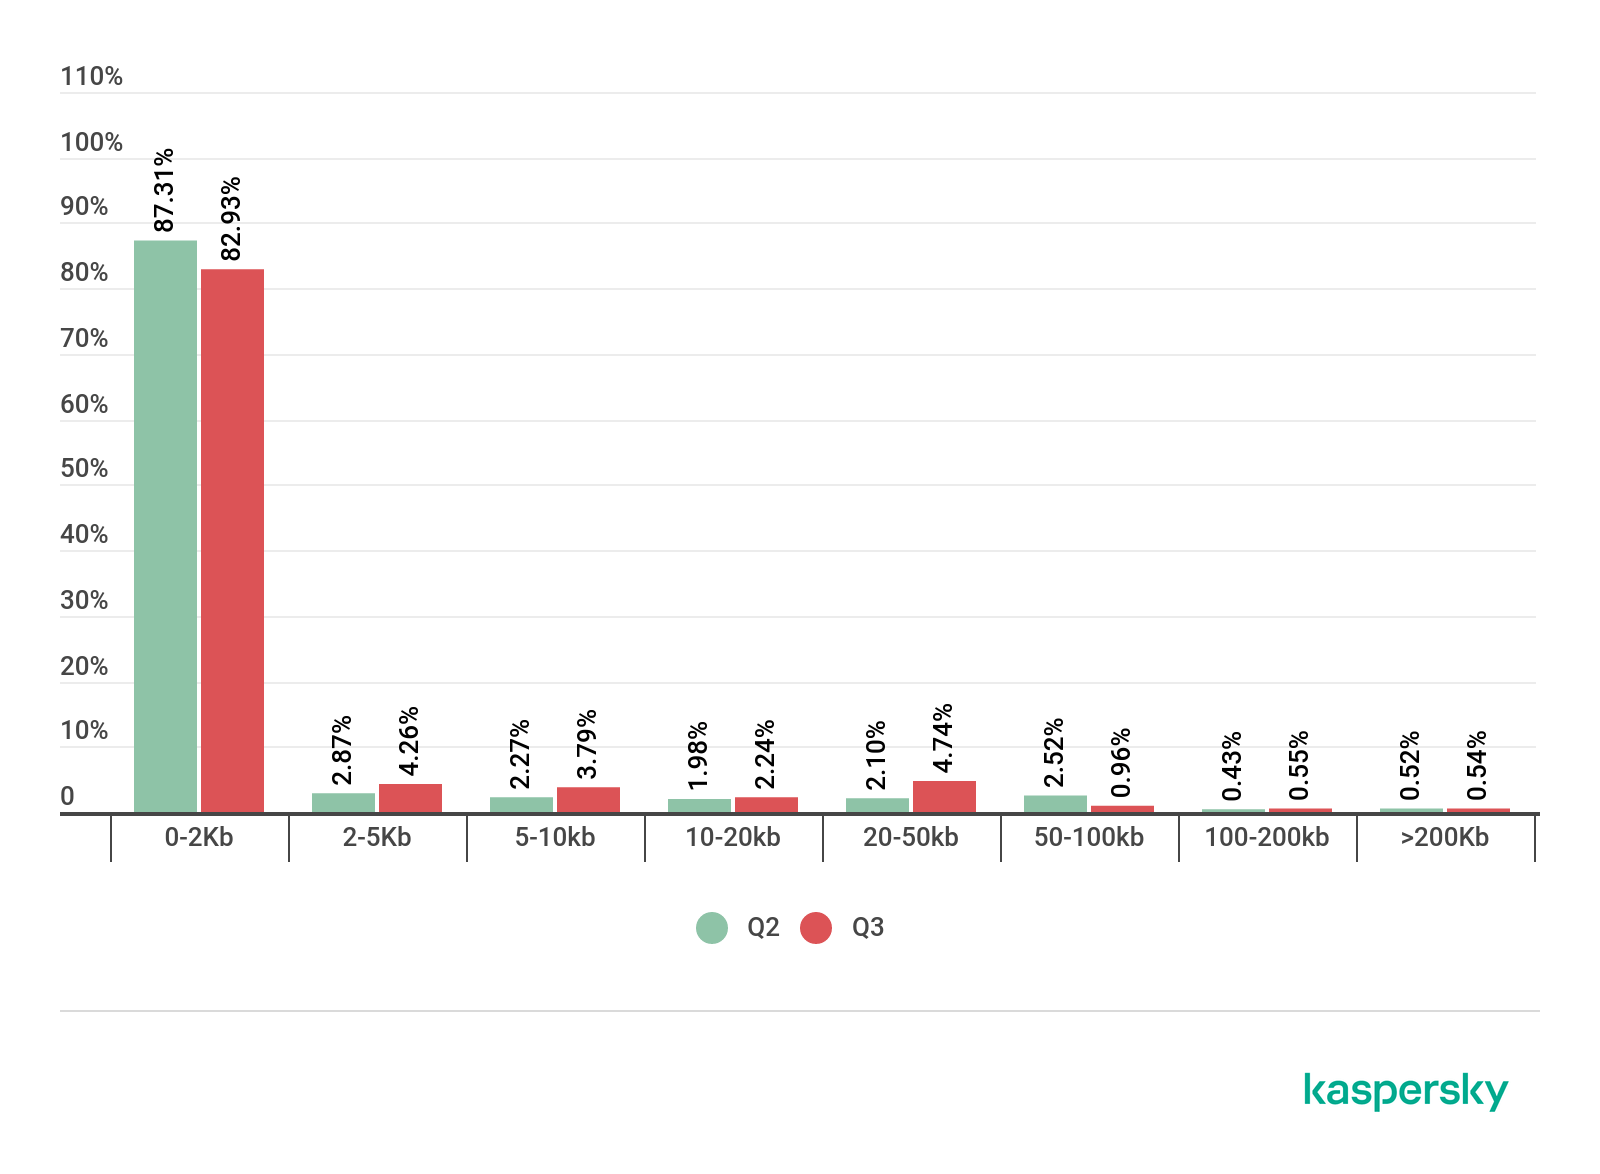
Spam email size, Q2 and Q3 2019 (download)
In Q3 2019, the share of very small emails (up to 2 KB) in spam decreased by 4.38 p.p. to 82.93%. The proportion of emails sized 5-10 KB grew slightly (by 1.52 p.p.) against the previous quarter to 3.79%.
Meanwhile, the share of 10-20 KB emails climbed by 0.26 p.p. to 2.24%. As for the number of 20-50 KB emails, their share changed more significantly, increasing by 2.64 p.p. (up to 4.74%) compared with the previous reporting period.
Malicious attachments in email
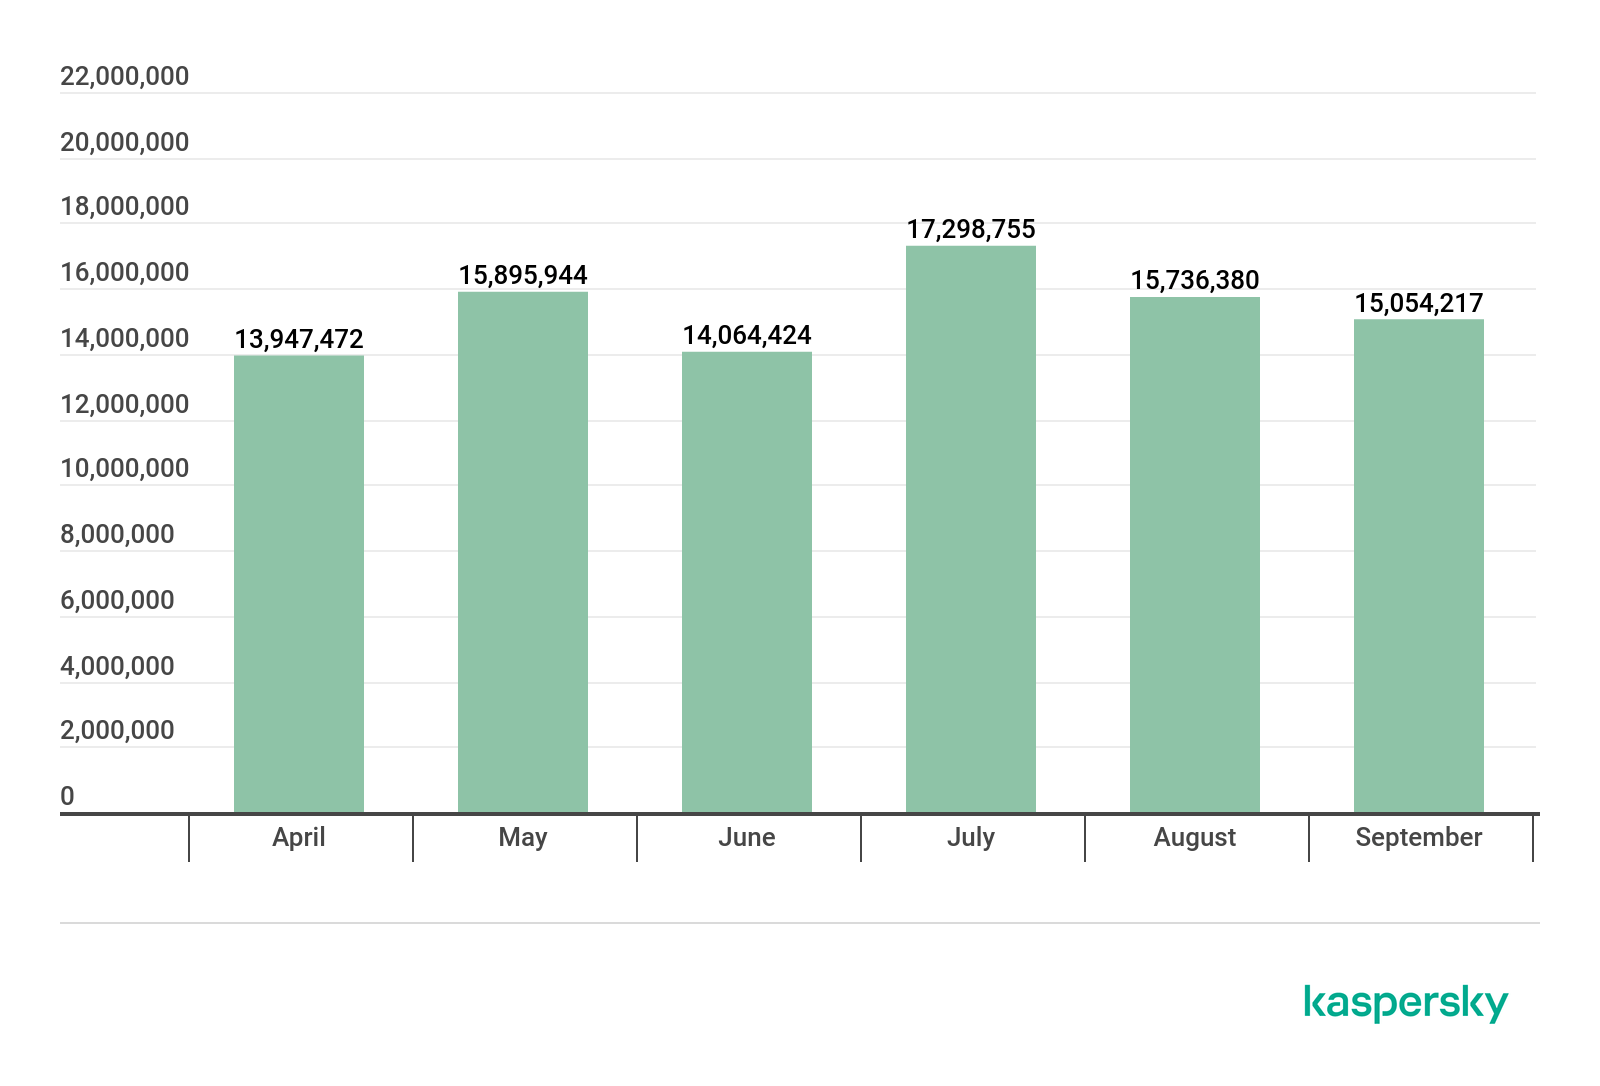
Number of Mail Anti-Virus triggerings, Q2 2019 – Q3 2019 (download)
In Q3 2019, our security solutions detected a total of 48,089,352 malicious email attachments, which is almost five million more than in Q2. July was the most active month with 17 million Mail Anti-Virus triggerings, while August was the “calmest” — with two million fewer.

TOP 10 malicious attachments in mail traffic, Q3 2019 (download)
In Q3, first place by prevalence in mail traffic went to the Office malware Exploit.MSOffice.CVE-2017-11882.gen (7.13%); in second place was the Worm.Win32.WBVB.vam worm (4.13%), and in third was another malware aimed at Microsoft Office users, Trojan.MSOffice.SAgent.gen (2.24%).
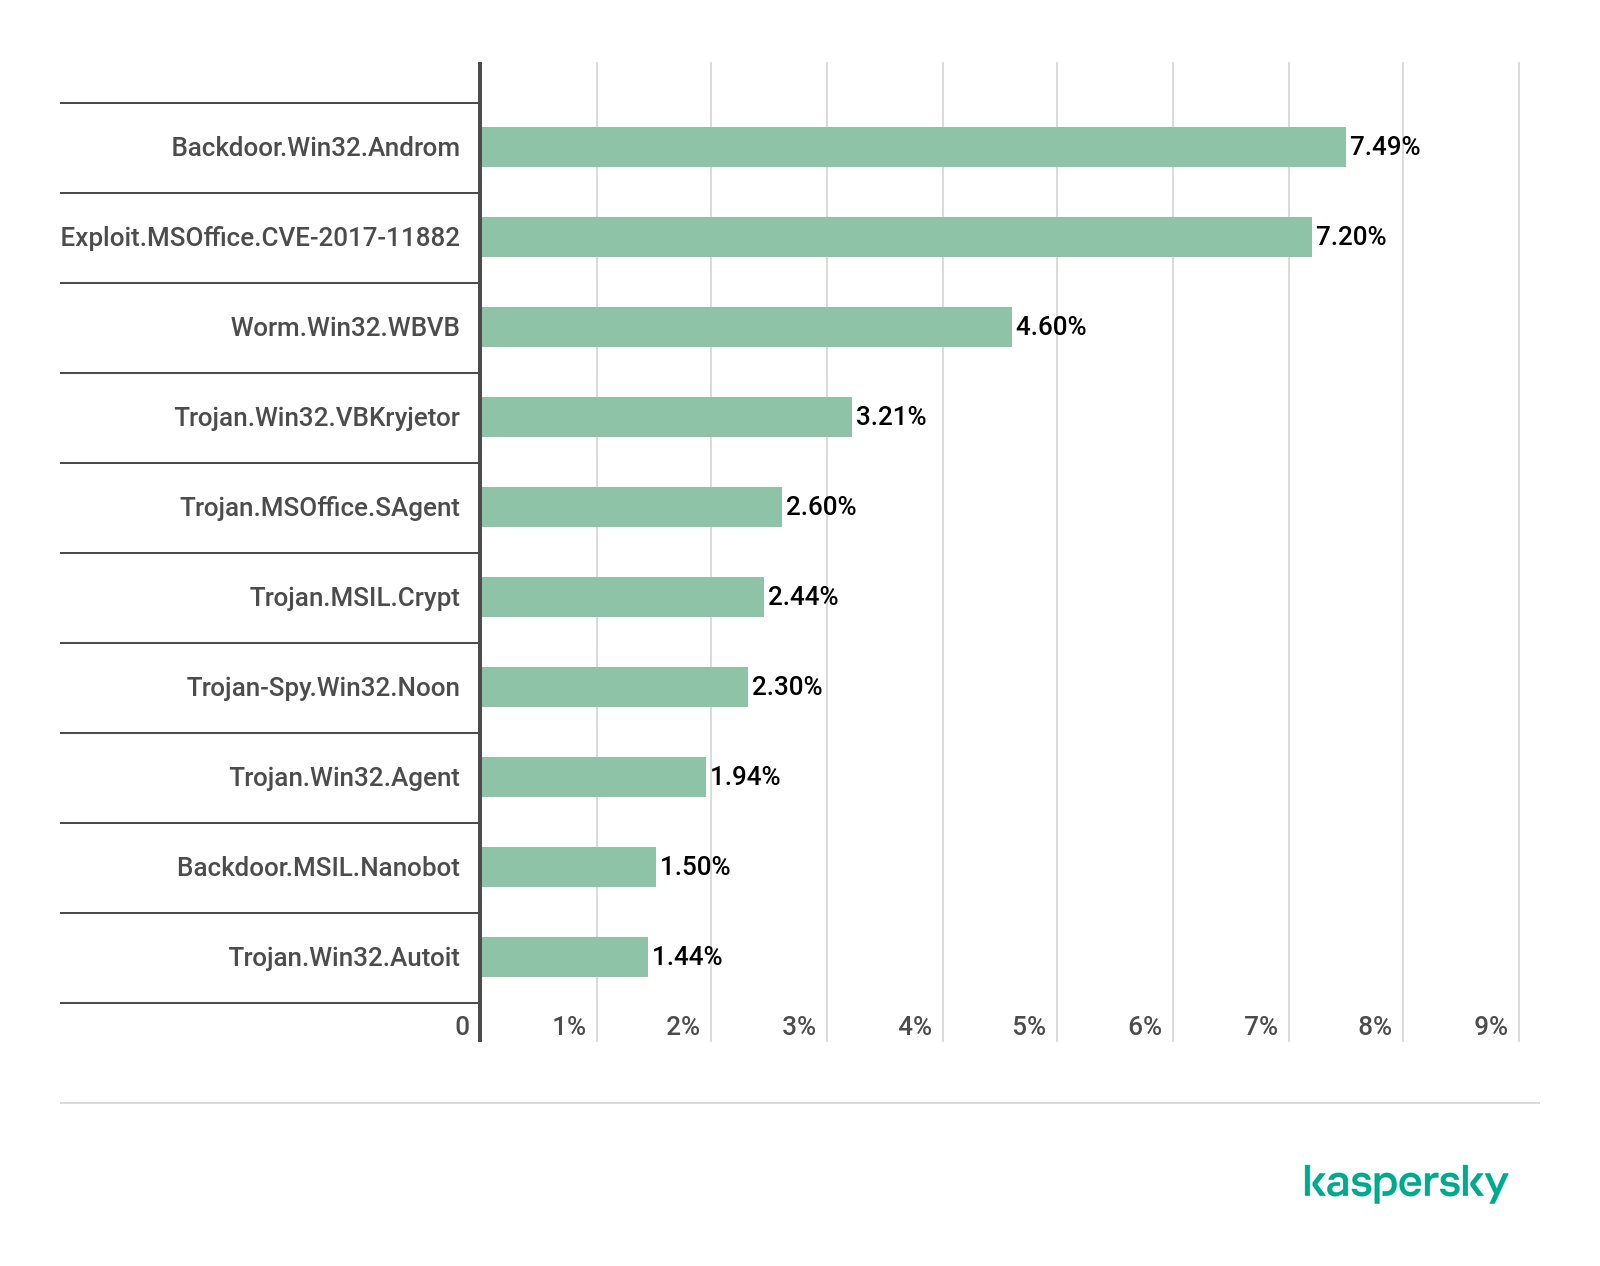
TOP 10 malware families, Q3 2019 (download)
As for malware families, the Backdoor.Win32.Androm family (7.49%) claimed first place.
In second place are Microsoft Office exploits from the Exploit.MSOffice.CVE-2017-11882.gen family (7.20%). And in third is Worm.Win32.WBVB.vam (4.60%).
Countries targeted by malicious mailings

Distribution of Mail Anti-Virus triggerings by country, Q3 2019 (download)
First place by number of Mail Anti-Virus triggerings in Q3 2019 was retained by Germany. Its score increased by 0.31 p.p. to 10.36%. Vietnam also remained in the TOP 3, rising to second position (5.92%), and Brazil came in third just a tiny fraction behind.
Statistics: phishing
In Q3 2019, the Anti-Phishing system prevented 105,220,094 attempts to direct users to scam websites. The percentage of unique attacked users was 11.28% of the total number of users of Kaspersky products worldwide.
Attack geography
The country with the largest share of users attacked by phishers in Q3 2019 was Venezuela (30.96%), which took second place in the previous quarter and has since added 5.29 p.p.
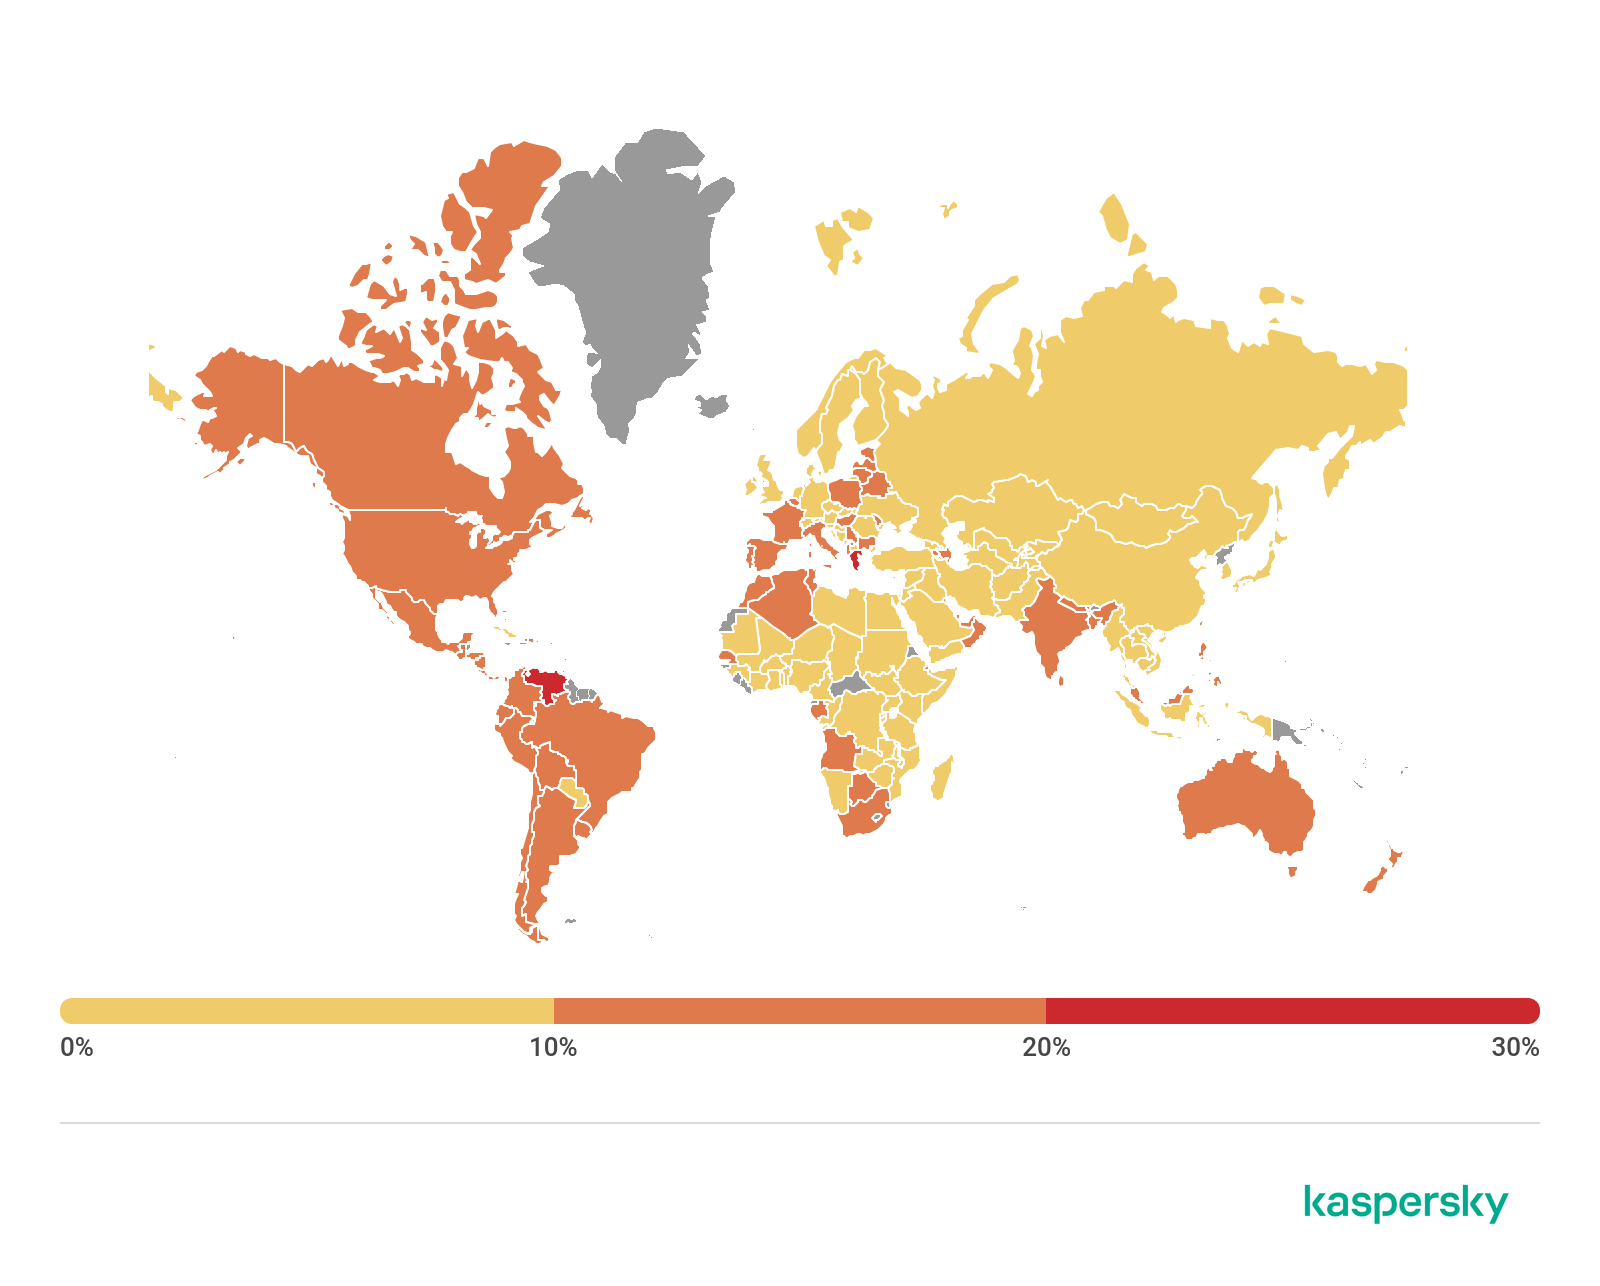
Geography of phishing attacks, Q3 2019 (download)
Having lost 3.53 p.p., Greece ranked second (22.67%). Third place, as in the last quarter, went to Brazil (19.70%).
| Country | %* |
| Venezuela | 30.96 |
| Greece | 22.67 |
| Brazil | 19.70 |
| Honduras | 17.58 |
| Guatemala | 16.80 |
| Panama | 16.70 |
| Australia | 16.18 |
| Chile | 15.98 |
| Ecuador | 15.64 |
| Portugal | 15.61 |
* Share of users on whose computers the Anti-Phishing system was triggered out of all Kaspersky users in the country
Organizations under attack
The rating of categories of organizations attacked by phishers is based on triggers of the Anti-Phishing component on user computers. It is activated every time the user attempts to open a phishing page, either by clicking a link in an email or a social media message, or as a result of malware activity. When the component is triggered, a banner is displayed in the browser warning the user about a potential threat.
For the first time this year, the share of attacks on organizations in the Global Internet Portals category (23.81%) exceeded the share of attacks on credit organizations (22.46%). Social networks (20.48%) took third place, adding 11.40 p.p. to its share.

Distribution of organizations subjected to phishing attacks by category, Q3 2019. (download)
In addition, the TOP 10 said goodbye to the Government and Taxes category.
Its place was taken by the Financial Services category, which unites companies providing services in the field of finance that are not included in the Banks or Payment Systems categories, which cover providers of insurance, leasing, brokerage, and other services.
Conclusion
The average share of spam in global mail traffic (56.26%) this quarter decreased by 1.38 p.p. against the previous reporting period, while the number of attempted redirects to phishing pages compared to Q2 2019 fell by 25 million to just over 105 million.
Top in this quarter’s list of spam-source countries is China, with a share of 20.43%. Our security solutions blocked 48,089,352 malicious mail attachments, while Backdoor.Win32.Androm became the most common mail-based malware family — its share of mail traffic amounted to 7.49%.
Spam and phishing in Q3 2019
Comment
Table of Contents
- Quarterly highlights
- Amazon Prime
- Scammers collect photos of documents and selfies
- YouTube and Instagram
- Back to school
- Apple product launch
- Attacks on pay TV users
- Spam through website feedback forms
- Attacks on corporate email
- Statistics: spam
- Proportion of spam in mail traffic
- Sources of spam by country
- Spam email size
- Malicious attachments in email
- Countries targeted by malicious mailings
- Statistics: phishing
- Conclusion
From the same authors


In the same category


George Moody
Hi There,
The map is no longer interactive. I understand you do this to reduce size which is totally understandable.
Is there any way you can send me a link to an interactive map or the raw data.
It would be greatly appreciated.
Feel free to contact me via email.
Yuliya
Hi!
I suppose, you mean “Phishing attack geography, Q3 2019” map?
The data is no secret, so there is no need to send it by mail, though the list is not short.
Here it is:
Venezuela 30,97%
Greece 22,67%
Brazil 19,71%
Honduras 17,58%
Guatemala 16,81%
Panama 16,71%
Australia 16,19%
Chile 15,98%
Ecuador 15,65%
Portugal 15,62%
Nicaragua 14,78%
Argentina 14,70%
New Zealand 14,59%
Algeria 14,37%
El Salvador 14,27%
Peru 14,12%
Bolivia 14,04%
Moldova 13,41%
Dominican Republic 13,36%
Reunion 13,34%
Philippines 13,23%
Nepal 13,20%
Sri Lanka 13,10%
Colombia 13,05%
Mexico 12,87%
Martinique 12,84%
Morocco 12,73%
South Africa 12,72%
United States 12,70%
Djibouti 12,63%
Belgium 12,58%
Armenia 12,48%
France 12,46%
Spain 12,42%
Guadeloupe 12,26%
Qatar 12,25%
Uruguay 12,19%
Azerbaijan 12,16%
Albania 12,14%
United Arab Emirates 12,07%
Costa Rica 11,93%
Angola 11,63%
Maldives 11,55%
Taiwan, province of China 11,54%
Latvia 11,46%
Malaysia 11,38%
Belarus 11,33%
Italy 11,27%
Hungary 11,16%
India 11,09%
Oman 11,05%
Serbia 11,05%
Estonia 10,95%
Bangladesh 10,94%
Israel 10,94%
Bahrain 10,88%
Gabon 10,87%
Canada 10,83%
Tunisia 10,80%
Lithuania 10,52%
Kuwait 10,48%
Palestine, state of 10,45%
Malta 10,25%
Poland 10,24%
Senegal 10,15%
Botswana 10,13%
Bulgaria 10,13%
Myanmar 9,97%
Mozambique 9,95%
Republic of Korea 9,84%
Cambodia 9,84%
Mongolia 9,79%
Turkey 9,71%
Saudi Arabia 9,61%
Kenya 9,52%
Cameroon 9,50%
Zimbabwe 9,43%
Macao 9,42%
United Kingdom 9,35%
Malawi 9,35%
Nigeria 9,34%
Indonesia 9,28%
Lebanon 9,24%
North Macedonia 8,89%
Thailand 8,83%
Paraguay 8,78%
Russian Federation 8,67%
Uzbekistan 8,64%
Switzerland 8,56%
Cyprus 8,54%
Slovenia 8,53%
Pakistan 8,48%
Finland 8,42%
Luxembourg 8,42%
Namibia 8,38%
Kazakhstan 8,26%
Puerto Rico 8,26%
Iraq 8,22%
Zambia 8,14%
Slovakia 8,10%
Jordan 8,03%
Vietnam 8,02%
Libya 7,94%
Madagascar 7,94%
Singapore 7,76%
Bosnia and Herzegovina 7,74%
Yemen 7,73%
Romania 7,72%
Cote D’ivoire 7,59%
Croatia 7,56%
Georgia 7,50%
Rwanda 7,46%
Mauritania 7,39%
Egypt 7,33%
Japan 7,32%
Austria 7,27%
Ghana 7,25%
Germany 7,25%
Kyrgyzstan 7,23%
Uganda 7,18%
Afghanistan 7,15%
Montenegro 7,13%
Somalia 7,11%
Mauritius 7,06%
Tanzania 6,95%
Congo 6,66%
China 6,66%
Syrian Arab Republic 6,49%
Hong Kong 6,44%
Sudan 6,28%
Norway 6,16%
Lao People’s Democratic Republic 6,10%
Cuba 6,05%
Togo 5,95%
Ukraine 5,94%
Tajikistan 5,59%
Burundi 5,49%
Chad 5,45%
Congo 5,16%
South Sudan 5,06%
Benin 4,99%
Ethiopia 4,97%
Niger 4,92%
Iran 4,84%
Mali 4,83%
Ireland 4,68%
Guinea 4,51%
Netherlands 4,34%
Czech Republic 4,33%
Sweden 4,02%
Burkina Faso 4,00%
Denmark 3,64%
Turkmenistan 2,67%