

Authors
Kaspersky Anti-Spam protects users all over the world. The Anti-Spam Lab processes more than one million messages captured by our honeypots every day. Content filtering, technical header analysis, unique graphical signatures and cloud technologies are all employed to ensure users are protected, with our analysts creating new signatures 24 hours a day, 7 days a week.
Summary
- In Q2 of 2011, the share of spam in mail traffic continued to grow, averaging 82.5%.
- The share of spam emails originating from Asia and Latin America exceeded 60% of the total volume of all spam.
- The percentage of emails containing malicious attachments continued to grow and averaged 3.86%, with Russia, the US and Vietnam accounting for the highest mail antivirus detection rates.
- The share of phishing emails remains low (0.02%), but phishing is becoming more targeted.
- Spam still contains a lot of fake notifications from popular resources including from the ‘cloud’
- Anti-spam laws are discussed in Russia, while Japan has introduced a law making it illegal to spread pornographic spam.
Evolution of spam
From personal correspondence to official notices
Email appeared quite a few years ago, but its popularity has recently been on the wane. The advent of social networks, Web 2.0, SMS services and now cloud technologies has seen users increasingly turning to the Internet to send messages. We communicate via instant messengers (IM), share news via blogs, make friends on social networks and discuss ideas in the cloud. What’s left for the humble email? Links to hosting and photo sharing, notifications from social networks (invitations to become friends, participate in discussions, or view new photos), letters from banks, online stores and delivery services, or invitations to read documents ‘in the cloud’. It’s safe to say that email is now primarily used as a notification tool.
Spammers have never lagged behind the times and this is reflected in more and more spam imitating the sort of notifications mentioned above. Fake notifications used to be the reserve of phishing messages and emails with malicious attachments; nowadays this trend has clearly spread to other types of spam.
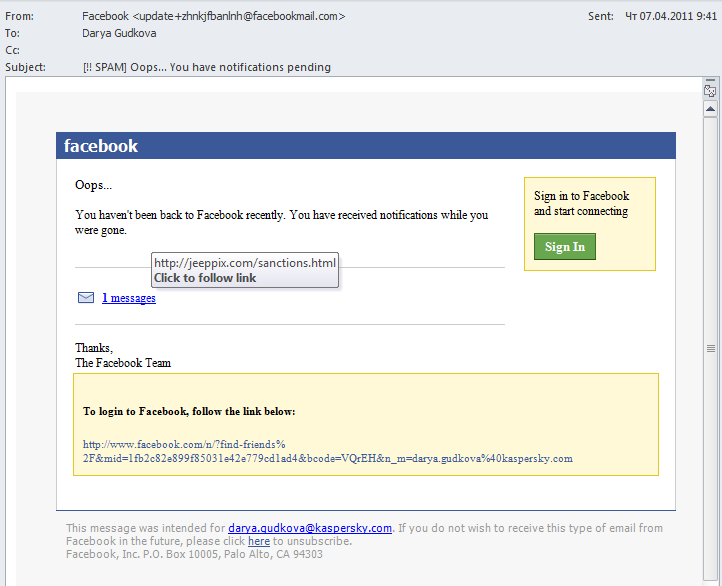
Below is a fake Facebook notification containing a link to a malicious site:
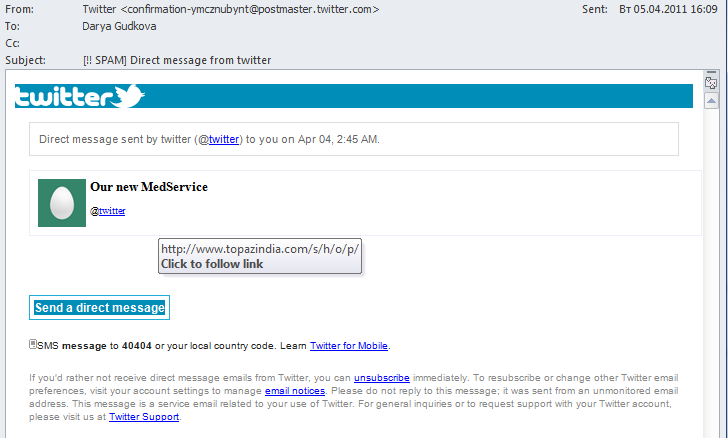
Here is another fake notification using the Twitter name that contains a link to a pharmaceutical site:
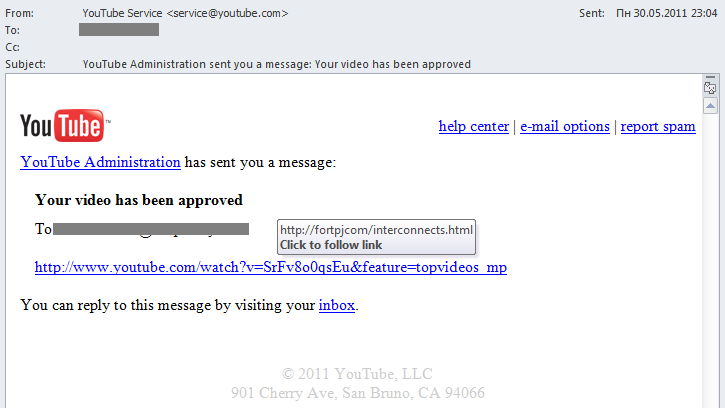
This fake YouTube notification redirects users to another pharmaceutical site:
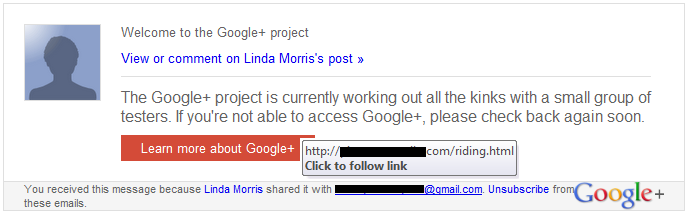
These spammers are trying to trick users and simultaneously bypass anti-spam filters by exploiting the popularity of major resources. The newer and more interesting the resource, the more attractive it is for spammers. Even as we write this report we have found fake notifications from the recently launched Google+ project.
Spam ‘in the cloud’
The development of cloud technologies has seen the emergence of numerous free services. In Q2 of 2011, we saw a new stage in spam evolution as spammers started making use of these cloud services.
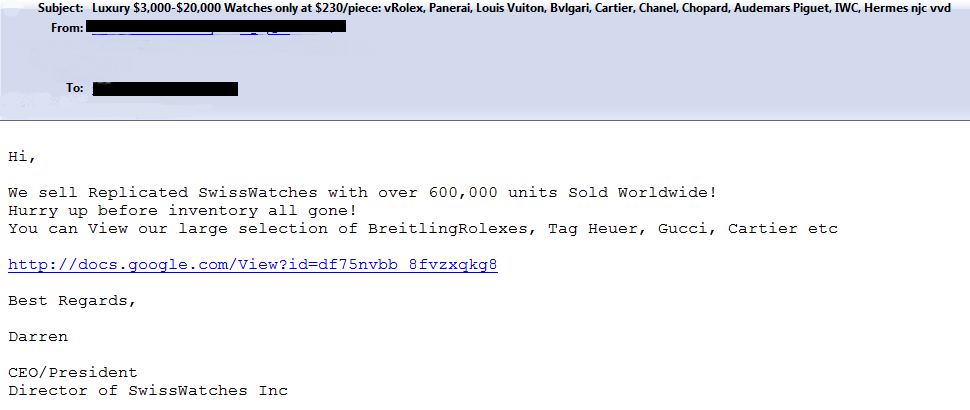
Some emails contained links to the Google Docs pages, which in turn redirected users to pharmaceutical sites or sites offering fake designer watches.
Below is an example of an email containing a link to Google Docs:
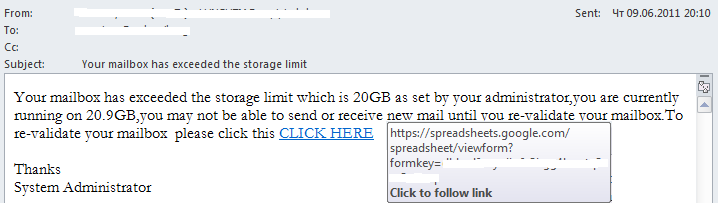
Criminals also used Google Spreadsheets to place their phishing pages.
Here is an example of an email containing a link to Google Spreadsheets:
The link in the message above led to a Google Spreadsheets page where users were asked to enter their personal data:
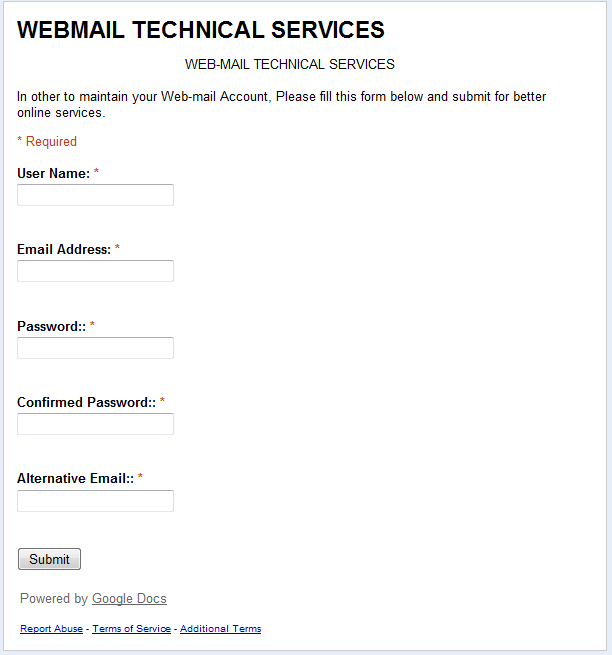
The form was designed so that when users clicked the ‘Submit’ button their personal data were sent to a third-party resource, i.e. to the phishers.
This service offers cybercriminals a free space for placing their fake pages. Moreover, users are less likely to suspect pages like these because, first of all, they are located on a popular resource and secondly, because the connection is performed via the HTTPS protocol which supports encryption.
Spam and social engineering
Technology may change but one thing remains the same – social engineering.
In the second quarter of 2011, spammers applied their traditional methods to lure users to their pages with the big news stories such as the royal wedding in the UK or Osama bin Laden’s death. It should be noted that the spammers displayed a rather creative approach: among the real news there were quite a few fictitious stories.
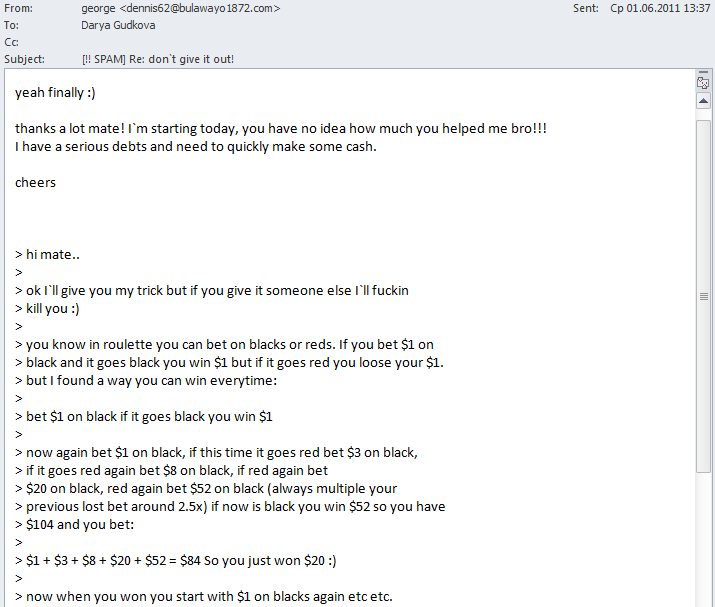
In addition, the spammers used the time-honored trick of fake personal correspondence:
Spam and the law
The second quarter of 2011 was marked by several spam-related events in the law enforcement sphere.
On 13 May, the working group of the Information Technology and Communications Committee together with the Russian Association for Electronic Communications (RAEC) submitted a draft law on combating the production and dissemination of spam to the Russian State Duma for consideration. The proposed law gives a definition of spam and considers important issues such as prior user consent to receive mass mailings and the ability to unsubscribe. It would also make it necessary to clearly name the organization responsible for launching a mass mailing as well as ban automatic email address collection tools. Importantly, the law proposes making it a crime to send unsolicited mail. However, some lawyers claim the draft law does not specify who will be in charge of investigating and charging spammers.
There was another major development on the legal front in late June when a Moscow court sanctioned the arrest of Pavel Vrublevsky, CEO of ChronoPay and, according to some experts, the owner of the affiliate network Rx-promotions which specializes in spreading pharmaceutical spam. Vrublevsky was accused of organizing a DDoS attack against the electronic payment system Assist which blocked the online booking system of Aeroflot, Russia’s largest airline. Incidentally, Pavel Vrublevsky was once head of the Anti-spam Commission on the Internet Development working group established by the Ministry of Communications of the Russian Federation.
We recently wrote in our Spam Report for June that after the closure of the Rustock command centers Microsoft decided to take matters further. The company has decided to initiate a legal case against the creators of the botnet. We consider Microsoft’s actions justified because, according to our statistics, cybercriminals start developing new botnets immediately after the old ones are closed; if the botmasters are imprisoned, it may disrupt this process.
Also in June, the Japanese parliament passed an important law that makes the creation, distribution, purchase and storage of malicious programs as well as the distribution of pornographic spam a criminal offence.
Statistical summary
Spam in mail traffic
The share of spam in mail traffic continues to grow. In Q2 of 2011, it averaged 82.5%. A low of 72.2% was recorded on 1 April with a peak of 91.4% on 29 May.
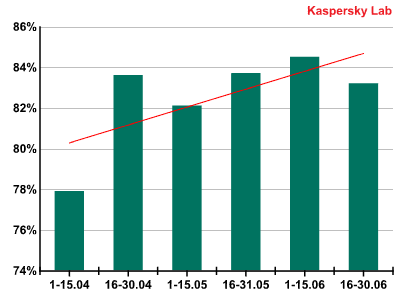
Spam in mail traffic in Q2 2011
The capacities of those botnets that were closed last year and early this year are gradually being restored. However, there are shifts in the geographical distribution of zombie machines.
Sources of spam by country
In the second quarter of 2011, spam was sent most actively from developing countries: India (+4.26 percentage points), Brazil (+3.14 percentage points) and Indonesia (+1.66 percentage points).

Sources of spam in Q2 2011
India maintained its lead in the list of the 20 most popular sources of spam, but this quarter its contribution to the total volume of spam increased by more than 4 percentage points and totaled 14.06%. There is a simple explanation for this: in the previous quarter, 5.99% of all blocked emails with malicious attachments were registered in the country, suggesting botmasters intended to infect users’ computers and add them to their botnets. The resulting botnet expansion is reflected in bigger flows of spam emails originating from India.
Brazil’s share has also grown throughout 2011, reaching 9.56% in June. Overall in Q2, Brazil accounted for 8.94% of all spam worldwide, moving it up to 2nd place in the rating.
Peru’s noticeable shift (+2.4 percentage points) is worthy of special mention: it moved up to 6th place accounting for 3.13% of all distributed spam – in the previous quarter the country didn’t even make it into the Top 20.
At the same time Russia’s share decreased by 2.75 percentage points and stood at 3.05%. After coming 2nd in Q1 of 2011, Russia has slipped down to 7th place this quarter. This was quite unexpected: Russia was and still remains the country where malware is detected most frequently in mail traffic. The malicious programs which the users receive via email are mostly worms. Some of them (e.g. Worm.Win32.AutoRun.cchs) include functions that intercept program messages, search for accessible network directories on an infected machine or connect to specified addresses in the Internet. This type of malicious program can also be used to download other malware and incorporate a machine into a botnet.
There are two possible explanations for the fact that Russia has fallen five places in the rating: either Russian users are protecting their computers more effectively, preventing botmasters from gaining control of them, or else the botnets are being used for different purposes, e.g. DDoS attacks. Additionally, as was mentioned above, a lot of mail worms were sent to Russian email accounts. The majority of these programs are designed to harvest email addresses, e.g. the Email-Worm.Win32.Netsky family, which means that cybercriminals may only be at the initial stage of creating botnets and Russia could well be among the Top 3 most popular sources of spam in the near future.
There are still low levels of spam emanating from the US, last year’s leader. In Q2 of 2011, the country finished in 16th place with 1.99%, a drop of 1.01 percentage points.
Despite the shifts that have taken place in the second quarter, the spam sources by country in 2011 are more evenly spread out compared to previous years. There are no absolute leaders and unlike previous ratings the top three are not responsible for half of all world spam. The zombie machines used to spread spam emails are distributed fairly evenly throughout the world. They are located in South Africa, on distant islands in the middle of the Pacific Ocean and in developed countries. This distribution signals the end of the spammers’ geographical expansion. There are no “botnet free” territories left. Developing countries attract botmasters due to the absence of anti-spam legislation and low IT security levels, while developed countries are of interest because of their fast, widely available Internet connections.
Following the effective anti-botnet campaign of 2010, we are now witnessing a growth in the number of botnets although they are relatively small. There are no noticeable ‘giants’ among the new botnets as was the case in the past with Cutwail or Rustock which used to account for the lion’s share of all spam. Either the spammers haven’t had enough time to increase capacities to where they can send millions of spam emails daily or they are deliberately not putting all their eggs in one basket so they can easily switch to another botnet if one of them is shut down. This also leads to a more even distribution of infected computers by country.
Sources of spam by region
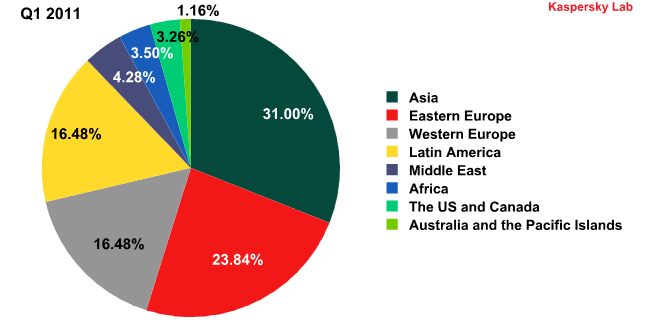
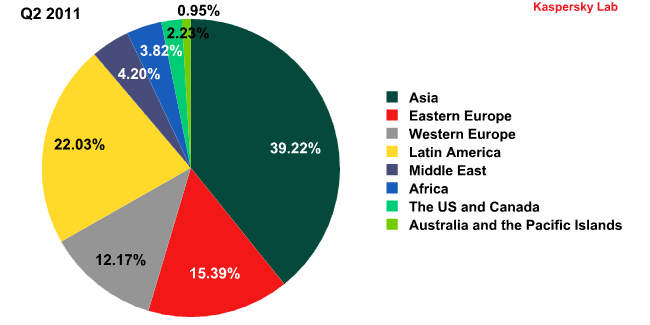
Sources of spam by region in Q1 2011 and Q2 2011
Asia (+8.22 percentage points) and Latin America (+5.55 percentage points) topped the rating of the most popular sources of spam by region. These two regions are responsible for more than 60% of all spam. As we stated in an earlier report, spammers are trying to organize new botnets in regions that are the least protected in terms of both legislation and technology – regions such as Asia and Latin America.
At the same time, eastern Europe’s share decreased considerably (-8.45 percentage points). However, it may soon start growing again: this region is very attractive for spammers in terms of its computerization and legislation.
The graph below shows the dynamics of spam distribution by month. A correlation between several regions can be clearly seen, e.g. the Asian and the Latin American lines are almost parallel. At the same time, the peaks registered in western Europe correspond to lows in Asia and Latin America and vice versa.
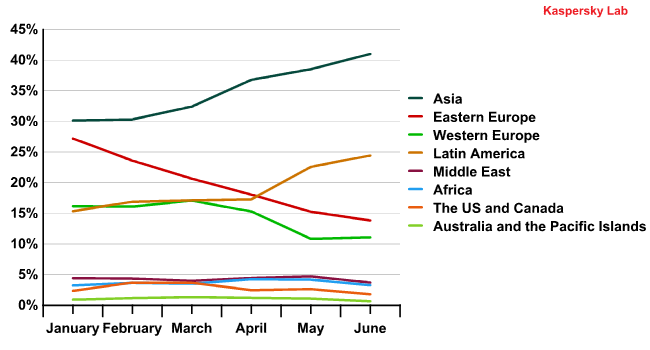
The dynamics of spam distribution by region (Q1 and Q2 2011)
Such correlation between Asia and Latin America is down to both regions lacking effective anti-spam laws and reliable IT protection. The spam originating from these regions is most probably sent from the same botnets.
Spam by category
After the closure of big botnets and their replacement with smaller ones, spam in different parts of the world has become very different. In Russia, for example, so-called affiliate spam has almost disappeared: the Medications and health-related goods and services category, a former leader of the category rating, ended Q2 in 8th place (1.8%). The majority of spam on the Russian Internet is currently ordered by small and medium-size business. The Education category which advertises various seminars and training remains the most popular spam category.
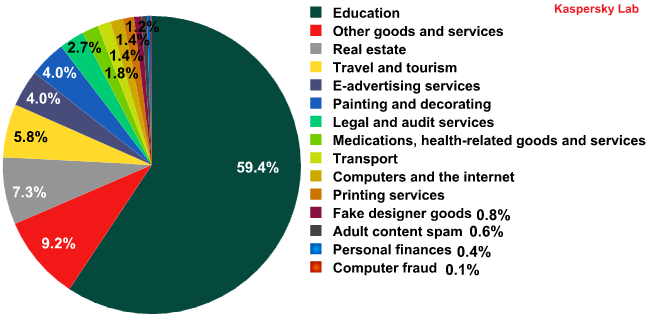
Spam by category on the Russian Internet in Q2 of 2011
It should also be noted that the move away from affiliate spam has caused changes in the language ratio – almost all English-language spam on the Russian Internet was affiliate spam; now the majority of spam emails are written in Russian.
Spam emails received by users in western Europe and America most often advertise fake designer goods and services. This category has become even more popular than medical spam. Additionally, French-language mailings contain a lot of Nigerian letters. Affiliate spam is not so popular.
Size of spam emails
Unlike the previous quarter when large emails were especially popular, in Q2 small and very small (under 1 KB in size) messages dominated spam traffic. The share of emails above 50 KB accounted for just 2.63% of all spam.
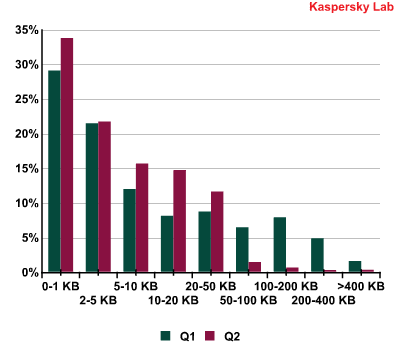
Spam emails by size in Q2 2011
Malware in mail traffic
In Q2 of 2011, the average percentage of emails with malicious attachments increased by nearly 0.81 percentage points, reaching 3.86%.
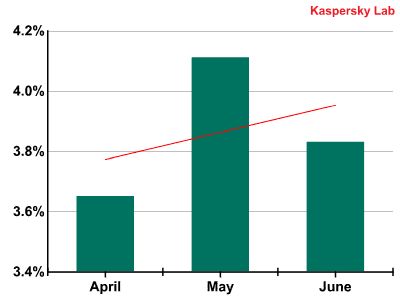
The percentage of spam with malicious attachments in the first quarter of 2011
As can be seen from the above graph, the growth in the share of emails containing malicious attachments that was seen in Q1 continued from April to June 2011.
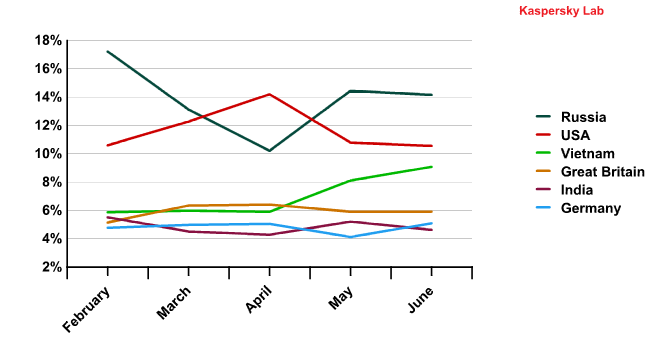
Email antivirus detection rates for different countries in the second quarter of 2011 were as follows:
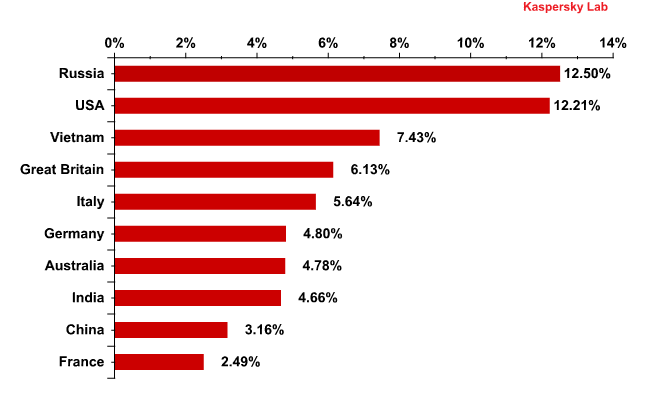
Email antivirus detection levels in the second quarter of 2011
The top three countries remained unchanged in the second quarter. Malicious attachments were most frequently found in mail traffic received in Russia (12.5%). The US occupied 2nd place with 12.21%, an increase of 1.8 percentage points compared with Q1. Vietnam was 3rd with 7.43% of all email antivirus detection activity (+0.46 percentage points).
India fell four places to 8th: in Q2 the amount of malware detected in the country’s mail traffic decreased by 1.33 percentage points and accounted for 4.66% of all email antivirus incidents.
Interestingly, after the proactive anti-botnet campaign which resulted in the closure of major botnets in the second half of 2010, the amount of malicious spam distributed by Indian users increased. We believe this was caused by the restoration of botnets in countries where cybercrime legislation is less developed.
The fall in the amount of malware detected in mail traffic in India in Q2 suggests that the botmasters have either restored the capacities of their botnets or their expansion on Indian territory is slowing down.
After the closure of Rustock in March 2010, the volume of spam sent to the US continued to grow and peaked in April. This dynamic can be clearly identified on the graph below.
Email antivirus detection activity in Q1 and Q2 2011
This is down to the fact that the US remained a very attractive bridgehead for cybercriminals creating botnets. It is a highly computerized territory with country-wide high-speed Internet access that is rarely found in developing countries. After the command centers of a big botnet were closed, the cybercriminals started to create a new one almost straight away. This is confirmed by changes in the Top 10 most popular malicious programs detected by our antivirus solutions on the territory of the US.
In February, the majority of malware sent to the country were malicious programs designed to steal users’ financial data (banking Trojans) or to extort money from users (pornblockers and rogue antivirus programs). However, in March and April more than half of the Top 10 entries were Trojan downloaders that installed malware on a user’s computer and added the infected machine to a botnet.
In May, however, the share of spam mailings with malicious attachments targeting the US decreased. A drop was also recorded in the number of downloaders that install bots on users’ computers.
The Top 10 malicious programs distributed via mail traffic
Four of the top 10 malicious programs detected most often by our email antivirus are mail worms. This comes as no surprise – once a mail worm is launched in mail traffic it will continue to distribute itself even if its creator has already lost interest in it. The main purpose of Email-Worm.Win32.Mydoom.m, Email-Worm.Win32.Mydoom.l and Email-Worm.Win32.Netsky.q is to harvest email addresses (which are then forwarded to cybercriminals) and spread themselves via mail traffic. The functionality of the fourth mail worm in the Top 10 – Email-Worm.Win32.Bagle.gt – is more sophisticated. It not only collects email addresses and distributes itself via mail traffic but also installs other malicious programs once it has penetrated a victim computer.
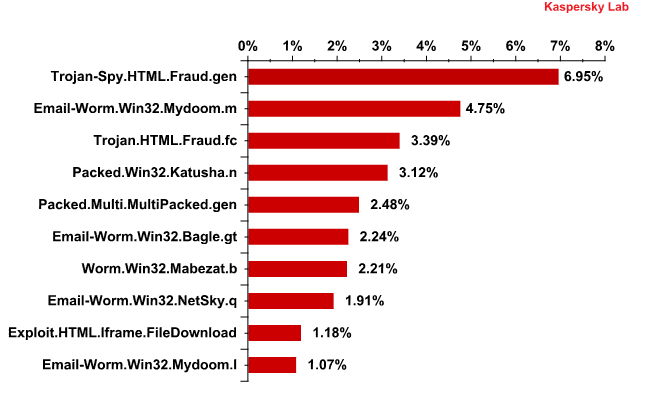
The Top 10 malicious programs distributed via mail traffic in Q2 2011
In the second quarter of 2011, Trojan-Spy.HTML.Fraud.gen maintained its leading position in the Top 10 list of malicious programs distributed via mail traffic. This Trojan uses spoofing technology and appears in the form of an HTML page. It comes with a phishing email containing a link to a fake site resembling that of a well-known bank or e-pay system where the user is asked to enter a login and a password. More details about this program can be found here.
Another Top 10 entry designed to steal users’ financial data is Trojan.HTML.Fraud.fc. Its functionality is similar to Trojan-Spy.HTML.Fraud.gen and it also appears in the form of an HTML page. It appears to target Brazilian users because it imitates the registration form of a major Brazilian bank.
In Q2 of 2011 we expected a burst of activity from rogue antivirus programs, but this never materialized. Packed.Win32.Katusha.n was the only Top 10 member linked to programs of this type. It represents a family of malicious programs used to pack other malware – usually rogue antivirus programs.
Phishing
In the second quarter of 2011 the share of phishing emails was very small and accounted for just 0.023% of all mail traffic. In May and June it remained low, with a slight increase in April when it averaged 0.03%.
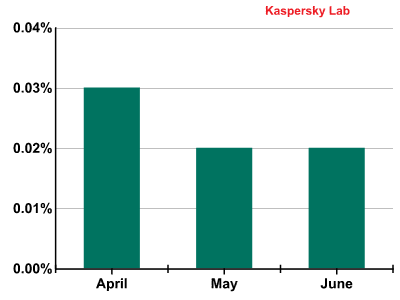
The percentage of phishing emails in mail traffic in Q2 2011
PayPal (+11.21 percentage points) and eBay (-2.89 percentage points) remain by far the most popular targets for phishers.
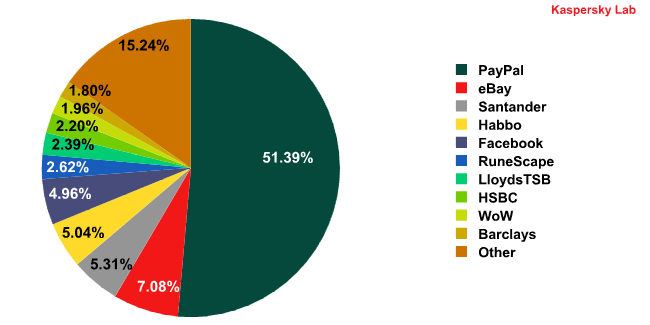
The Top 10 organizations targeted by phishers in Q2 2011*
* The rating is based on the number of phishing URLs on the Internet that attempt to obtain user logins and passwords for various online services. The rating is not demonstrative of the security level of the organizations named above, but rather the popularity of the services among users, which in turn explains their popularity among phishers.
Santander came 3rd, accounting for 5.31% of all phishing attacks, an increase of 1.9 percentage points compared with the previous quarter. Overall, phishers have not shown much interest in online banking systems: only one of the four banks in the Top 10 could be found among the leaders. Major banks such as HSBC and CHASE were targeted less often than in Q1: HSBC fell three places to 8th (-2.7 percentage points) while CHASE appeared at 19th place.
Social networking sites Habbo (-0.53 percentage points) and Facebook (-0.3 percentage points) took 4th and 5th positions respectively in terms of popularity with the phishers.
World of Warcraft (1.96%) was subject to fewer attacks than in the previous quarter (-0.94 percentage points). However, Q2 saw another online game, RuneScape, appear in the Top 10 phishing targets. The free game even surpassed the subscription-based World of Warcraft in terms of popularity, occupying 6th place in the rating and accounting for 2.62% of all phishing attacks.
For the second quarter in a row Google remained outside the Top 10. However, the social network Orkut that is owned by Google was in 11th place and other Google services came 13th. The combined total of phishing attacks on Orkut and other Google services (3.04%) exceeded the number of attacks targeting RuneScape.
In the near future we expect to see a rise in the number of attacks on the new Google social network Google+. It is currently invitation-only, which is all the more reason for cybercriminals to take advantage of people’s desire to get into the closed community by offering fake invitations that include both phishing links and malicious code.
Google should also be mentioned in connection with another phishing-related incident. In early June 2011 it was announced that Chinese hackers had gained access to the Google accounts of several high-ranking US officers using ‘spear phishing’. As the name suggests, this type of attack is more targeted. The straightforward scheme involves an attack on a group of users that are clients of a specific service. They obtain an exact copy of the official notification used by that service containing a link to the registration page which is also a perfect imitation of the original. It is claimed that this was the scheme used to access the accounts of the high-ranking officers.
Chinese officials deny that any of their citizens were involved in the attack and called Google “a political tool” that the US employs to tarnish the country’s reputation.
It should be noted that some spear phishing scams are much more sophisticated. We are used to the impersonal form of address in phishing emails such as “Dear user” or “Dear client”. However, more subtle methods make use of both a person’s name and even the name of the company they work for or are dealing with. Using such information makes it much easier to trick an unsuspecting user – after all, the phishing email looks just like the original notifications used by the service in question and even contains the user’s name.
Spear phishing is a relatively new trend which criminals use to target both individual users and big companies as was the case with RSA. Cybercriminals know only too well that people are the weakest link in any security system.
We expect to see more and more spear phishing attacks in the near future. They may also start targeting small companies: they are of more interest than individual users in terms of potential profits and unlike large corporations small companies usually do not have reliable IT protection.
Conclusion
The content of our email boxes changes with every year, especially the content of our personal email accounts. We are receiving less traditional emails because there are more convenient ways to exchange information. Instead, we receive notifications from social networks, links to various photo and video hosting sites as well as file sharing services. Emails may now also contain links to documents in the cloud.
Spam reflects the situation with normal emails. Short messages containing links to third-party sites dominate mail traffic. Other types of spam imitate official notifications from popular websites. With the appearance of cloud technologies spammers have begun to use cloud resources to create fake notifications. What has not changed is the human factor, hence social engineering: news stories (both true and imaginary), imitation of personal correspondence and other types of tricks to lure users all remain popular with the spammers.
Spam has recently become more targeted. Spam messages sent to different countries increasingly differ both in terms of language and content. Current fraudulent attacks performed using spam technologies often target strictly defined groups of users. The traditional distribution of spam by region may have been affected by the closure of major botnets – it has lost its global character forcing spammers to use smaller botnets as effectively as possible which in turn makes them think about their target audiences.
Asia and Latin America remained the most popular sources of spam by region. This was to be expected as these two regions remain very attractive for the spammers due to the absence of anti-spam laws and poorly protected Internet users. However, we soon expect to see the US back in the list of the main spam distributors: such a large country with high-bandwidth Internet cannot remain outside the spammers’ operations despite anti-spam legislation and a high level of IT protection.
Spam is now being distributed more evenly throughout the world: extensive computerization means there are no longer any regions that are not of interest to the botmasters. We would like to think that with the introduction of effective anti-spam legislation the number of regions acting as sources of spam will decrease in future.
From the same authors


In the same category


Spam in Q2 2011