

Authors
Spam in mail traffic
In the third quarter of 2009, the percentage of spam in mail traffic averaged 85.7%.
As is the norm, the percentage of spam in mail traffic fell over the summer months. In September the volume began to increase significantly, although this doesn’t represent the general trend, just a seasonal tendency.

Spam in mail traffic: Q3 2009
A peak of 91.3% was recorded on 27 September, with a low of 76.3% on 1 August – this being the only instance during the quarter when the level of spam dropped below 80%.
Phishing
The percentage of phishing emails in the third quarter was double that of the previous quarter (0.49%) and averaged 1% of the total volume of mail traffic.

As before, PayPal and eBay were the most targeted resources. August was the only month during which they were both temporarily relieved of their leading positions.

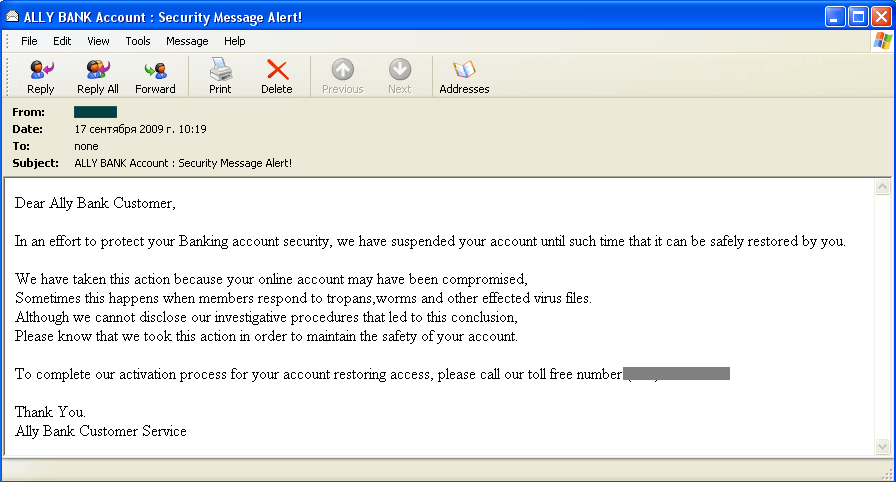
As can be seen from the graph, August’s share of phishing attacks targeting PayPal and eBay decreased significantly, giving way to a growing number of attacks on the banking industry. For example, the share of attacks on CHASE Bank, which does not usually exceed 2%, reached 30.6%. Other banks found themselves in a similar situation: in August, the share of attacks on the Bank of America reached 19% compared to the usual 3-5%. Ally Bank also had to fend off more attacks that ever – 11.08% compared to the usual 1-2%. This example demonstrates that though PayPal and eBay are the favorite targets of the phishers, the banks do occasionally surpass them in popularity. For instance, CHASE Bank suffered from a similar mass attack approximately one year ago.
The phishers decided to diversify during the third quarter of 2009, with messages that included a telephone number instead of a link to a fake site. A user was invited to call this number in order to access their account:
Other messages utilized a more traditional spammer trick – a notification informing a user that their account would be blocked in the nearest future. However, the message wasn’t referring to a bank account or an email account, but an account providing the user with access to an online pharmacy. The blocking of this account would allegedly preclude the user from buying medication without a doctor’s prescription. The user was instructed that in order to prevent deactivation of the account, they should immediately place an order with the company.

Needless to say, the recipients of the message did not actually have an account with the pharmacy in the first place. The spammers’ intention was to pique the users’ interest regarding the possibility of buying medication without the need for a doctor’s prescription.
Messages with malicious attachments
In the third quarter of 2009 the number of phishing attacks grew. So did the percentage of messages containing malicious attachments, averaging 0.46% of the total volume of mail traffic – an increase of 0.29% compared to the previous quarter. September proved to be the busiest month for malware attachments and was in itself largely responsible for the higher than usual quarterly figure. During July and August the number of messages containing malware was relatively small at just 0.11% and 0.05% respectively. However, in September this number grew considerably, reaching 1.22%.
In July and August, Email-Worm.Win32.NetSky, Net-Worm.Win32.Mytob and Backdoor.Win32.Bredolab were especially popular with the spammers. Two of these attachments are worms and one is a Trojan program. All three are aimed at harvesting addresses and including unprotected computers into zombie networks. However, in September a Trojan-Downloader from the FraudLoad family took the lead with 48.6% of all messages with malicious attachments being infected with this piece of malware.
The aim of a Trojan-Downloader is to download and install malicious or promotional programs onto the victim’s computer. The purpose of the FraudLoad family is to install rogue antivirus programs on an infected machine.
The majority of malicious messages imitated notifications from legitimate delivery services, usually DHL or UPS, or money transfer systems like Western Union. The message informed the user that the service was unable to deliver a package, or that a money transfer had arrived for them and that the attachment allegedly contained an invoice or a money transfer check number. In fact it contained a malicious program.

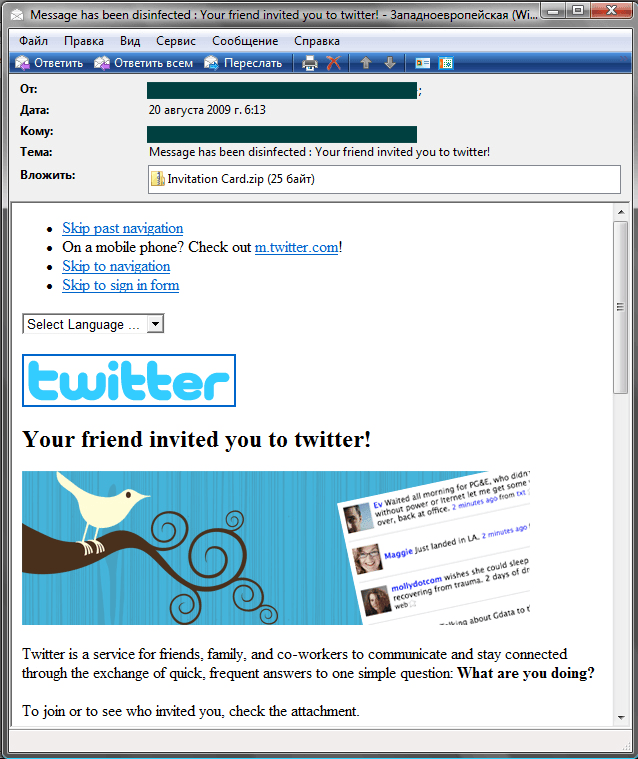
Fraudsters also exploited the popularity of social networking sites. For example, one of the messages imitated an invitation to become a Twitter user:
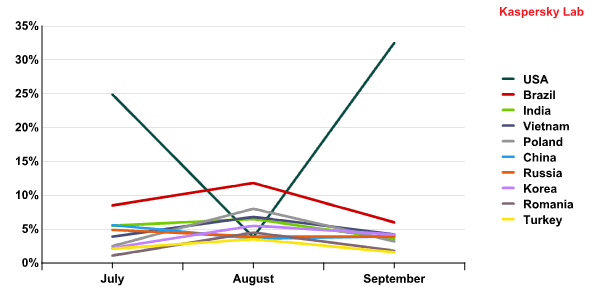
Sources of spam on the Russian Internet

In the third quarter there were no major changes in the league table of countries considered to be key sources of spam: the USA came first, followed by Brazil. The Top 10 also included many Asian and Eastern-European countries. However, the percentage of spam sent from different countries varied. For example, in August the share of spam coming from the US fell considerably, while the percentage of unsolicited messages originating from Poland increased.

Breakdown of spam by email size (KB)
The quantity of very short emails (under 5 KB) declined compared to the first half of the year. In the third quarter it averaged 47.2% of all spam emails, which was 10.7% less than the average figures recorded in the first six months of the year. However, the amount of messages that were 5-10 KB and 10-20 KB in size increased. The share of malicious emails using HTML format grew by 8.2% compared to the average figures for the first half of the year.

Breakdown of spam by format
The total quantity of spam contained less plain text emails and more short messages in HTML format. This means that spammers were concerned about the design of their creations. In addition, HTML format makes it easier for the spammer to conceal the target URL from an inexperienced user.
Spammer methods and tricks
In the third quarter of 2009, spammers reverted to their previous methods of getting around spam filters – HTML tables and graphical spam. Interestingly, addresses and telephone numbers written in the form of a table are easy to read, look more presentable and match the format of the email in size. When this method first appeared, the letters and figures used in the telephone numbers were huge and appeared absurd. Spammers used a variety of colors including black to fill in the cells of HTML tables.
In the email below the inscription “Replica Watches binnew.com” is in fact a multi-cell HTML table with many of the cells colored in.

The developers of graphical spam are continuing to experiment. Previously, the text in the pictures would slope at the sides, whilst in the current images the letters of a single line can be placed at different levels or in the form of a ‘wave’.

In addition, spammers have revived the practice of adding background noise to contact information. For example, in one of the emails random figures were added to the links and a user was asked to delete these superfluous symbols from the address.
Such emails can indeed present problems for some spam filters. However, the adverts distributed in this way are not effective – a user must enter the address in the browser’s address line themselves. It is not enough just to click the hyperlink or copy the address. In some cases a user must delete some of the figures. Only the most committed user will bother to do this.
Spam by category
Q3 also saw a major reshuffle of the spam categories list on the Russian Internet – the spam categories that were declining at the beginning of the year demonstrated notable growth in the third quarter of 2009, even exceeding last year’s figures.

Educational spam, 2008/2009

Travel and Tourism spam, 2008/2009
It is more than likely that the companies offering seminars and training and the small tourist agencies that use spam mailings to advertise themselves were affected by the worldwide economic downturn. Now that the situation is improving, they are becoming more active again.
At the same time, spam advertising the services of the spammers themselves was considerably down in volume, having peaked during the crisis.

Spam advertising the services of spammers, 2008/2009
The decrease in the number of spammers advertising their own services is inversely proportional to the amount of orders for other types of spam mailing. The crisis caused spammers to lose some of their regular clients and so they had to advertise to maintain their business levels. Currently, no such measures are necessary. Thus, the easing of the economic crisis has a direct effect on the distribution of spam categories, with the breakdown of the various spam categories reflecting the post-crisis dynamics of the economic recovery process.
Sonic ‘drugs’
Throughout the year, several mentions have been made of spam emails that use a variety of methods to entice the victim into sending an SMS message to a premium-rate number. The extortionate cost to the sender, of which they are usually unaware, thus becomes a source of income for the spammers or their clients. In order to persuade a user to send an SMS message, spammers use a number of different ploys including falsely notifying a subscriber of the possible blocking of their account, offers of nonexistent services and offers of web design services, etc.
In the third quarter of 2009 spammers introduced a new tactic – in return for sending an SMS message, the victim received some ‘special’ audio files. Listening to these files was supposed to transport the victim into a pleasantly altered state of consciousness.
As soon as information became available disproving the claims made for these ‘sonic drugs’, the levels of spam referring to them immediately decreased. As with many other cases of this type, the fraud was only effective until it was exposed.
Conclusions and forecasts
The quantity of spam in the third quarter of 2009 was in line with predictions – the seasonal summer lull was followed by autumnal growth.
The changes in spam category distribution were entirely logical. As expected, the spam situation reflected what was happening in the economy. The economic recession that started a year ago caused a decline in the quantity of mass mailings advertising goods and services. The current easing of the economic crisis has seen a revival of this type of spam. At the same time, self-promotion by spammers has tailed off to pre-crisis levels, an indicator that they are currently receiving enough orders.
The amount of phishing mail and emails containing malware has grown. Usually, the peak is a result of several individual large-scale attacks. However, users should be careful not to click the links in messages if the addressee is not familiar to them. Users should also take care regarding file attachments. Spammers actively use social engineering methods to make people think that their messages may be from a friendly source. Messages may also originate from compromised accounts.
Recent trends:
- During the third quarter of 2009 the percentage of spam in email traffic averaged 85.7%.
- The percentage of phishing emails increased by 0.5% and averaged 0.99% of the total volume of mail traffic.
- The share of messages containing malicious attachments or links to malicious websites was 0.46% of the total volume of mail traffic (1.22% in September).
- The share of spam categories promoting goods and services is growing, whilst the percentage of self-promotional spam emanating from the spammers is declining.
Spammers continue to use HTML tables and graphics-based spam to bypass filtering.
From the same authors


In the same category


Spam evolution: July-September 2009