

Authors
.tbor {border:solid 1px #000000;padding:5px;width:85%;};
.tbor2 {border:solid 1px #000000;padding:5px;};
.flink {color:blue;text-decoration:underline;};
Quarterly summary
- Spam in mail traffic averaged 86.6%.
- 0.54% of spam messages contained links to phishing sites.
- The amount of graphical spam increased by 6.7% and accounted for 16.3% of all spam.
- The amount of e-advertizing spam tripled, making up 15% of all spam. More than 20% of spam on the Russian Internet comes from Eastern countries.
- Spammers are continuing to use old tricks.
Spam volume
During Q1 2009, spam accounted for 86.8% of all mail traffic which is 5% higher than the average amount of spam in 2008. However, this is not an indicator of an increase in spam in mail traffic. The start of the year is a time when the volume of spam in mail traffic is traditionally high. For example, in Q1 2008, spam averaged 88% of all mail traffic, so the figure for Q1 2009 actually indicates a drop.

Spam volume
The lowest percentage recorded in Q1 was 78.8% on March 2nd, with a high of 93% on February 22nd.
The amount of graphical spam increased considerably and averaged 16.3% compared to 9.6% in Q4 2008.
Sources of spam on the Russian Internet
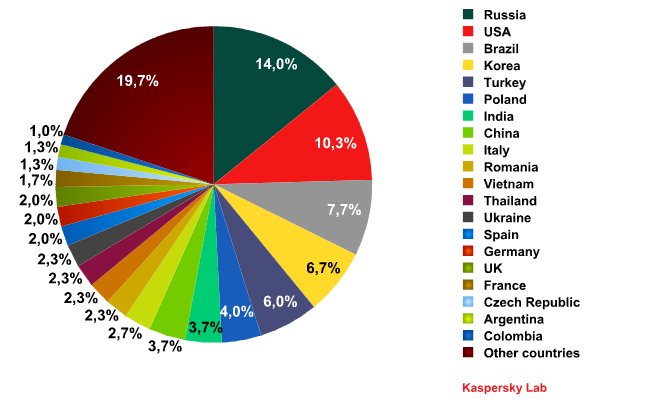
Sources of spam on the Russian internet
Russia (14%) and the USA (10.3%) remain the leading sources of spam, with Brazil (7.7%) in third place. Spain, which occupied third place in 2008, wasn’t even in the top ten countries in Q1 2009.
Interestingly, the amount of spam coming from these leading countries is more evenly distributed than last year. In 2008 about 38% of all spam on the Russian Internet came from Russian and the USA, with other countries sending significantly less spam. In Q1 2009, spam from Russia and the USA accounted for 24.3% of all spam traffic, with the amount of spam coming from other countries being more or less equal. The amount of spam from Eastern countries increased: in 2008, only Korea, China and Turkey (which together contributed 9% of all spam) were among the top ten countries. India joined them in Q1 2009, bringing the total amount of spam sent from these countries to 20.1%.
Spam on the Russian Internet by language

Spam by language
Russian-language spam accounted for 72% of spam on the Russian Internet. The volume of English-language spam increased by 6% in comparison to the figure for the same period in 2008 and averaged 20% of all spam traffic. As in 2008, Portuguese, French and German are among the five languages most commonly used in spam.
Size of spam emails

Size of spam emails
The graph above, which gives a breakdown of spam emails by size, is extremely similar to the same graph for 2008. Spammers still prefer to send smaller emails, but emails larger than 100KB in size still accounted for 6.7% of all spam in Q1 2009.
Format of spam emails
<img src='https://media.kasperskycontenthub.com/wp-content/uploads/sites/43/2009/05/08161724/p-pThe-number-of-plain-text-spam-emails-has-declined-in-comparison-to-last-year.-However-overall-the-picture-has-not-changed-much-ndash-images-are-mostly-in-.gif and .gif format. Interestingly, messages with other types of attachments account for less than 1%.
Phishing
Since the start of 2009, the number of emails containing links to phishing sites has gradually declined. In Q1 2009, this type of spam made up an average of 0.54% of all mail traffic.

Emails containing links to phishing sites
The increasing popularity of e-payments put PayPal at the top of organizations targeted by phishers. However, an attack in January on Fifth Third Bank shows phishers are still actively targeting banking systems, and this attack put the bank in third place in the list of organizations targeted.
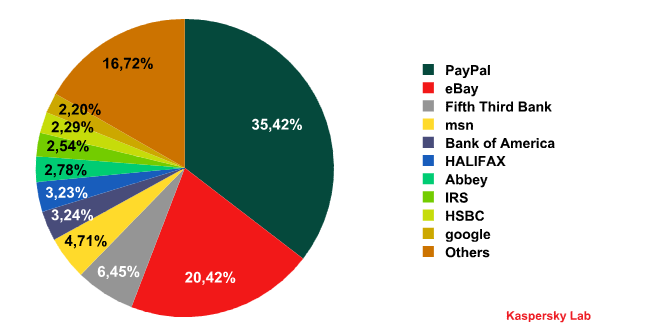
Organizations targeted by phishing attacks
In March, the Rapidshare P2P system unexpectedly entered the top three most popular targets for phishing attacks. Phishers stole users’ accounts in order to sell them in the future.
At the beginning of the year spammers sent several mass mailing purporting to be from a range of banks. The messages said that because of a major phishing attack some financial institutions had been forced to introduce transaction limits. Messages asked recipients to click on a link to view a list of banks which had been attacked and to learn about the measures taken by the U.S Treasury. However, the user was sent to a fake site which asked him/ her to enter his bank login and password. This attack targeted clients from a number of banks and it’s clear that the phishers anticipated a huge haul.
Important:
You’re getting this letter in connection with new directions issued by U.S. Treasury Department. The directions concern U.S. Federal Wire online payments.
On January 21, 2009 a large-scaled phishing attack started and has been still lasting. A great number of banks and credit unions is affected by this attack and quantity of illegal wire transfers has reached an extremely high level.
U.S. Treasury Department, Federal Reserve and Federal Deposit Insurance Corporation (FDIC) in common worked out a complex of immediate actions for the highest possible reduction of fraudulent operations. We regret to inform you that definite restrictions will be applied to all Federal Wire transfers from January 26 till February 6.
Here you can get more detailed information regarding the affected banks and U.S. Treasury Department restrictions:
LINK
Federal Reserve Bank System Administration
Spam by category

Breakdown of spam on the Russian Internet by category
Most common categories of spam in Q1 2009:
- Medications, health-related goods and services – 19% (- 0.6%)
- Adult content spam – 16% (- 4.7%)
- E-advertising services – 15% (+ 10%)
- Education – 10% (+0.2%)
- Fake designer goods – 7% (+ 1.6%)
Spammers trying to find new clients
In Q12009, the volume of spam in the Fake designer goods category tripled in comparison to the previous quarter. This category made up 15% of all spam traffic thus becoming one of the three leading categories. At certain points during the quarter, there was a considerable increase in the amount of spam advertizing spammer services (over 20%) which resulted in e-advertising spam taking the top place.
It seems that many of those who have used spammers’ services have gone bankrupt due to the world economic crisis. Consequently, this has forced spammers to become more proactive in seeking new clients. These clients will probably be companies which haven’t used e-advertizing services in the past, but cuts in advertizing budgets have forced them to reconsider their position.
Spammers offering e-advertising services are now attempting to present their business as legitimate. Whereas previously they attracted clients (e.g. those who were already using such services) by offering low prices, spammers are now offering assurances that spam is legal.
The text of spam emails also reflects increasing competition among spammers: one spam email reads:
“Unfortunately there are a lot of fraudsters in our business. They’ll take money from clients without batting an eye, but won’t do the mass mailing, saying that the text of the message isn’t good. These fraudsters do harm both to you and honest spammers because they damage the reputation of the whole business”
Correlation between spam categories
A comparison of spam classified as Medications, health-related goods and services and spam in the Fake designer goods category shows an interesting correspondence, with highs and lows of spam activity coinciding. This is shown in the graph below:

Medications, health-related goods and services and Fake designer goods spam, Q1 2009
The content of messages in both categories is very similar as they both advertise cheap alternative for expensive goods. As the screenshots below show, the text in messages in both categories is almost identical:
| Medications, health-related goods and services | Fake designer goods |
|---|---|
 |

|
Additionally, it’s clear that in some cases the sites selling the products are located on the same domains:
| Medications, health-related goods and services | Fake designer goods |
|---|---|
| GENERIC ViagraLevitraCializ FROM $1.20/tab
Please order from below links http://.fvsmsseg.cn |
99.99% Genuine look of Original Super Expensive Watches browse all makes & models on our site… http://.fvsmsseg.cn |
The Medications, health-related goods and services and the Fake designer goods categories have been among the most common types of spam for some time now. These types of spam make up almost a third of all spam traffic, indicating that that such mass mailings form part of a profitable business.
It seems likely that a shadow organization is behind this – an organization which has access to its own mailing services, botnets and trading network. Given that Medications, health-related goods and services spam is the most common type of spam worldwide, it seems that this organization is both highly developed and has access to powerful resources.
Spammer techniques and tactics
In Q1 2009 the most popular trick for evading spam filters was adding background “noise” to contact information, especially telephone numbers and ICQ account numbers. In order to do this, spammers intertwined letters and figures, wrote numbers in words and even inserted smilies between the digits of phone numbers. However this trick makes contact information unreadable, which significantly lowers the potential effectiveness of such advertizing.
“I.C.Q” >:-E9Зl:cool:2Зl):-D
Моб 643 ):-p 29 8-o 35 ):-D
ICQ 36:”()86):-D17):-D865
Some emails described phone numbers in words rather than printing them:
“First comes 7, then 2 and 4.
Then dial 7 and after it – zero.
The last two figures are … and …”
Spammers periodically demonstrate an increased interest in adding background noise to emails. However, this usually doesn’t last long; although this method can be used to get spam emails past spam filters, recipients still have to be able to read the messages easily, and additional characters can make spam emails almost illegible.
Finally, spammers continued to exploit a range of vulnerabilities present in major Internet portals. For example, in Q1 2009 they used the Mail.ru banner to redirect those using the email service to a spammer site, which was usually located on a free hosting service such as http://rb.mail.ru/clbkjb/.narod.ru.
Conclusion
The volume of spam in mail traffic during Q1 2009 was relatively high, equaling the amount of spam in circulation prior to the shutdown of МсColo.
Spammers are now far more concerned with the quantity of emails they send out, rather than the quality. They are trying to send as much spam as possible, but paying less attention to the content of the messages and to tricks used to evade spam filters.
While spam made up 86% of all mail traffic, spam advertizing e-advertising services in March accounted for 20%, while in Q1 2008, it made up 3.7%. It seems that the economic crisis has resulted in a decrease of those wishing to use spammer services, which has led to spammers increasing the frequency and volume of advertisements for their own services. Whether this will help them attract new clients, or whether Russian businesses have realized that using spammer services compromises their reputation remains to be seen. Whatever happens, it seems unlikely that the total volume of spam will increase in Q2 2009. In fact, it’s likely that it will drop as the total amount of spam is traditionally higher at the beginning of the year.
From the same authors


In the same category


Spam evolution: January – March 2009