
News overview
In the past quarter, DDoS organizers continued to harness non-standard protocols for amplification attacks. In the wake of WS-Discovery, which we covered in the previous report, cybercriminals turned to Apple Remote Management Service (ARMS), part of the Apple Remote Desktop (ARD) application for remote administration. The first attacks using ARMS were registered back in June 2019, and by early October the protocol was being used by DDoS-as-a-service providers; such attacks have since become widespread. According to the BinaryEdge portal, at the beginning of the quarter, nearly 40,000 systems running macOS with ARMS were available online.
Q4 was also marked by the growing number of peer-to-peer (P2P) botnets. Unlike the classic sort, these are independent of C&C servers, and thus more difficult to neutralize. In Q4 2019, researchers at 360 Netlab told about two new such botnets. The first, nicknamed Roboto, attacks Linux servers through a known vulnerability in the Webmin remote administration application. Experts note that the botnet has yet to carry out a DDoS attack, although it does have the functionality. The second P2P network, Mozi, is aimed at IoT devices and distributed using the DHT protocol, which is applied in distributed networks, such as BitTorrent, to quickly set up a P2P network. Mozi’s authors seemingly borrowed part of the code from the Gafgyt malware, which was designed to create a “classic” botnet.
Gafgyt’s developers also updated their creation. Researchers from Palo Alto Networks detected a new version of the malware that attacks Huawei HG532, Realtek RTL81XX, and Zyxel P660HN-T1A routers. The new version of the bot has even learned to wipe competitors from infected devices.
While some cybercriminals are updating their arsenal, others are using already proven tools and methods. For instance, in October and November 2019, researchers observed a wave of TCP reflection attacks. This method involves sending requests to legitimate services under the guise of the victim, who is then flooded with responses, so the IP addresses of the attackers do not light up. Over the past two years, such attacks have been on the rise. In October, the betting website Eurobet fell victim to cybercriminals, followed by several other sports betting organizations. Later that same month, a flurry of TCP reflection attacks hit financial and telecommunications companies in Turkey. Also named among the targets were Amazon and SoftLayer (a subsidiary of IBM).
Q4 saw attacks on Internet service providers in South Africa continue. In late October, cybercriminals overwhelmed Echo Service Provider — which serves the local providers Afrihost, Axxess, and Webafrica — with junk traffic. Clients of these organizations experienced downtime when connecting to foreign segments of the Internet. The attack reoccurred approximately one month later, and this time the list of victims included the providers RSAWEB and Cool Ideas.
Among the DDoS attacks launched against commercial organizations, worth highlighting is the campaign in October against financial institutions in South Africa, Singapore, and Scandinavia. The attackers sent emails to the victims, threatening to disable their systems and demanding a ransom; and to prove their intent, they carried out a short demonstration DDoS attack. For added effect, they posed as the infamous APT group Fancy Bear, inviting victims to look online for information about their past exploits. When the media reported the attacks, the ransomers renamed themselves Cozy Bear.
Curiously, the media failed to mention a single large-scale DDoS attack timed to coincide with the runup to the festive period. But political incidents did get coverage. For instance, on November 11 and 12, a month before the UK general election, attackers tried to disable the campaign site of the Labour Party.
In December, media outlets in Kyrgyzstan that had reported an investigation into the expenses of the wife of a former official suffered from DDoS attacks. A total of seven organizations were temporarily taken down by the hired hands of the disgruntled party. Another news portal later joined the list of victims, but perhaps for a different reason.
The Minecraft server of the Vatican (that’s right) was bombarded with junk traffic immediately after launch, in what could be described as an ideological attack. The purpose of the server was to create a “less toxic environment” for players, but the project attracted not only peace-loving players. The Vatican is now beefing up its protection. Ubisoft too was engaged in DDoS fire-fighting. The developer adopted a complex of measures to protect the servers of its video game Rainbow Six Siege, which had been on the receiving end of regular attacks. As a result, according to the company, the number of incidents decreased by 93%.
Law enforcement agencies were conspicuous in the struggle against DDoSers. For instance, in early November, Chinese authorities announced the arrest of a group which controlled a botnet of more than 200,000 infected sites. The operation took place in 20 cities; 41 people were detained. In the second half of the same month, the US sentenced Sergey Usatyuk to 13 months’ imprisonment for running DDoS-for-hire services together with an unknown accomplice in Canada. The cybercriminals had been active from 2015 to 2017. In the first 13 months of the operation, the service was used by 386,000 clients and 3.8 million DDoS attacks were carried out.
Quarter and year trends
As we predicted, Q4 saw an increase in the number of attacks relative to the previous reporting period. Although the rise in the total number of incidents was modest, smart attacks grew by a quarter, which is a fair amount. What’s more, not only the number of attacks increased, but their average duration. This was expected, since Q4 is a period of retail warfare, and we observe an increase in attacks from October to December every year.
If we compare the Q4 indicators with those for the same period last year, we see a near doubling in 2019. The end of 2018 was really very calm; we only noticed renewed growth in the attack market after a significant drop, which we wrote about in last year’s report. Back then, we correctly predicted a further rise in the number of attacks. This is clearly seen when comparing full data for 2018 and 2019.
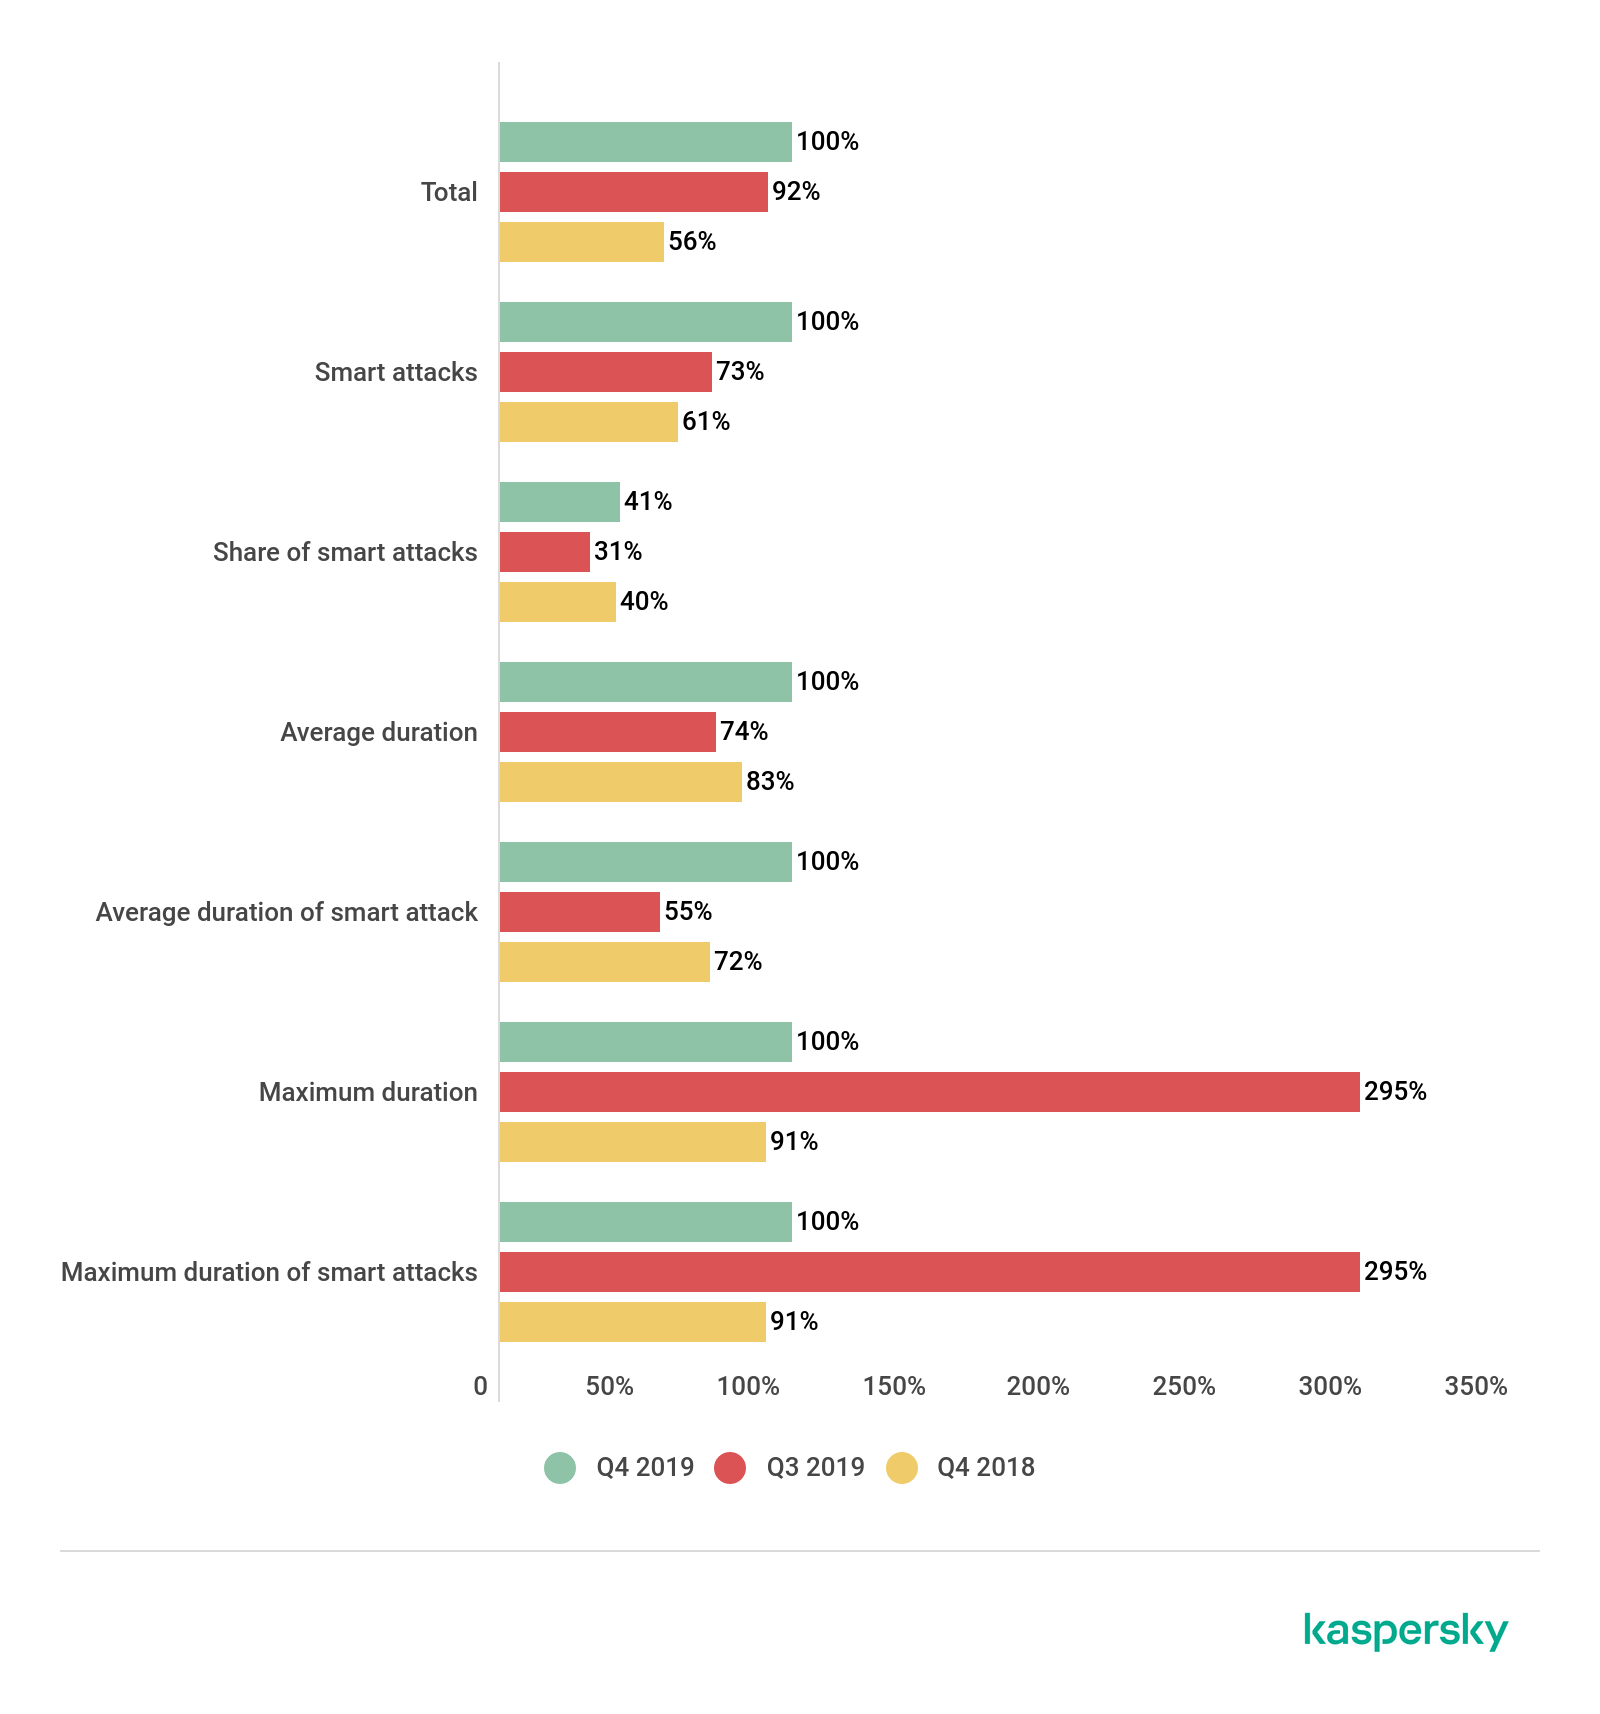
Comparison of the number and duration of DDoS attacks in Q3 and Q4 2019, as well as Q4 2018; the Q4 figures were taken as the 100% reference value
Overall, in 2019 we observed clear growth in all indicators compared to 2018. The total number of smart attacks saw particularly significant growth, as did their average duration. Last year, we forecast a rise in DDoS attacks, but did not expect such a leap.
The maximum duration of attacks also climbed, but not as significantly. In calculating the indicators, we excluded from the statistics an abnormally long attack carried out in Q3 2019, because it was an outlier case that would have unfairly distorted the annual figures.\
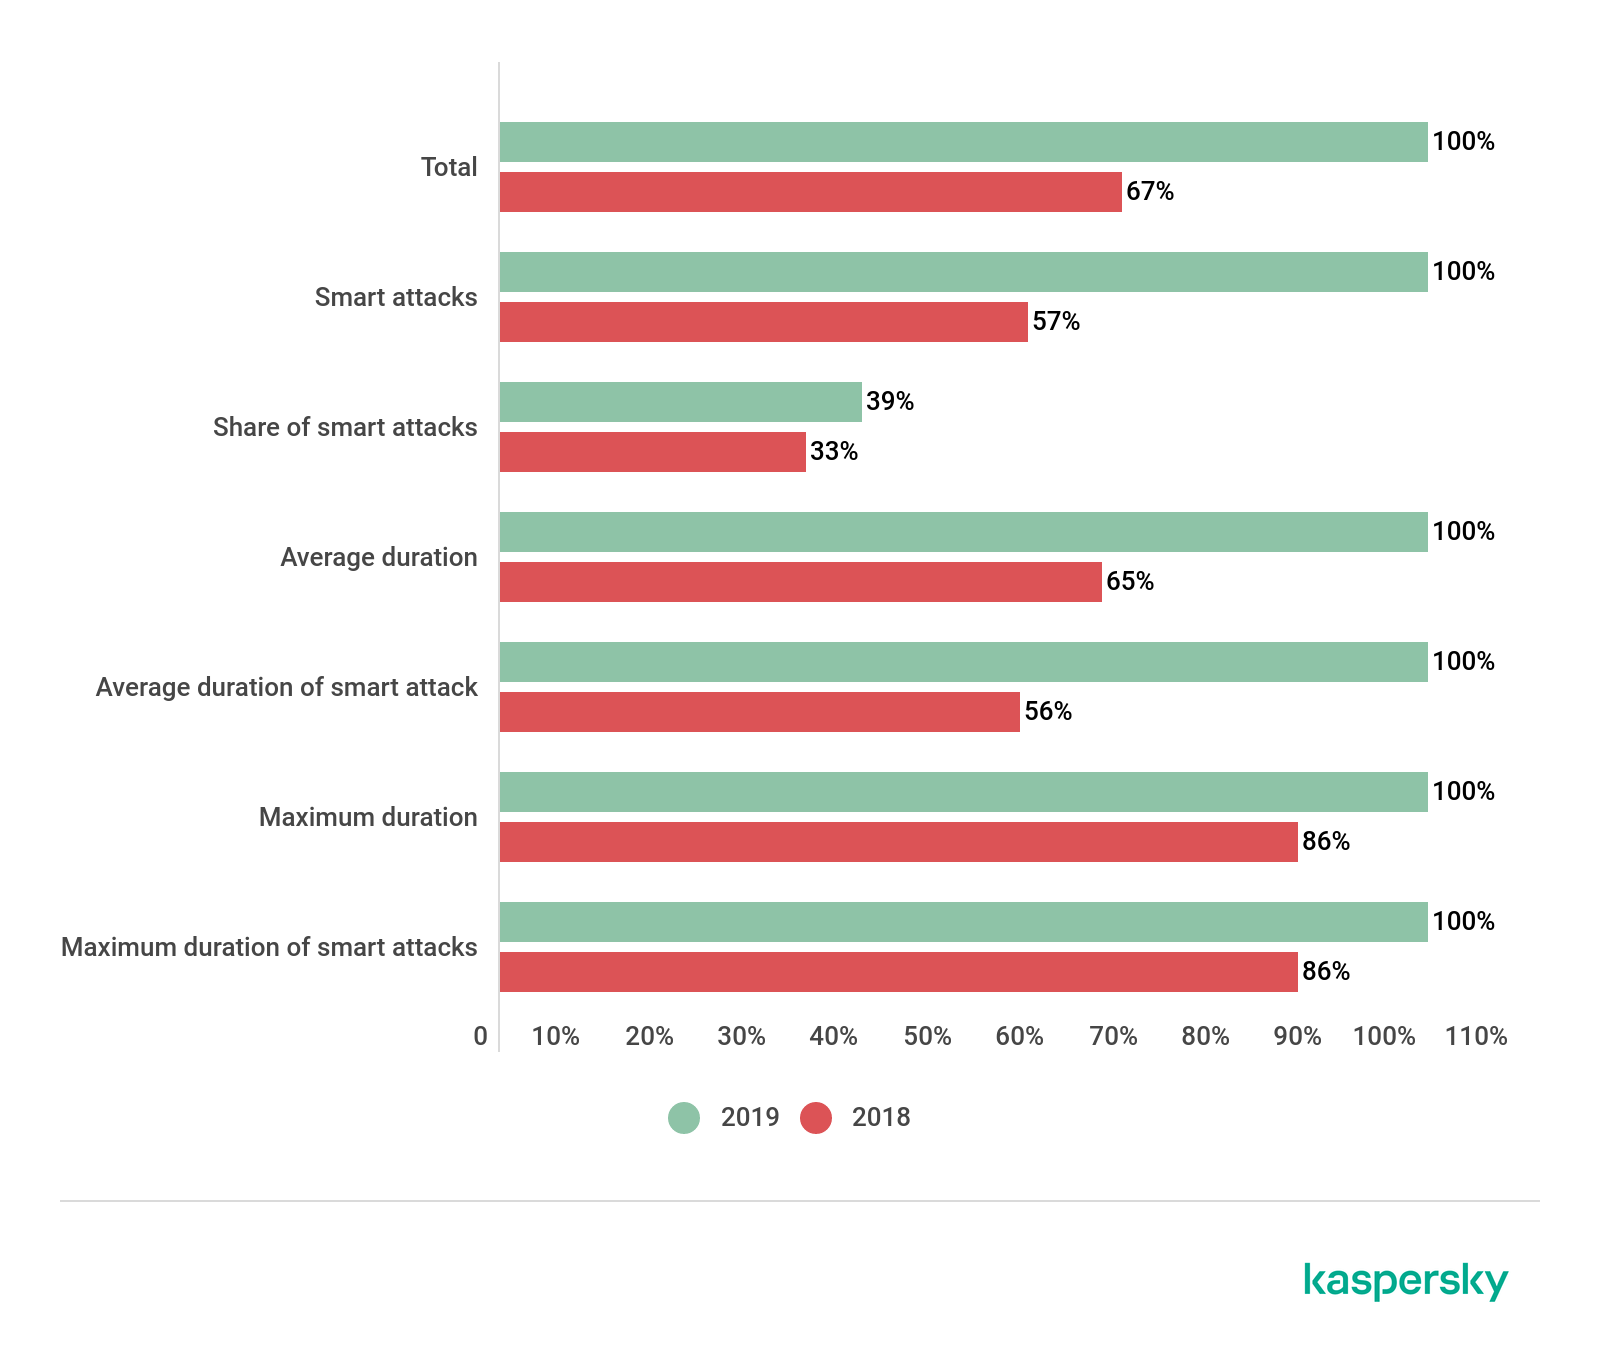
Comparison of the number and duration of DDoS attacks in 2018 and 2019; the 2019 figures are taken as the 100% reference value
Although Q4 saw an increase in the number and duration of DDoS attacks relative to the previous reporting period, we link this to the specifics of the quarter, not to a market trend. Seems like the DDoS market have re-stabilized — we see no prerequisites for either a fall or further growth. There have been no high-profile arrests or closures of specialized websites for quite some time, and the cryptocurrency market is not showing explosive growth. Nor have any serious vulnerabilities that would facilitate attacks been found recently. Looking at the trends of past years, we expect a slight decline in Q1 2020, yet will hazard a prediction that in absolute terms it will still be higher than the same period for 2019. Last year was an interesting one in the world of DDoS attacks. Let’s hope that 2020 decides to be boring.
Statistics
Methodology
Kaspersky Lab has a long history of combating cyber threats, including DDoS attacks of all types and complexity. Company experts monitor botnets using the Kaspersky DDoS Intelligence system.
A part of Kaspersky DDoS Protection, the DDoS Intelligence system intercepts and analyzes commands received by bots from C&C servers. The system is proactive, not reactive, meaning that it does not wait for a user device to get infected or a command to be executed.
This report contains DDoS Intelligence statistics for Q4 2019.
In the context of this report, the incident is counted as a single DDoS-attack only if the interval between botnet activity periods does not exceed 24 hours. For example, if the same web resource was attacked by the same botnet with an interval of 24 hours or more, then this is considered as two attacks. Bot requests originating from different botnets but directed at one resource also count as separate attacks.
The geographical locations of DDoS-attack victims and C&C servers used to send commands are determined by their respective IP addresses. The number of unique targets of DDoS attacks in this report is counted by the number of unique IP addresses in the quarterly statistics.
DDoS Intelligence statistics are limited to botnets detected and analyzed by Kaspersky Lab. Note that botnets are just one of the tools used for DDoS attacks, and that this section does not cover every single DDoS attack that occurred during the review period.
Quarter summary
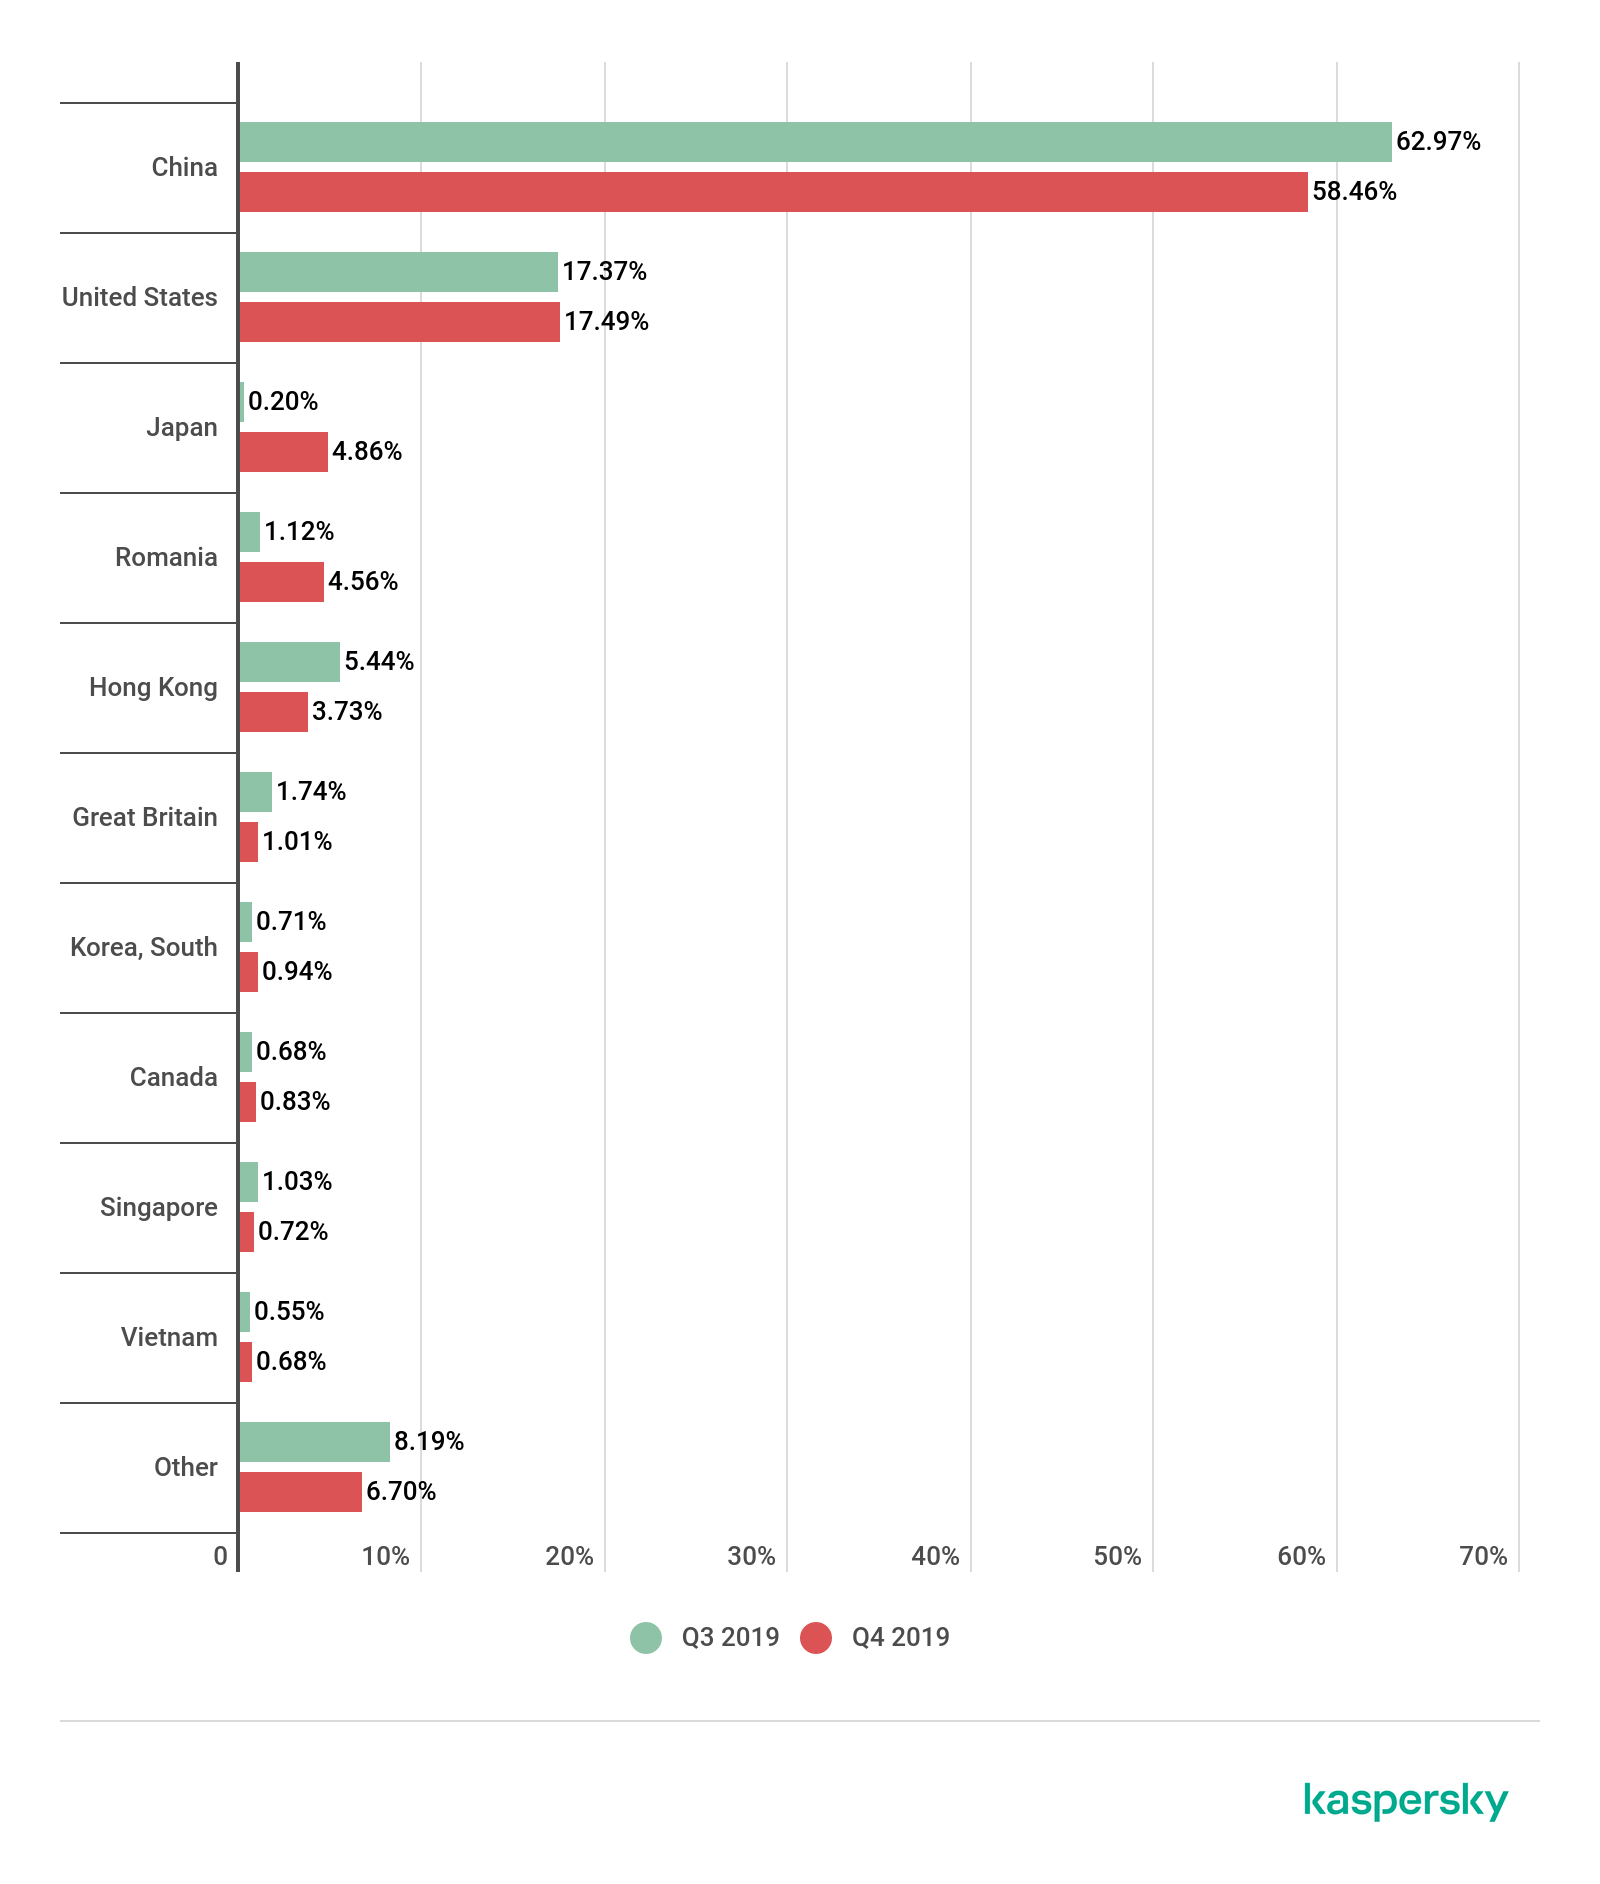
- China again took first place in terms of number of attacks, although its share slightly decreased (58.46% against 62.97% in Q3).
- Two newcomers entered the Top 10: Japan (straight in at number three with 4.86%) and Vietnam (0.68%), while South Africa and the Netherlands dropped out.
- The Top 3 countries by number of targets traditionally coincides with leaders by number of attacks: China (53.07%), the US (22.01%), and Japan (6.14%).
- The past quarter was characterized by a low number of attacks: the most active days saw just over 250 attacks, and the quietest only eight.
- DDoS botnet activity was distributed fairly evenly throughout the quarter itself and on individual days of the week, with the safest and most dangerous days differing by just 2.5 p.p.
- The three longest attacks lasted more than 20 days (494, 492, and 486 hours), which is almost twice as long as last quarter’s leader.
- Among the attack types, SYN flooding (6%) still leads. The share of TCP-based attacks continued to grow and overtook UDP flooding, while ICMP flooding showed a significant increase.
- The ratio of Windows and Linux botnets remained virtually unchanged, with the latter still responsible for the overwhelming majority (97.4%) of attacks.
- The number of C&C servers in absolute terms more than halved. In the US, the absolute number changed slightly less, leading to a sharp increase in the country’s share in the overall picture (58.33% up from 47.55%), while the Netherlands this quarter fell from second position to the foot of the table.
Attack geography
In the past quarter, China held on to the lead in terms of number of attacks, although its share continued to decline (this time by 4.5 p.p. down to 58.46%). The US position did not change either, remaining in second place, with 17.49% of all attacks (almost the same as last quarter’s 17.37%). Third position enjoyed no such stability: Hong Kong, the previous occupier, fell two places to fifth (3.73% against 5.44%), making way for Romania (fourth place with 4.56%, up almost 3.5 p.p.) and Japan, which not only entered the Top 10 for the first time in a year, but shot straight into third place (4.86% against last quarter’s 0.2% and 18th place).
Another newcomer to the ranking is Vietnam. Having narrowly failed to reach the Top 10 in Q3 (11th place), at the end of the year the country experienced a rise of 0.13 p.p. in its share of attacks, enough to cross the threshold. South Africa flew out of the Top 10 almost as swiftly as it had flown in, swapping fourth place for 15th. Slightly less sharp, but also significant, was the drop in the share of attacks on targets in the Netherlands, relegating the country to 14th position.
There were no major changes in the rest of the Top 10, only some shuffling of places. Romania rose from sixth place to fourth with 4.56%; South Korea from eighth to seventh (0.94%), and Canada tenth to eighth (0.83%). The UK (1.01%) and Singapore (0.72%), meanwhile, fell slightly — from fifth to sixth and seventh to ninth, respectively.
The geography of unique targets is traditionally similar to the distribution of the attacks themselves. The Top 3 in both cases is identical. The share of targets in China also fell against Q3, down to 53.07%; the US still accounts for around a fifth of targets (22.01%), while Japan’s share increased 20-fold to 6.14%.
The Top 5 was again rounded out by Romania and Hong Kong, but in reverse order: this time fourth place went to the latter (4.14%), and fifth to the former (1.95%). The UK (1.53%) retains sixth place in both categories. It is followed by Canada (0.93%) and Vietnam (0.84%). Propping up the Top 10 are Australia (0.82%), up from 14th place over the quarter, and Singapore (0.78%). As such, this quarter’s newcomers — Japan, Australia, and Vietnam — squeezed out the leaders by number of unique targets — South Africa, the Netherlands, and France, which occupied 14th, 12th, and 11th places this quarter, respectively.
Dynamics of the number of DDoS attacks
Q4 was even calmer than the preceding quarter. Even on the stormiest days (November 24 and December 11), the number of attacks barely exceeded 250 (recall that last year’s likewise relatively calm Q4 experienced a maximum of 457 attacks per day — almost twice as many). The total number of days that saw more than 200 attacks was also small — besides those already mentioned, October 6 and 7 and November 25 were also quite turbulent. Meanwhile, the quietest day, October 13, set a new record with only eight attacks recorded (the previous record-holder being May 25, 2018, with 13 attacks).
Curiously, this year there were no typical Q4 peaks on Black Friday and over Christmas: both periods were reasonably calm, and the attacks throughout the quarter were distributed fairly evenly.
The attack distribution by day of the week also flattened out considerably: the difference between the calmest and most dangerous day was only about 2.5 p.p. (having approached 7.7 p.p. in the previous reporting period). Attack organizers this quarter were particularly busy on Tuesdays (15.46%), and preferred to put their feet up on Thursdays (12.98%). The former first- and second-placed Monday (down 3.5 p.p.) and Sunday (up nearly 2.5 p.p.) showed the biggest change against the preceding quarter.
Duration and types of DDoS attacks
While the number of attacks fell, their duration rose significantly compared to the previous quarter. As such, the three longest attacks in the three-month period were ongoing for more than 20 days (494, 492, and 486 hours), while in the quarter before not a single one lasted 12 days. Nevertheless, the record for duration remains an attack carried out in Q2 2019 (506 hours, more than 21 days).
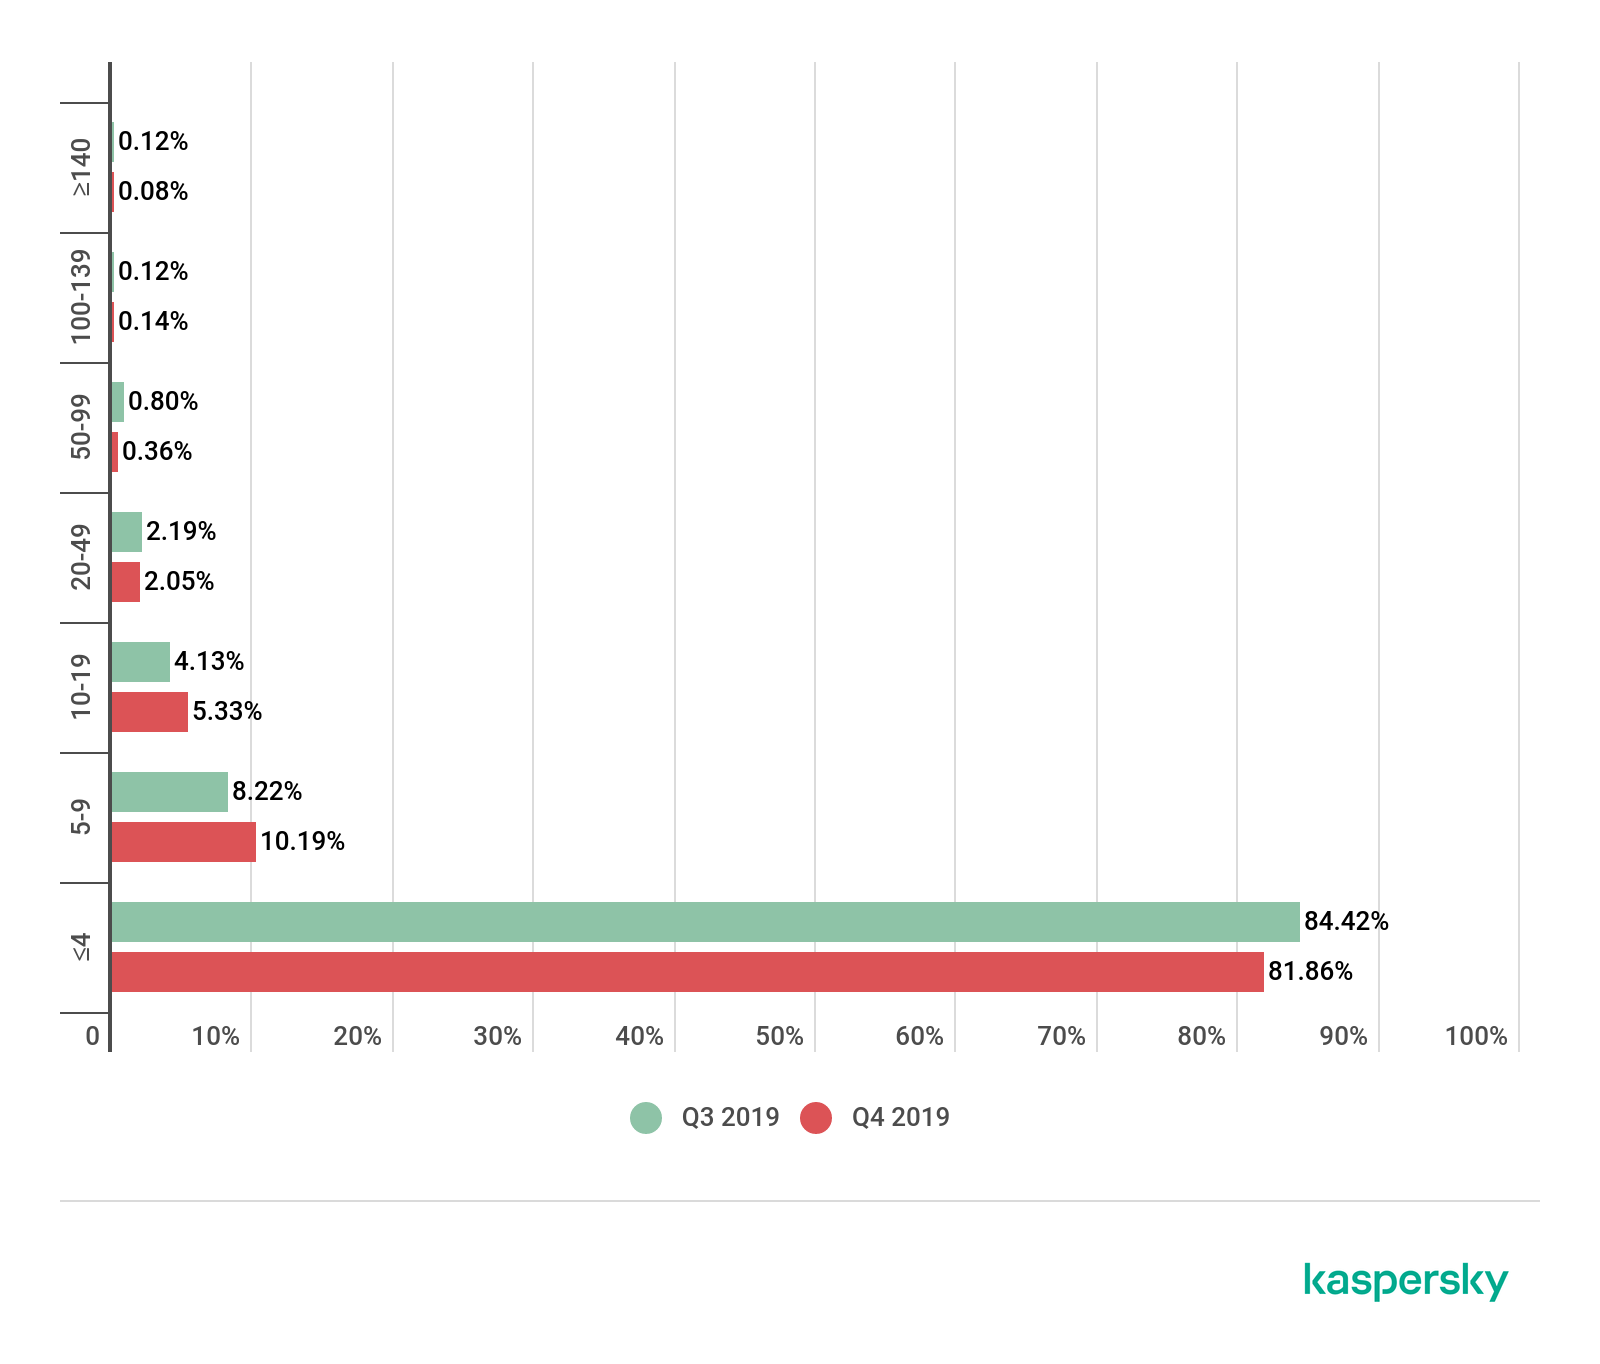
The average attack duration stayed approximately unchanged, while the share of the longest attacks (more than 140 hours) fell by a third to just 0.08%. Meanwhile, the share of the shortest attacks (up to 4 hours) also dropped in relative terms, decreasing by 2.5 p.p. to 81.86%.
But the proportion of attacks lasting 100–139 hours grew slightly (0.14%), as did attacks lasting 10–19 and 5–9 hours (5.33% and 10.19%, respectively). The two middle groups — attacks lasting 20–49 and 50–99 hours — fell insignificantly to 2.05% and 0.36%, respectively.
The share of SYN flooding this quarter amounted to 84.6%, while UDP attacks surrendered second place to TCP, but only by a whisker (5.8% of all attacks against the latter’s 5.9%). The popularity of TCP attacks thus continues to grow (recall that last quarter they moved past HTTP flooding). The bottom two places did not change, although the shares of both types in the total number of attacks increased slightly: HTTP gained 0.5 p.p. (2.2%), while ICMP added 1.1 p.p. (1.6%).
Linux botnets did not partake in the growth trend: this quarter their share marginally decreased to 97.4% (against 97.75% in the previous quarter). Accordingly, the share of Windows botnets grew by the same amount (0.35 p.p.) to 2.6%.
Botnet distribution geography
In Q4 last year, the vast majority of botnets (58.33%) were registered in the US (up from 47.55% in the previous quarter). At the same time, the absolute number of C&C servers in the country almost halved.
The UK (14.29%) moved to runner-up spot, and China retained third (9.52%, roughly 3 p.p. higher than the quarter before). Fourth and fifth places this quarter went to Russia (3.57%) and Iran (2.38%), which climbed from 11th place. The combined share of other countries in the distribution of botnets is below 2%.
The most significant drop in the number of C&C servers was observed in the Netherlands, down from 45 to just one. In Germany and Vietnam, both in last quarter’s Top 10, no active botnets were registered this quarter.
Conclusion
Q4 2019 saw stability in some areas and sharp changes in others. For instance, in the geographical distribution, Japan broke straight into the Top 3, while two of the previous quarter’s newcomers, contrary to the norm, secured a footing in the Top 10. At the same time, the geographical distribution of unique targets traditionally mirrors the distribution of the total number of attacks.
Another notable difference between Q3 and Q4 last year was the number and chronology of attacks. Thus, at the end of the year, the distribution by month, as well as by day of the week, was far more uniform. To the surprise of experts, the traditional peaks on Black Friday and over the Christmas and New Year season did not materialize. The duration of the longest attack almost doubled, coming dangerously close to the record set in Q2 2019.
Tellingly, in the last quarter of the year, the number of both attacks and C&C servers fell sharply, while the number of extra-long attacks (over 400 hours) was the highest ever recorded in the history of our observations. This is perhaps evidence of an upward trend in the number of complex and meticulously planned attacks, albeit at the expense of the total number of attacks.



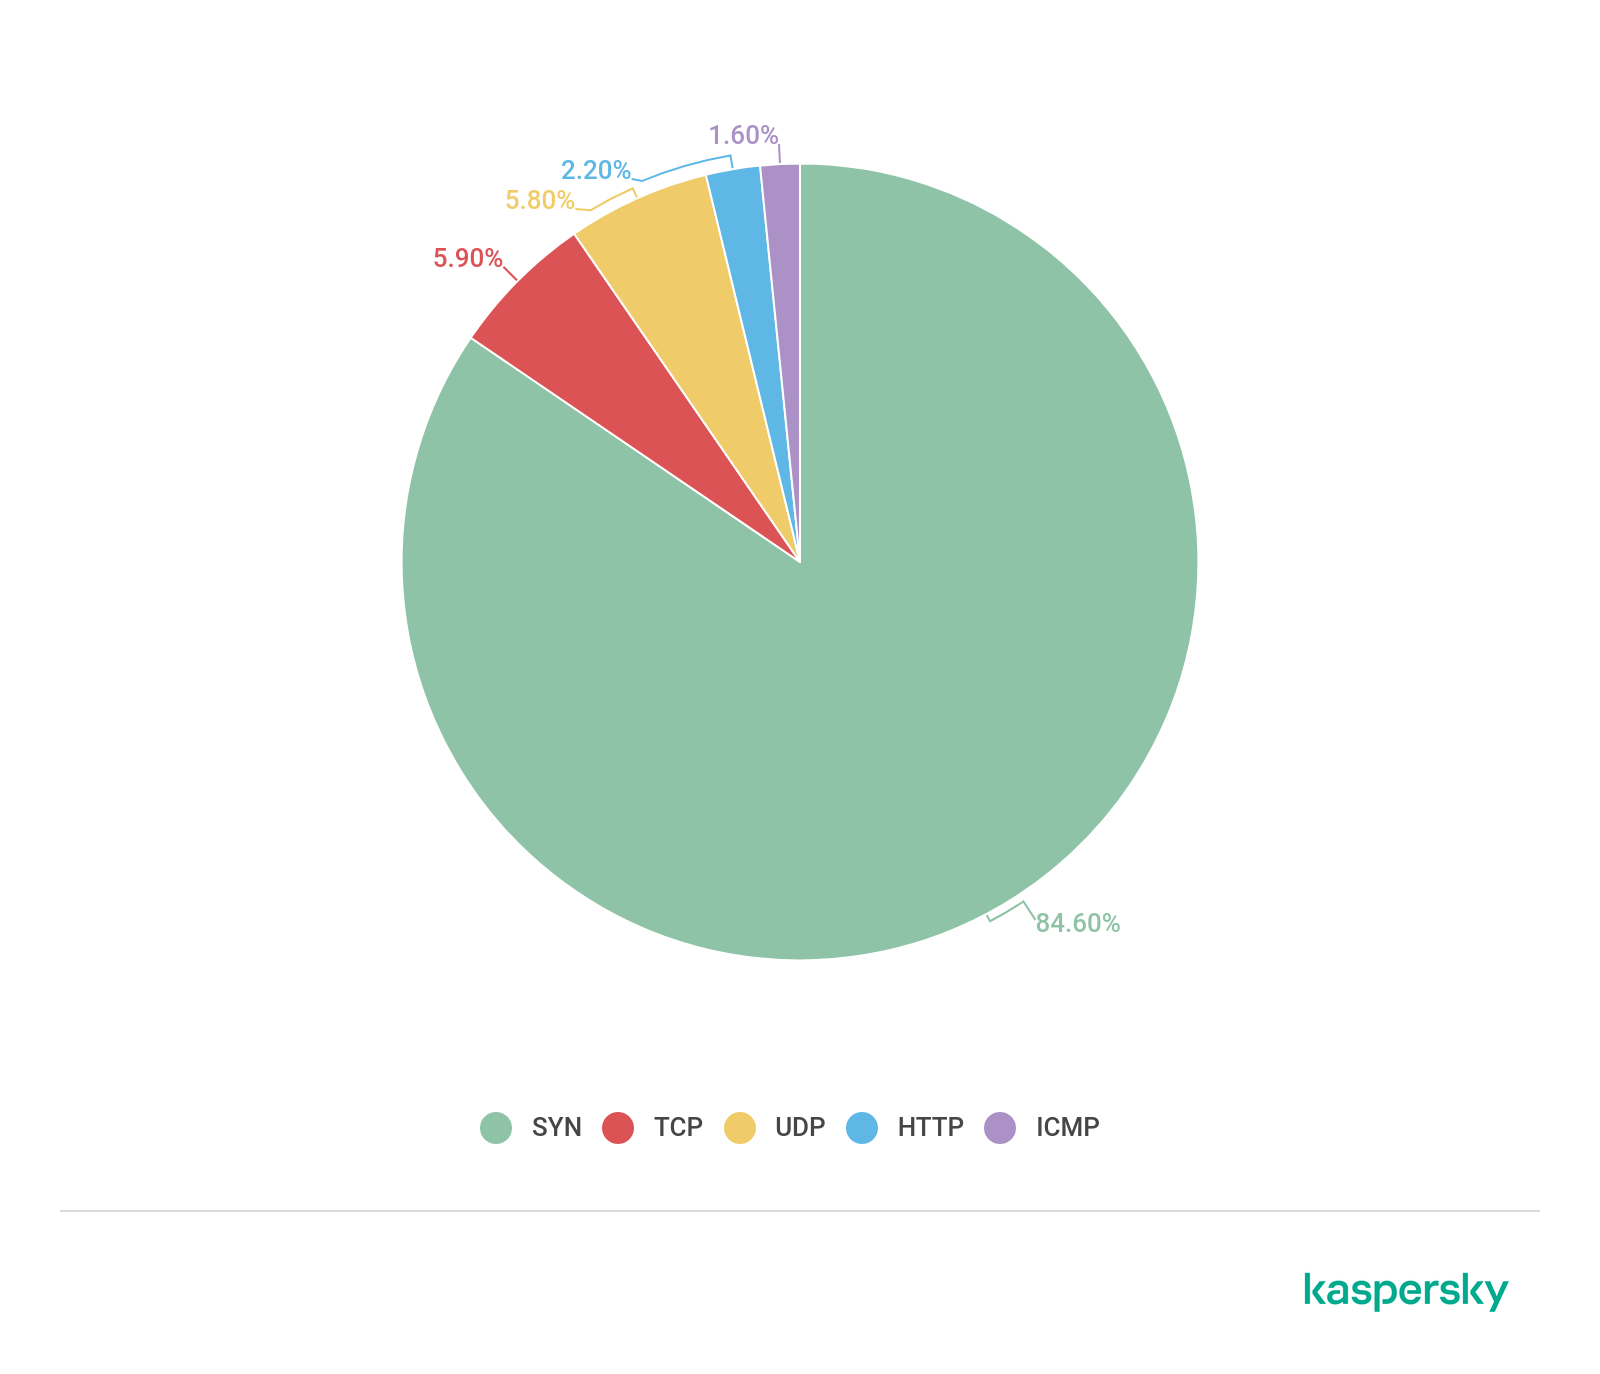





DDoS attacks in Q4 2019