

News overview
This past quarter we observed a new DDoS attack that confirmed our earlier hypothesis regarding attacks through the Memcached protocol. As we surmised, the attackers attempted to use another, rather exotic protocol to amplify DDoS attacks. Experts at Akamai Technologies recently registered an attack on one of their clients that was carried out by spoofing the return IP address through the WS-Discovery multicast protocol. According to other security researchers, cybercriminals started using this method only recently, but have already achieved an attack capacity of up to 350 Gbps. The WSD protocol has limited scope and is not generally intended for connecting machines to the Internet; rather devices use it to automatically discover each other on LANs. However, it is fairly common for WSD to be used not entirely for its intended purpose in a variety of equipment — from IP cameras to network printers (about 630,000 such devices are currently hooked up to the Internet). Given the recent rise in the number of WSD-based attacks, owners of such devices are advised to block on the server UDP port 3702, which is used by this protocol, and to take a number of additional steps to protect their routers.
Another new tool in the hands of DDoSers was detected by our colleagues at Trend Micro in the shape of a new payload distributed through a backdoor in the data search and analytics tool Elasticsearch. The malware is dangerous because it employs a multi-stage approach to infection, successfully avoids detection, and can be used to create botnets for launching large-scale DDoS attacks. Trend Micro recommends all Elasticsearch users to upgrade to the latest version, since the backdoor has already been patched.
That said, cybercriminals are far more likely to turn to proven techniques than to try out new ones. For instance, when last year the FBI took down a number of inexpensive DDoS-for-hire sites, new ones immediately sprang up in their place, and today the threat is more acute than ever. According to some reports, the number of attacks carried out with their assistance increased by 400% against the previous quarter.
It is highly likely that the attack on World of Warcraft Classic, launched in early September in several waves was organized through such a service. Before each episode, a certain Twitter user warned of the impending attack. Blizzard later announced the arrest of the mastermind, although whether it was the owner of the corresponding Twitter account remains unclear. But if so, it is hard to escape the conclusion that, far from being a member of a spin-off hacker group, it was a client of a DDoS-for-hire service.
Using another tried-and-tested method (a botnet similar to Mirai — or one of its clones), a 13-day application-level attack was unleashed in July against a streaming service with a capacity of up to 292,000 requests per second. The attack involved about 400,000 devices, mainly home routers.
But whereas the motives behind these two attacks can only be guessed at, two other attacks that took place this summer and fall were almost certainly politically driven. Thus, August 31 saw the targeting of LIHKG Forum, one of the main websites used by protesters in Hong Kong to coordinate their actions. According to the site owners, it was hit by 1.5 billion requests in 16 hours, taking it temporarily offline and causing the mobile app to malfunction.
Soon after that, an attack was conducted on Wikipedia. It began on the evening of September 6 and made the world’s largest online encyclopedia temporarily unavailable to users in various countries of Europe, Africa, and the Middle East. Wikipedia gets hit quite often, but this attack was exceptional in terms of capacity (exact figures are not available, but unofficial sources say more than 1 Tbps) and duration (three days).
The attack organizers remain at large, but several other investigations over the past quarter did reach their logical conclusion. For instance, in early July a US federal court sentenced a certain Austin Thompson of Utah to 27 months in prison and a fine of $95,000 for an attack on Daybreak Game Company (formerly Sony Online Entertainment). And on September 6 another cybercriminal, Kenneth Currin Schuchman of Washington State, admitted his involvement in setting up the Satori IoT botnet.
On the topic of law enforcement efforts, mention must be made of one other piece of news that highlights the importance of prevention in the fight against DDoS attacks. For several quarters now, the section on global botnet activity in our report has featured countries that just a couple of years ago were unlikely contenders to make the ratings. Moreover, the shares of other countries previously beloved of cybercriminals have been falling. This trend was also noted by TechNode, backed up by data from Nexusguard and the World Bank. Our colleagues pinpoint two factors to explain the situation. First, countries once collectively referred to as the Third World have seen rising living standards. More and more residents there are acquiring smartphones and broadband routers — that is, devices that most botnets are made from. Second, in regions where cybercriminals have been plying their trade for a long time, cybersecurity awareness is on the up, and more effective measures are being taken to protect devices, including at the provider level, which means that attackers are having to search for pastures new. This is what is changing the face of our lists of regions by number of cyberattacks.
Quarter trends
Q3 typically sees a lull in DDoS activity over the summer months, followed by a September spike associated with the start of the academic year. This year was no exception.
According to data from Kaspersky DDoS Protection, the number of smart attacks (that is, ones more technically sophisticated and requiring more ingenuity) declined significantly in Q3 against the previous quarter. However, comparing this indicator with the same period last year, we see more than double growth. The prediction made in previous reports is clearly coming true: the DDoS market is stabilizing for smart attacks too. With this in mind, it will be extremely interesting to see the Q4 results.
This stabilization of the market, where growth has been observed throughout the year, is also evidenced by the fact that the average duration of smart attacks is practically unchanged since Q2, yet almost double against Q3 2018. At the same time, the average duration of all attacks fell slightly due to the overall increase in the number of short-lived DDoS sessions.
The giant leap in the maximum duration of attacks on the graph comes from one very long smart attack that we observed this quarter. That this is just a curious anomaly is clearly visible from the medium-length columns.
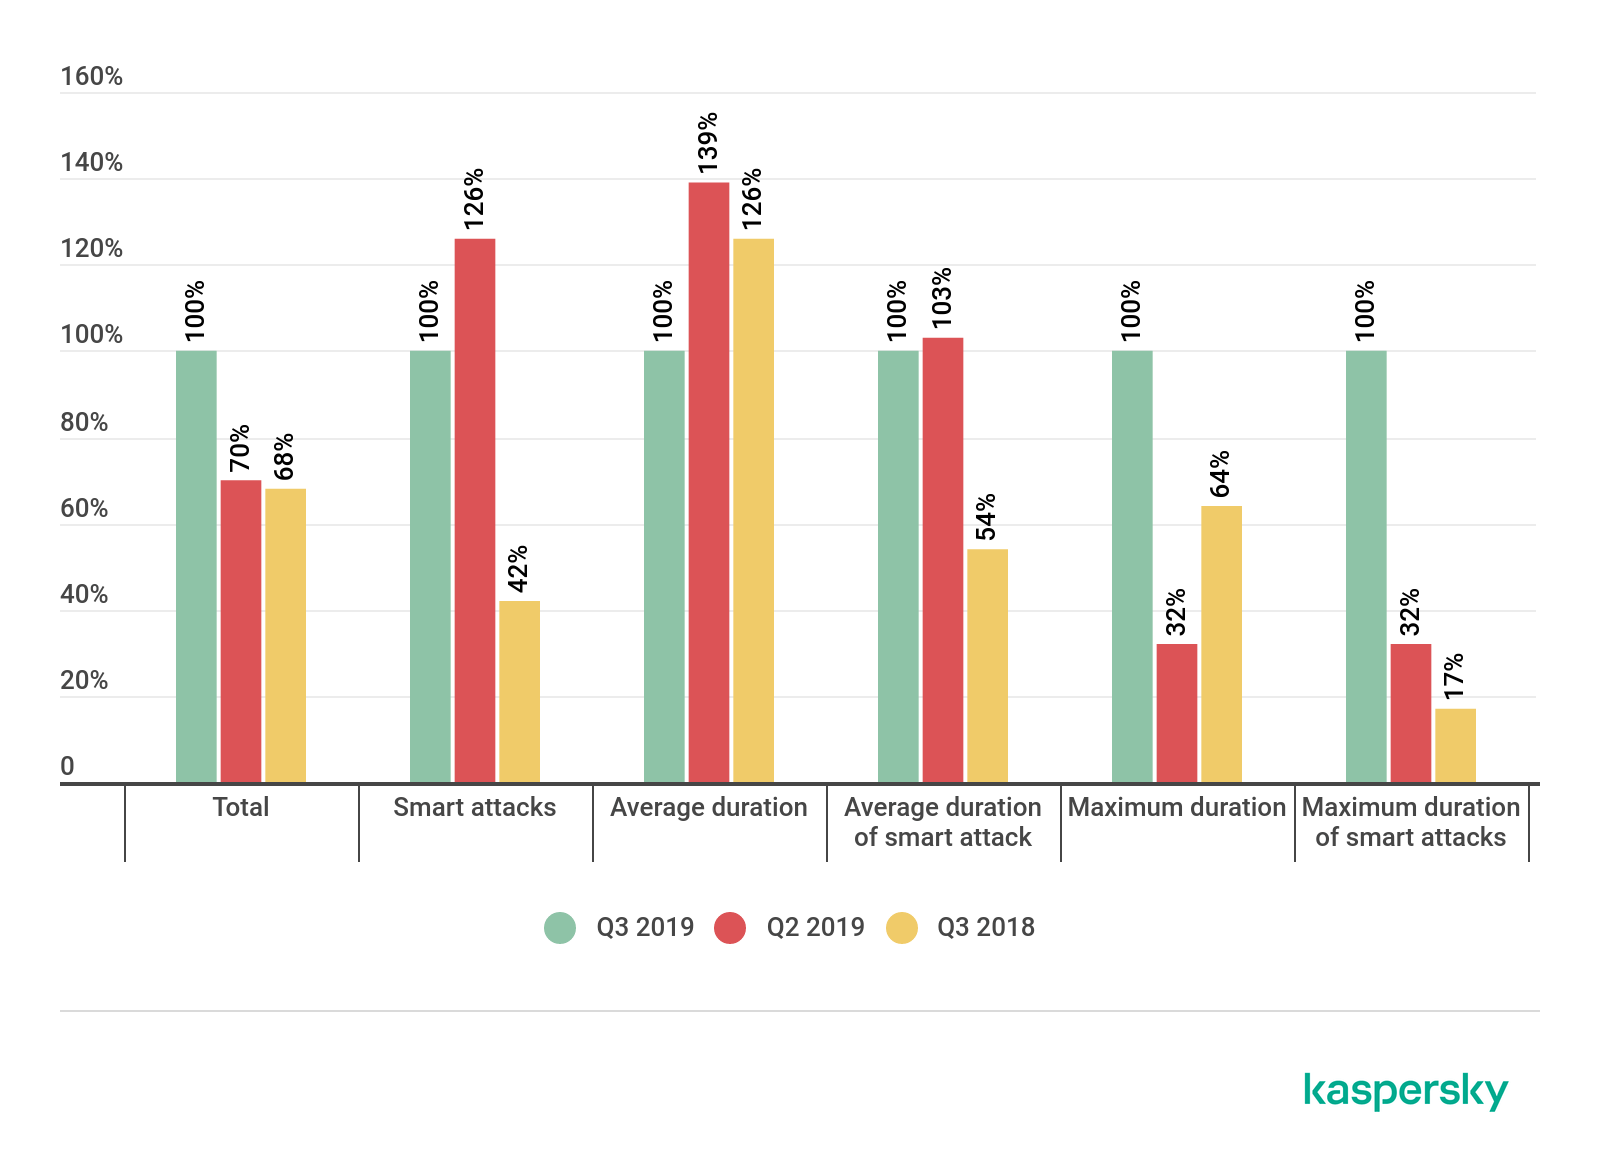
Changes in the number and statistical distribution of DDoS attacks in Q3 2019 compared to Q2 2019 and Q3 2018 (download)
The change in the share of smart DDoS attacks in the general stream of cyber offensives is worth a separate mention.

Changes in the share of smart DDoS attacks in Q3 2019 compared to Q2 2019 and Q3 2018 (download)
The ratio of smart attacks to the total number of offensives almost halved against the previous quarter but increased by 7 p.p. compared to Q3 2018; the decline in the share of smart attacks against the end of H1 is due to the quirks of September’s statistics.
Like last year, the arrival of September went hand in hand with a significant rise in the number of DDoS attacks. Moreover, this month accounted for 53% of all Q3 attacks, and it was only because of September that any growth in general was observed.
What’s more, 60% of DDoS activity in the early fall was directed at education-related resources: electronic grade books, university websites, and the like. Against the backdrop of such attacks, most of which are short and poorly organized, the share of smart attacks in Q3 sank by 22 p.p.
We observed a similar picture last year, since it is due to students returning to school and university. Most of these attacks are acts of cyber hooliganism carried out by amateurs, most likely with no expectation of financial gain.
Note that the total number of attacks in September 2019 versus September 2018 increased by 35 p.p., while the total number of attacks in Q3 2019 compared to Q3 2018 climbed by 32 p.p. That is, these figures are roughly the same, while the difference in the growth indicators for the number of smart attacks is far greater: whereas the total number of smart attacks increased by 58 p.p., the number of smart attacks in September rose by only 27 p.p., and the month’s share of smart attacks even declined by 3 p.p. This confirms once again the extent to which September skews the overall statistical picture.
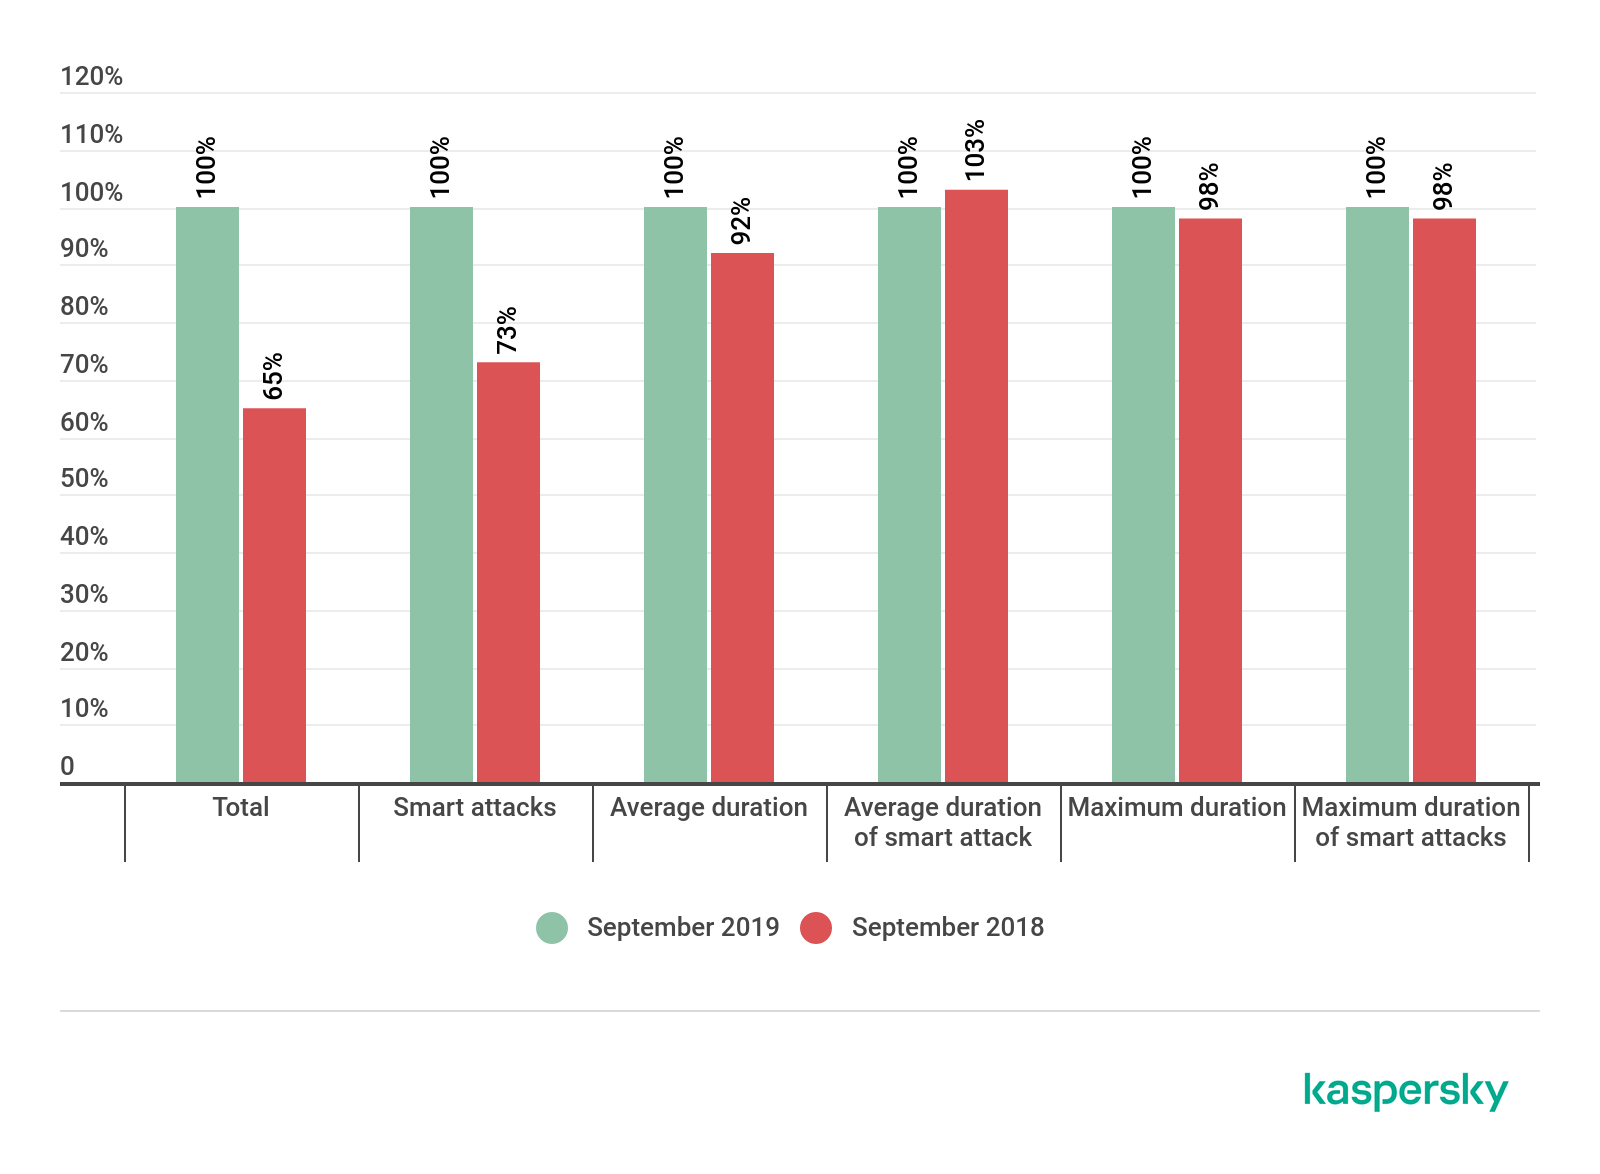
Changes in the number and statistical distribution of DDoS attacks in September 2019 compared to September 2018 (download)

Changes in the share of smart DDoS attacks in September 2019 compared to September 2018 (download)
As such, in Q3 2019, for the first time in the past year, not only did we not observe a clear rise in the number of smart attacks, we saw their total number fall. It is quite possible that last quarter’s positive forecast — that the DDoS market would become saturated and stop growing — came true.
However, based on the experience of past years, in Q4 we expect to see growth in all key indicators (total number of attacks and smart attacks; duration of attacks), since the end of the year is a holiday season, which means more commercial and thus criminal activity. Yet if the conclusions about market stabilization are correct, this growth will not be that considerable.
That the indicators will drop or even remain at the Q3 level seems unlikely to us — in any case, the prerequisites for such a turnout of events are not yet visible.
The barrage of attacks on the education sector will subside by winter, but it will be left completely in peace only in summer when school’s out.
Methodology
Kaspersky Lab has a long history of combating cyber threats, including DDoS attacks of all types and complexity. Company experts monitor botnets using the Kaspersky DDoS Intelligence system.
The DDoS Intelligence system — part of the Kaspersky DDoS Protection solution — intercepts and analyzes commands sent to bots from C&C servers. The system is proactive, not reactive, meaning that it does not wait for a user device to get infected or a command to be executed.
This report contains DDoS Intelligence statistics for Q3 2019.
In the context of this report, the incident is counted as a single DDoS-attack only if the interval between botnet activity periods does not exceed 24 hours. For example, if the same web resource was attacked by the same botnet with an interval of 24 hours or more, then this is considered as two attacks. Bot requests originating from different botnets but directed at one resource also count as separate attacks.
The geographical locations of DDoS-attack victims and C&C servers used to send commands are determined by their respective IP addresses. The number of unique targets of DDoS attacks in this report is counted by the number of unique IP addresses in the quarterly statistics.
DDoS Intelligence statistics are limited to botnets detected and analyzed by Kaspersky Lab. Note that botnets are just one of the tools used for DDoS attacks, and that this section does not cover every single DDoS attack that occurred during the review period.
Quarter summary
- China remains top by number of attacks, with a practically unchanged share compared to Q2 (62.97% against 63.80%).
- The unexpected guest in the Top 10 ranking by territorial distribution of attacks was South Africa, which took fourth place (2.40%), having never previously appeared in our leaderboard.
- The Top 10 in terms of territorial distribution by number of targets is similar to the Top 10 by number of attacks: the Top 3 were again China (57.20%), the US (22.16%), and Hong Kong (4.29%).
- In the past quarter, peak DDOS botnet activity was observed in July; the most dangerous day was Monday (17.53% of attacks), and the quietest was Sunday (10.69%).
- The longest attack lasted more than 11 days (279 hours), which is almost half as short as in Q2.
- The most common type of attack is still SYN flooding (79.7%), with UDP flooding in second place (9.4%). The least popular is ICMP flooding (0.5%).
- The shares of Windows and Linux botnets are almost unchanged against Q2; Linux botnets still account for the vast majority (97.75%) of activity.
- The leader by number of botnet C&C servers is once more the US (47.55%), followed by the Netherlands in second (22.06%) and China in third (6.37%).
Attack geography
As in previous quarters, the leader by number of attacks is still China, whose share fell by 0.83 p.p. to 62.97%. Likewise, the US remains in second place: its share slightly decreased to 17.37% (against last quarter’s 17.57%). Hong Kong firmly established itself in the bronze position. In contrast to China and the US, its share grew, albeit only by 0.83 p.p. to 5.44%.
The trend seen in past quarters continued, with an interloper rising from the lower ranks into the Top 10. This time it is was South Africa (2.4%), soaring up from 19th position last quarter. It seized fourth place from the Netherlands (0.69%), which dropped down to ninth. What’s more, the Top 10 welcomed back South Korea after a long absence — but not in the Top 3 as before, rather in eighth place with just 0.71%.
Also worth noting is Romania, which gained 0.93 p.p. and rejoined the Top 10 in sixth position with 1.12%. Romania, South Africa, and South Korea collectively squeezed out Taiwan, Australia, and Vietnam.

>Distribution of DDoS attacks by country, Q2 and Q3 2019 (download)
The geographical distribution of unique targets this quarter has a lot in common with the distribution of number of attacks — which is fairly typical for statistics of this kind. The Top 3 here also belongs to China (57.20%), the US (22.16%), and Hong Kong (4.29%), with shares close to those in the rating by number of attacks. But there are variances in both Top 10s below. These are partly due to the small share of each individual country (except for the Top 3), which means that even minor fluctuations cause major reshuffles.
For instance, South Africa (1.83%) entered the Top 10 by number of unique targets, though not in fourth place, but fifth, giving way to the UK (2.71%). In the list of leaders by number of attacks, the situation is the opposite: the UK is fifth behind South Africa. Romania also made it back into the rating with a share of 0.71%, while South Korea was pushed overboard. This quarter’s rating also had no place for Taiwan and Ireland.
France remained in last place, its share falling by 0.23 p.p. against the previous quarter to 0.67%.

Distribution of unique DDoS-attack targets by country, Q3 and Q4 2019 (download)
Dynamics of the number of DDoS attacks
Q3 was relatively calm, with clear peaks and troughs being observed only in July. The most eventful day of this month was the 22nd, with 457 attacks. We also registered a high number of attacks (369) on July 8. The calmest day was August 11 (65 attacks).
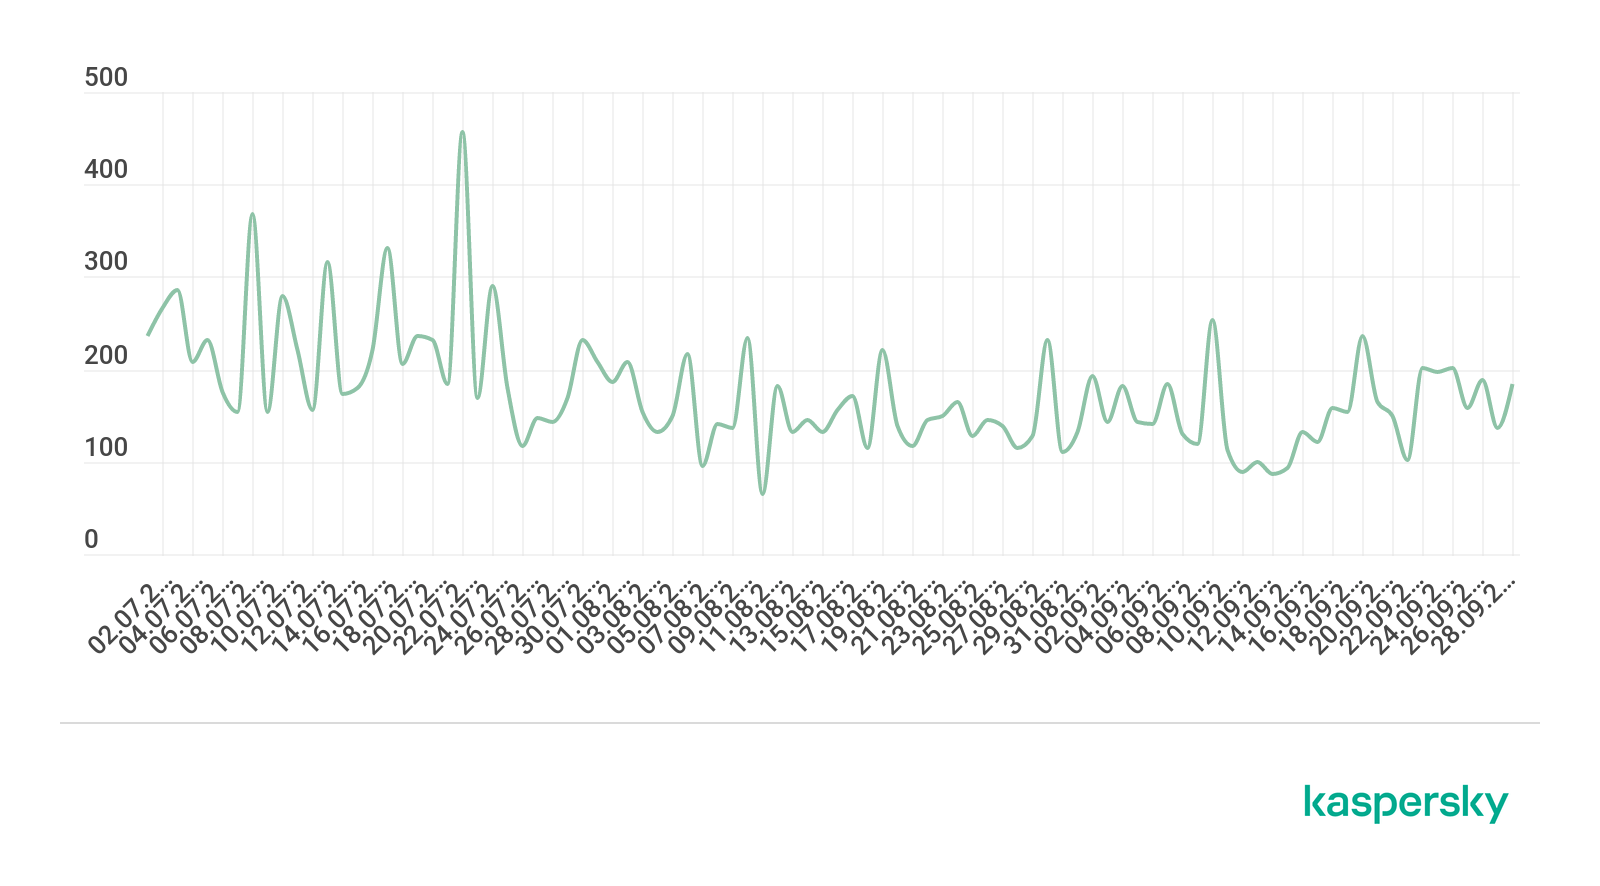
Dynamics of the number of DDoS attacks in Q3 2019 (download)
The Q3 distribution of the number of attacks by day of the week was similar to Q2. The safest day in DDoS terms was Sunday (10.69% of attacks), although its share was slightly up from last quarter. As previously, the statistical majority of DDoS attacks occurred on Mondays (17.53%). The only significant difference from last quarter is that the second quietest day (after Sunday) from July to September was not Friday, but Thursday (13.16%).

>Distribution of DDoS attacks by day of the week, Q2 and Q3 2019 (download)
Duration and types of DDoS attacks
The longest attack this past quarter (traditionally against a Chinese ISP) lasted 11.6 days (279 hours), which is 1.8 times shorter than in Q2 (509 hours). In fairness, however, it should be noted that the longest attack of Q2 is the all-time record holder since our observations began.
Meanwhile, no global changes were seen in the summary statistics: the share of attacks lasting 140+ hours dropped by 0.01 p.p. to 0.12%. Conversely, the share of 20–139-hour attacks increased slightly, while the share of 5–9-hour attacks fell by 1.5 p.p.; the total share of the shortest attacks (lasting no more than four hours) rose just under 2 p.p. to 84.42%.

Distribution of DDoS attacks by duration (hours), Q2 and Q3 2019 (download)
The leading attack type remains SYN flooding. Its share changed inappreciably, down from 84% to 79.7%. Second place again went to UDP attacks (9.4%), while HTTP- and TCP-based attacks swapped places: whereas before HTTP flooding ranked third by frequency, it now lies in fourth place with a share of 1.7%, while the share of TCP flooding climbed to 8.7%, more than doubling against the previous quarter (3.1%). As before, ICMP flooding was in last place in Q3.

Distribution of DDoS attacks by type, Q3 2019 (download)
The share of Linux botnets continues to grow: Q3’s figure was 97.75%, while the share of Windows botnets, respectively, sank by 1.75 p.p. to 2.25%. This is not due to the growth in activity of Linux botnets, but to the decline in activity of Windows-oriented zombie networks.

Ratio of Windows/Linux botnet attacks, Q2 and Q3 2019 (download)
Botnet distribution geography
As in Q2, the US tops the leaderboard by number of C&C servers located in the country, its share increasing from 44.14% to 47.55%. In second place is the Netherlands: its share also rose — from 12.16% to 22.06%. Such solid growth could not fail to have a major impact on most of the other top-tenners. China, for instance, whose share increased by only 1.42 p.p. to 6.37%, rose from fifth to third place, pushing the UK into fourth (4.90%).
Russia also climbed up the rating into fifth position with a share of 3.92%, while Greece and South Korea slipped out. The newcomer in the Top 10, in bottom place on 1.47%, was Romania, which this quarter also appeared in the leaderboards by number of DDOS attacks and their targets.
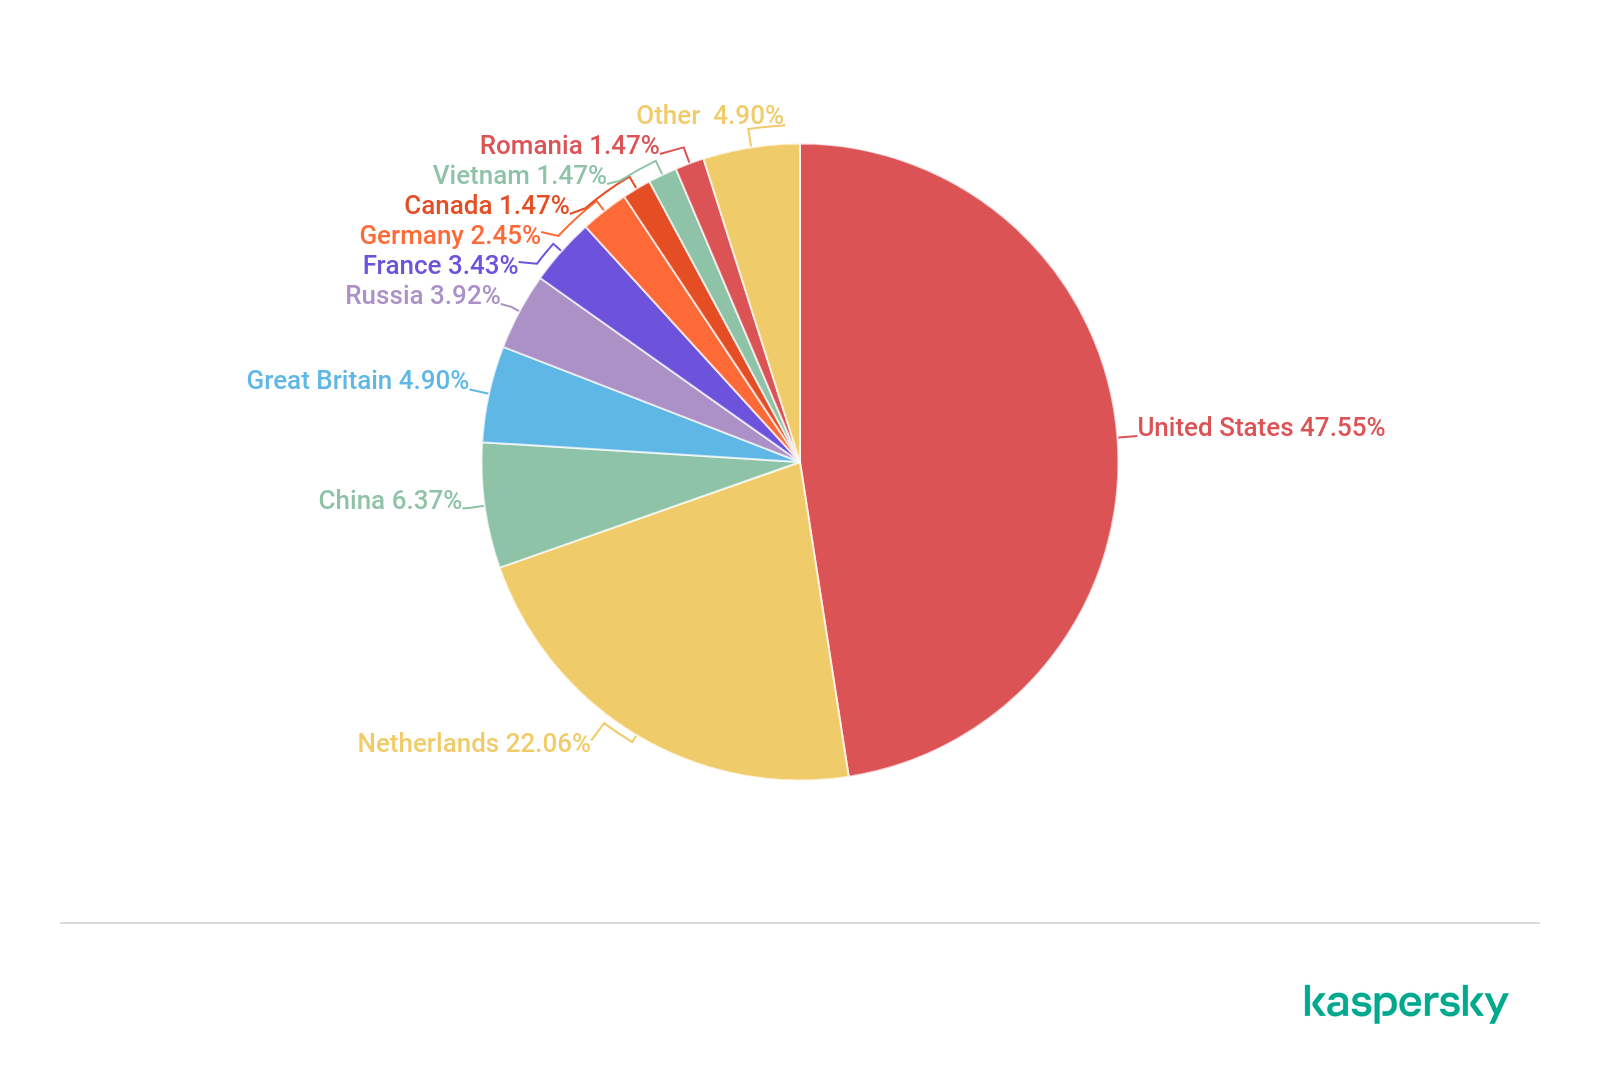
Distribution of botnet C&C servers by country, Q3 2019 (download)
Conclusion
Statistically, Q3 2019 differs little from Q2. In terms of geographical distribution of attacks and targets, we saw a continuation of the now familiar trend of unexpected guests appearing, only to drop out the next quarter.
As for the chronological distribution of attacks, Q3 was again similar to Q2: turbulence was observed at the beginning of the quarter, with a lull in the middle and small peaks and troughs at the end. The characteristic distribution of attacks by day of the week also remained practically unchanged. The duration of the longest attack fell compared to the previous quarter, but the difference in the percentage shares of long and short attacks is barely noticeable.
All this could indicate either that the DDOS-attack market has temporarily stabilized, or that we face a statistical anomaly. The picture will become clearer upon the analysis of subsequent observations.
From the same authors


In the same category


DDoS attacks in Q3 2019