Authors
The evolution of the threat and its future
Part 2. KSN Report: Mobile ransomware in 2014-2016
Executive summary and main findings
Ransomware is a type of malware that, upon infecting a device, blocks access to it or to some or all of the information stored on it. In order to unlock either the device or the data, the user is required to pay a ransom, usually in bitcoins or another widely used e-currency. This report covers the evolution of the threat over the last two years.
Methodology:
This report has been prepared using depersonalized data processed by Kaspersky Security Network (KSN). The metrics are based on the number of distinct users of Kaspersky Lab products with the KSN feature enabled who encountered ransomware at least once in a given period. The term ransomware covers mainly two types of malware: so-called Windows blockers (they block the OS or browser with a pop-up window) and encryption ransomware. The term also includes select groups of Trojan-Downloaders, namely those that tend to download encryption ransomware upon infection of a PC. Nowadays, encryption ransomware is widely regarded as synonymous with ransomware, although, according to Kaspersky Lab statistics the number of users that regularly encounters blockers remains high.
Main findings:
- The total number of users who encountered ransomware between April 2015 and March 2016 rose by 17.7% compared to the previous 12 months (April 2014 to March 2015) – from 1,967,784 to 2,315,931 users around the world;
- The proportion of users who encountered ransomware at least once out of the total number of users who encountered malware rose 0.7 percentage points, from 3.63% in 2014-2015 to 4.34% in 2015-2016;
- Among those who encountered ransomware, the proportion who encountered cryptors rose dramatically – up 25 percentage points, from 6.6% in 2014-2015 to 31.6% in 2015-2016;
- The number of users attacked with cryptors rose 5.5 times, from 131,111 in 2014-2015to 718,536 in 2015-2016;
- The number of users attacked with Win-lockers decreased 13.03%, from 1,836,673 in 2014-2015 to 1,597,395 in 2015-2016;
Introduction: A brief history of ransomware
Although it has only now started to attract the widespread attention of the media and the security community, ransomware (including crypto-ransomware) as a type of malware has been known about for years: at least since 1989 when the first-known malware capable of encrypting file names (the AIDS Trojan) was discovered.
Another example of extortion malware was discovered by security researchers as long ago as the middle 2000s. This was the Gpcode malware, capable of encrypting files on infected machines with its own encryption algorithm. Gpcode was followed by several other families, like Krotten, Cryzip etc. From time to time another copycat or slightly different version of Gpcode emerged. The appearance of such programs would provoke relatively small incidents, but never resulted in something that looked anything like an epidemic.
This situation remained unchanged for years.
The Blockers epidemic
The first real ransomware epidemic started in 2010 with thousands of home users in Russia and some neighboring countries encountering cryptic windows that covered all other windows on their desktop. These windows usually contained a message from criminals asking the victim to send money to a given Premium-SMS number in order to unlock the screen or browser of their infected PC.
The scale of the problem turned out to be so great and the number of victims so significant that it prompted law enforcement agencies to become involved and gained extensive media coverage in Russia, from television to the blogosphere. Mobile phone operators did what they could to combat the threat, introducing new rules for registering and operating premium-rate (short) numbers, blocking accounts that had been used to perpetrate fraud and informing their customers about this type of fraud.
In late August 2010, several people were arrested in Moscow and accused of creating blockers. According to the Russian Ministry of the Interior, the illegal income generated by the criminal group was estimated at 500 million rubles (about 12.5 million euros).
The rise of so-called blockers was powered mainly by the fact that the creation of malware capable of blocking an OS browser or desktop did not require significant programming skills and generated a relatively reliable income for the criminal. Comparatively easy DIY sets for creating blockers were available on underground forums and this attracted a lot of low-level cybercriminals.
The security industry and law enforcement agencies reacted quickly: the arrest of the group, combined with the release of a number of services offering the free unlocking of locked systems made criminal efforts to extort money in this way both more risky and less profitable. Nevertheless, blockers remain on the threat landscape to this day – as illustrated in this report.
At the end of 2010, Kaspersky Lab researchers predicted that despite the arrests, the problem was unlikely to go away. Cybercriminals, the experts predicted, would simply use other methods to receive payment for ‘unblocking’ their victims’ computers, such as electronic money systems.
That is exactly what happened several years later when ransomware’s big comeback began.
Ransomware returns with encryption
The biggest difference between the two types of ransomware: blockers and encryption ransomware is that blocker damage is fully reversible. Even in the worst case scenario, the owner of an infected PC could simply reinstall the OS to get all their files back. In addition, the way in which blockers work allowed security researchers to develop automated technologies that help to fight against blockers even after infection. One such patented technology is implemented in Kaspersky Lab products and it basically puts a stop to the blocker threat for Kaspersky Lab clients.
However, when it comes to encryption ransomware things are much more complicated because the encrypted files are impossible to decrypt without a special key, which is usually stored on the cybercriminals’ servers. This makes it more important than ever to take a proactive approach to protection.
The severity of the consequences of successful infection is one of the reasons why encryption ransomware is enjoying a resurgence in popularity among cybercriminals. However, it is not the only one. The analysis in this report attempts to assess the scale of the problem, and to highlight possible reasons for its re-emergence almost ten years after the first encryption ransomware appeared on the threat landscape.
PC ransomware: From blockers to crypto-ransomware
One doesn’t need to look at the statistics to see that ransomware is once again a major problem for Internet users. You only need to read or watch the news. Nevertheless, the statistics help to show how big the problem is and whether there are aspects to the problem that you won’t learn from yet another news story about yet another ransomware infection.
The total number of users who encountered ransomware over the12 month period from April 2015 to March 2016 grew by 17.7% in comparison to the previous year: April 2014 to March 2015 – from 1,967,784 to 2,315,931 users around the world
The proportion of users who encountered ransomware at least once out of the total number of users who encountered malware rose 0.7 percentage points, from 3.63% in 2014-2015 to 4.34% in 2015-2016.
The following graphs illustrate the change in the number of users encountering ransomware at least once in the 24 month period covered by the report. As can be seen in Fig. 1, the prevalence of ransomware has been sporadic, rising and falling every few months. The rise in the use of crypto-malware has been more consistent: showing a steady increase in the number of attacked users, particularly from March 2015, before peaking in December 2015. Interestingly enough, from October 2015, all other types of ransomware were declining dramatically in number and by the turn of the year just a very small number of users encountered old school blockers and other non-encrypting ransomware.
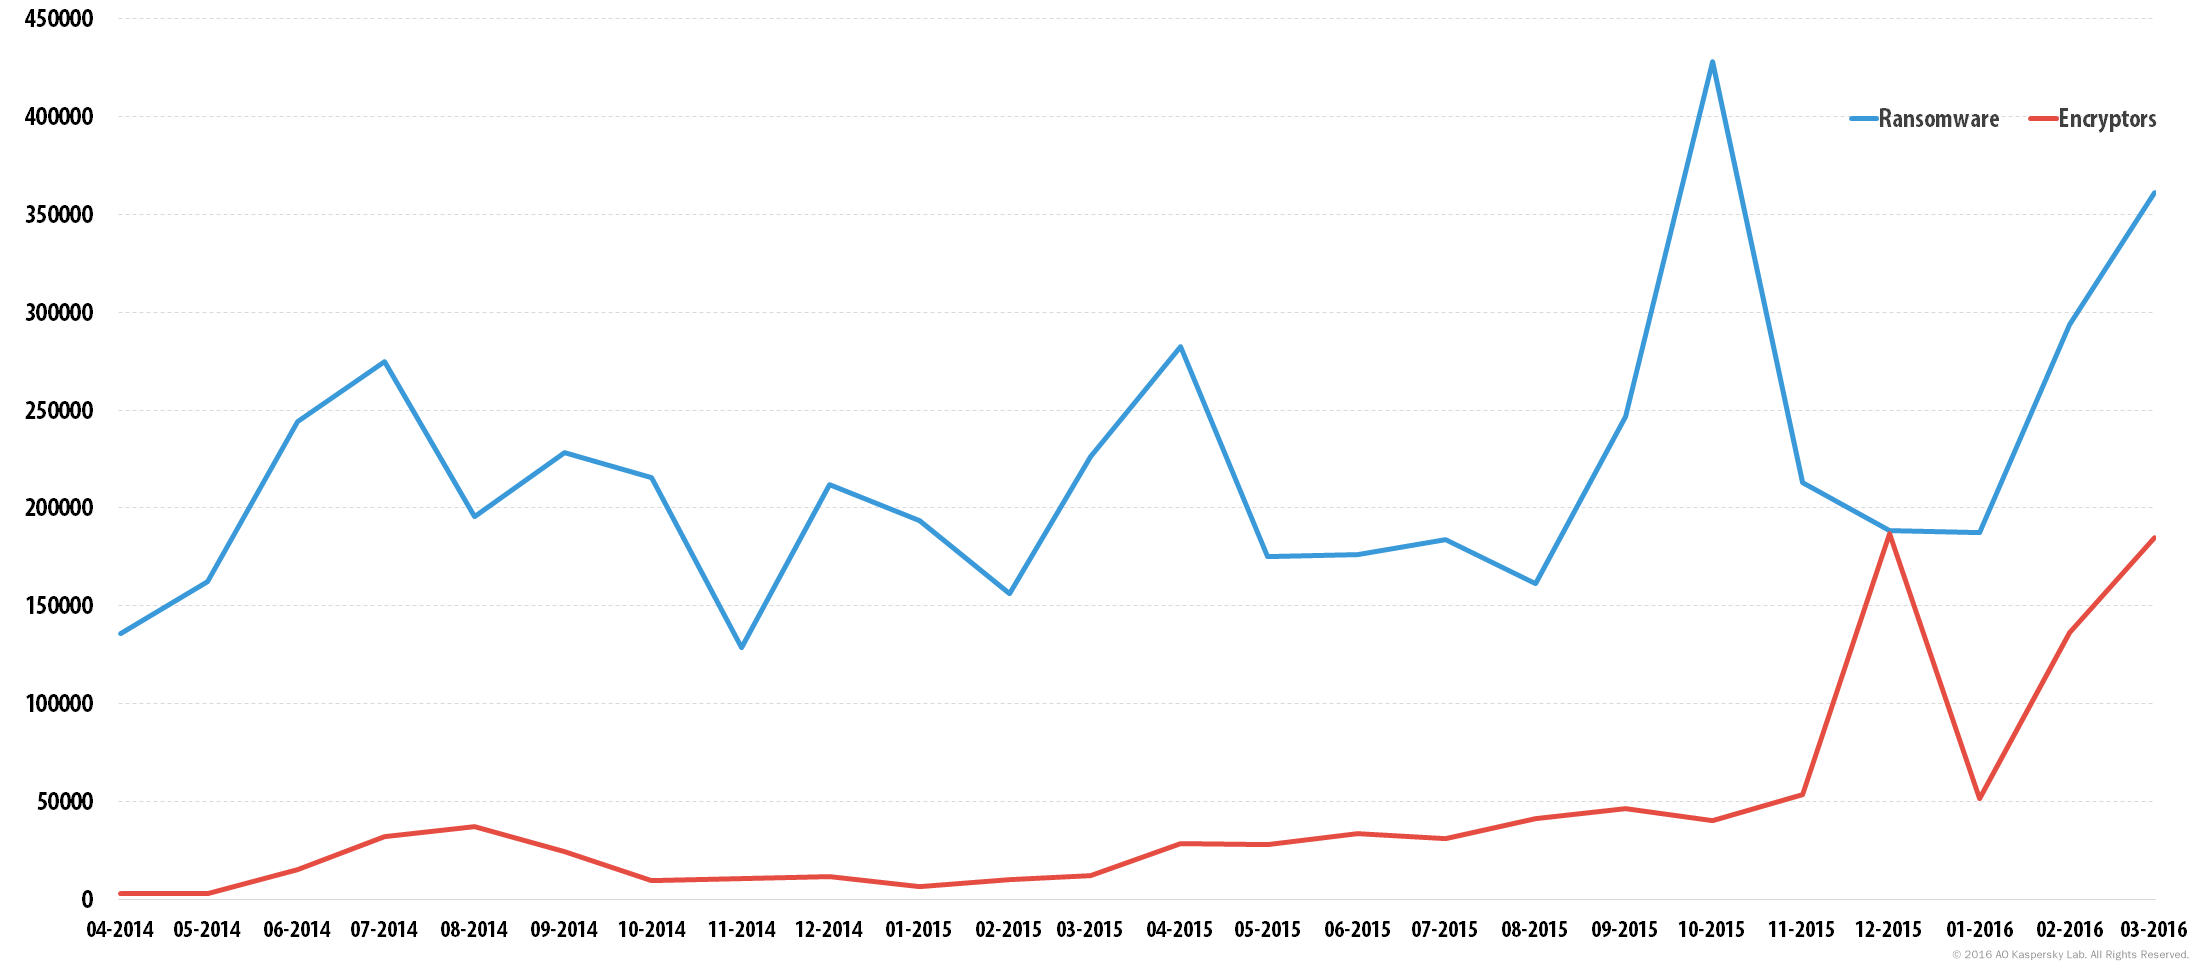
Fig. 1: The number of users encountering ransomware (including Encryptors and Downloaders that load encryptors) at least once in the period from April 2014 to March 2016
The decline did not last long. In February 2016, both categories started to recover from the dramatic fall in January, and numbers continue to rise.

Fig. 2: Number of users attacked with any malware 2014-2016
As seen in Fig. 2, the behavior of ransomware does not reflect overall attack trends. To discover the possible reasons behind the peaks and troughs we need to look deeper into the ransomware attack statistics.
The first main spike in the period under investigation was registered in July 2014 with more than 274 thousand users encountering some form of ransomware. The main reason for this surge was the Trojan-Ransom.JS.SMSer.pn, a browser-locker that attacked more than one-in-three (31%) those affected by ransomware that month. Encryptors were encountered by one-in-ten (11.63%) of all those who faced malware from the Trojan-Ransom category.
The next peak was registered in April 2015, when 282.5 thousand users were attacked with ransomware. This was provoked by several groups of malware, and about 10% of those affected encountered encryption ransomware.
October 2015 saw ransomware achieve an all-time-high with more than 428.4 thousand users attacked. Of those affected, 9.38% were hit with encryption ransomware. In March 2016, when another surge of ransomware attacks took place, the situation was very different: over half (51.9%) of those who encountered Trojan-Ransom malware were dealing with encryptors. This was mostly due to the activity of a small number of ransomware groups led, among others, by the infamous TeslaCrypt encryption ransomware.
The results for April and May 2016 – although beyond the scope of this report – confirm this trend: encryption ransomware affected 54% of attacked users in April 2016 and 35.7% in May, still well above the average for the previous 12 months.
Main actors of encryption ransomware
Looking at the malware groups that were active in the period covered by this report, it appears that a rather short list of suspects is responsible for most of the trouble caused by crypto-ransomware. In the first period, from April 2014 to March 2015, the most actively propagated encryptors were the following groups of malware: CryptoWall, Cryakl, Scatter, Mor, CTB-Locker, TorrentLocker, Fury, Lortok, Aura, and Shade. Between them they were able to attack 101,568 users around the world, accounting for 77.48% of all users attacked with crypto-ransomware during the period.

Fig. 3: Distribution of users attacked with different groups of encryption ransomware in 2014-2015
A year later the situation had changed considerably. TeslaCrypt, together with CTB-Locker, Scatter and Cryakl were responsible for attacks against 79.21% of those who encountered any crypto-ransomware.

Fig. 4: Distribution of users attacked with different groups of encryption ransomware in 2015-2016
Interestingly, in 2015-2016 the “Others” category decreased to 2.41% of attacked users while a year earlier it had accounted for 22.55%. This drop could be a sign of the development of criminal-to-criminal infrastructure. Instead of developing their own, unique crypto-ransomware, criminals started to purchase off-the-shelf, ready-to-use malware. You can read more about this process in the “How it is done” section of this report. But before that, let’s see what kind of users the malicious actors behind ransomware were after.
Type of users attacked with ransomware
Most ransomware attacks are directed at home users. That was the case with the 2010-blockers epidemic in post-soviet territories, and also for the first period covered by this report. 93.2% of the users who encountered ransomware were users of home products, while the remaining 6.8% were corporate users. In the second period, however, the share of corporate users attacked with ransomware more than doubled to 13.13%, a rise of over 6 percentage points. All “thanks to” encryption ransomware.

Fig. 5: Type of users encountering ransomware in 2014-2016
When looking at crypto-ransomware, the situation is different: throughout the 24 months covered by the report the share of corporate users attacked with encryptors remained steady at about 20% (rising only slightly to 22.07% in 2015-2016). But this apparent stability is not reflected in the actual numbers.
The number of corporate users attacked with crypto-ransomware increased nearly six-fold (5.86 times): from 27 thousand in 2014-2015 to 158.6 thousand in 2015-2016, with home users hit nearly as hard: up 5.37 times.
Geography
When analyzing the geography of attacked users, it is important to bear in mind that the numbers are influenced by the distribution of Kaspersky Lab’s customers around the world.
As a result, in order to understand accurately where most of the users attacked with ransomware lived, we use special metrics: the percentage of users attacked with ransomware as a proportion of the users attacked with any kind of malware. We believe this gives a much more precise picture of the threat landscape than direct comparison between users hit by ransomware in each territory.
In 2014-2015, the list of countries with the highest share of users attacked with ransomware looked as follows.
| Country | % of users attacked with ransomware, out of all users encountering malware |
| Kazakhstan | 6.99% |
| Algeria | 6.23% |
| Ukraine | 5.87% |
| Italy | 4.69% |
| Russian Federation | 4.63% |
| Vietnam | 3.86% |
| India | 3.77% |
| Germany | 3.00% |
| Brazil | 2.60% |
| United States | 2.07% |
Fig. 6: The list of countries with the biggest share of users attacked with ransomware as a proportion of all users attacked with any kind of malware in 2014-2015
Kazakhstan, Algeria, Ukraine, Italy and Russia led the list with the percentage of attacked users exceeding 4%.
One year later, the situation had changed significantly: India moved from 7th to 1st place, with 9.6% of users. The share of Russian users also rose to 6.41%, followed by Kazakhstan, Italy, Germany, Vietnam and Algeria. In the previous year these countries were all in the second half of the Top 10.
| Country | % of users attacked with ransomware out of all users encountering malware |
| India | 9.60% |
| Russian Federation | 6.41% |
| Kazakhstan | 5.75% |
| Italy | 5.25% |
| Germany | 4.26% |
| Vietnam | 3.96% |
| Algeria | 3.90% |
| Brazil | 3.72% |
| Ukraine | 3.72% |
| United States | 1.41% |
Fig. 7 the list of countries with the biggest share of users attacked with ransomware as a proportion of all users attacked with any kind of malware in 2015-2016
Of these, India, Brazil, Russia and Germany lead the list of countries with the biggest growth in the number of attacked users, while the number in the US, Vietnam, Algeria, Ukraine and Kazakhstan has notably decreased.
| Country | 2014-2015 | 2015-2016 | Y-to-Y change |
| Russian Federation | 562190 | 867651 | up 54.33% |
| India | 143973 | 325638 | up 126.18% |
| United States | 107755 | 55679 | down 48.33% |
| Germany | 102289 | 138750 | up 35.65% |
| Vietnam | 96092 | 89247 | down 7.12% |
| Ukraine | 69220 | 39246 | down 43.3% |
| Kazakhstan | 62719 | 39179 | down 37.53% |
| Algeria | 61623 | 38530 | down 37.43% |
| Italy | 49400 | 59130 | up 19.7% |
| Brazil | 43674 | 70078 | up 60.46% |
Fig. 8 the year-to-year change in the number of users attacked with any type of ransomware
The above numbers are evidence of the change in the whole Trojan-Ransom category. If we look deeper into the share of users attacked with Trojan-Ransom who experienced an attack by encryption ransomware, the picture becomes significantly different.
| Country | % of users attacked with encryption ransomware in 2014-2015 | % of users attacked with encryption ransomware in 2015-2016 |
| Russian Federation | 6.09% | 20.43% |
| India | 3.34% | 6.93% |
| United States | 14.27% | 39.79 % |
| Germany | 4.64% | 94.41% |
| Vietnam | 2.32% | 22.87 % |
| Ukraine | 1.34% | 28.86% |
| Kazakhstan | 1.14% | 25.59% |
| Algeria | 1.18% | 13.48 % |
| Italy | 8.93% | 89.7% |
| Brazil | 2.56% | 31.83% |
| Other | 41.16% | 46.3% |
Fig. 09: The year-on-year change in the share of users attacked with encryption ransomware as a proportion of users attacked with any kind of ransomware
The ten countries above accounted for 64.14% of all users who encountered any kind of ransomware, and 52.83% of those who encountered cryptors. In 2015-2016 these figures rose to 64.57% and 61.32% respectively.
It is clear from Fig. 09 that during 2014-2015 encryption ransomware was, in most countries (except the US) yet another type of ransomware, with a relatively small percentage of attacked users. A year later, encryption ransomware became much more visible on the threat landscape, increasing its share of attacks by well over 20% in some countries (the US, Brazil, Kazakhstan, Ukraine, Vietnam and Russia). And for some countries, like Germany and Italy, encryption ransomware became almost synonymous with the Trojan-Ransom category.
To conclude the issue of geography, we can say that while, overall, the share of users attacked with malware from Trojan-Ransom barely changed, the actual number of attacked users increased by double digits. Although in some countries the exact number of users attacked with any type of ransomware decreased, there is no country in the list that showed a decrease in the share of users attacked with encryption ransomware. This of course doesn’t give a clear answer to the question: Did the actual number of users attacked with encryption ransomware actually increase in these countries or is the increase in the share of users attacked with encryption simply the result of a declining number of users being attacked with blockers? As can be seen in Fig. 10, the answer is yes, and in some countries, like Germany, Brazil, Ukraine, Kazakhstan and Italy, the growth rate was extremely high, which obviously means that users, especially in these countries should be extremely cautious when surfing the web.
| Country | 2014-2015 | 2015-2016 | Year-to-Year Change (times) |
| Russian Federation | 34226 | 177249 | +5,18 |
| India | 4803 | 22572 | +4,70 |
| United States | 15380 | 22155 | +1,44 |
| Germany | 4744 | 96566 | +20,36 |
| Vietnam | 2230 | 20409 | +9,15 |
| Ukraine | 925 | 11257 | +12,17 |
| Kazakhstan | 716 | 10025 | +14,00 |
| Algeria | 728 | 5195 | +7,14 |
| Italy | 4412 | 53039 | +12,02 |
| Brazil | 1116 | 22307 | +19,99 |
| Others | 61853 | 277962 | +4,49 |
Fig. 10: the year-on-year growth rate of users attacked with encryption ransomware in the top 10 countries with a higher proportion of such users
To be continued.
If you’re a victim of ransomware, visit our NoRansom site for decryption tools and further learning.
KSN Report: PC ransomware in 2014-2016
From the same authors


In the same category


David Brown
Do you have statistics that show a breakdown of ransomware victims by operating system?