The cyberphysical risks of wearable gadgets
We continue to research how proliferation of IoT devices affects the daily lives of users and their information security. In our previous study, we touched upon ways of intercepting authentication data using single-board microcomputers. This time, we turned out attention to wearable devices: smartwatches and fitness trackers. Or more precisely, the accelerometers and gyroscopes inside them.
From the hoo-ha surrounding Strava, we already know that even impersonal data on user physical activity can make public what should be non-public information. But at the individual level, the risks are far worse: these smart devices are able to track the moments you’re entering a PIN code in an ATM, signing into a service, or unlocking a smartphone.
In our study, we examined how analyzing signals within wearable devices creates opportunities for potential intruders. The findings were less than encouraging: although looking at the signals from embedded sensors we investigated cannot (yet) emulate “traditional” keyloggers, this can be used to build a behavioral profile of users and detect the entry of critical data. Such profiling can happen discreetly using legitimate apps that run directly on the device itself. This broadens the capacity for cybercriminals to penetrate victims’ privacy and facilitates access to the corporate network of the company where they work.
So, first things first.
Behavioral profiling of users
When people hear the phrase ‘smart wearables’, they most probably think of miniature digital gadgets. However, it is important to understand that most smartwatches are cyberphysical systems, since they are equipped with sensors to measure acceleration (accelerometers) and rotation (gyroscopes). These are inexpensive miniature microcircuits that frequently contain magnetic field sensors (magnetometers) as well. What can be discovered about the user if the signals from these sensors are continuously logged? More than the owner of the gadget would like.
For the purpose of our study, we wrote a fairly simple app based on Google’s reference code and carried out some neat experiments with the Huawei Watch (first generation), Kingwear KW88, and PYiALCY X200 smartwatches based on the Android Wear 2.5 and Android 5.1 for Smartwatch operating systems. These watches were chosen for their availability and the simplicity of writing apps for them (we assume that exploiting the embedded gyroscope and accelerometer in iOS would follow a similar path).
To determine the optimal sampling frequency of the sensors, we conducted a series of tests with different devices, starting with low-power models (in terms of processor) such as the Arduino 101 and Xiaomi Mi Band 2. However, the sensor sampling and data transfer rates were unsatisfactory — to obtain cross-correlation values that were more or less satisfactory required a sampling frequency of at least 50 Hz. We also rejected sampling rates greater than 100 Hz: 8 Kbytes of data per second might not be that much, but not for hours-long logs. As a result, our app sampled the embedded sensors with a frequency of 100 Hz and logged the instantaneous values of the accelerometer and gyroscope readings along three axes (x, y, z) in the phone’s memory.
Admittedly, getting a “digital snapshot” of a whole day isn’t that easy, because the Huawei watch’s battery life in this mode is no more than six hours.
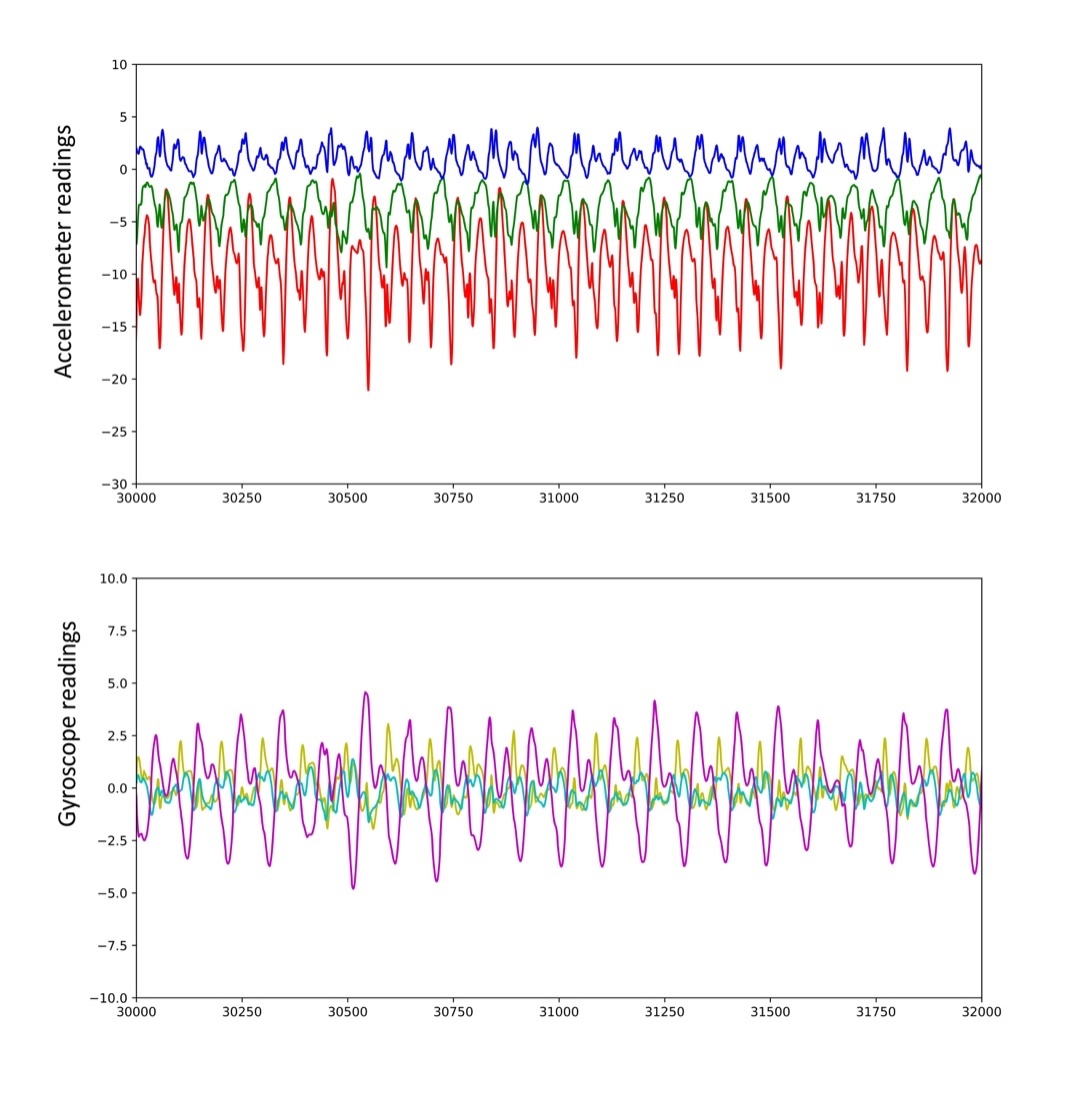
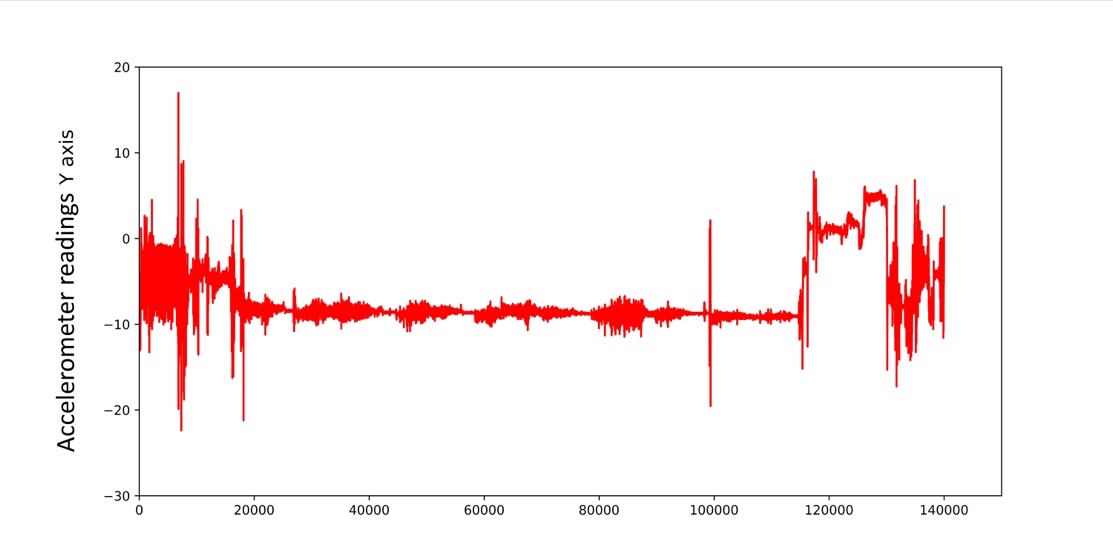
But let’s take a look at the accelerometer readings for this period. The vertical axis shows the acceleration in m/s2, and the horizontal the number of samples (each corresponds to 10 milliseconds on average). For a complete picture, the accelerometer and gyroscope readings are presented in the graphs below.

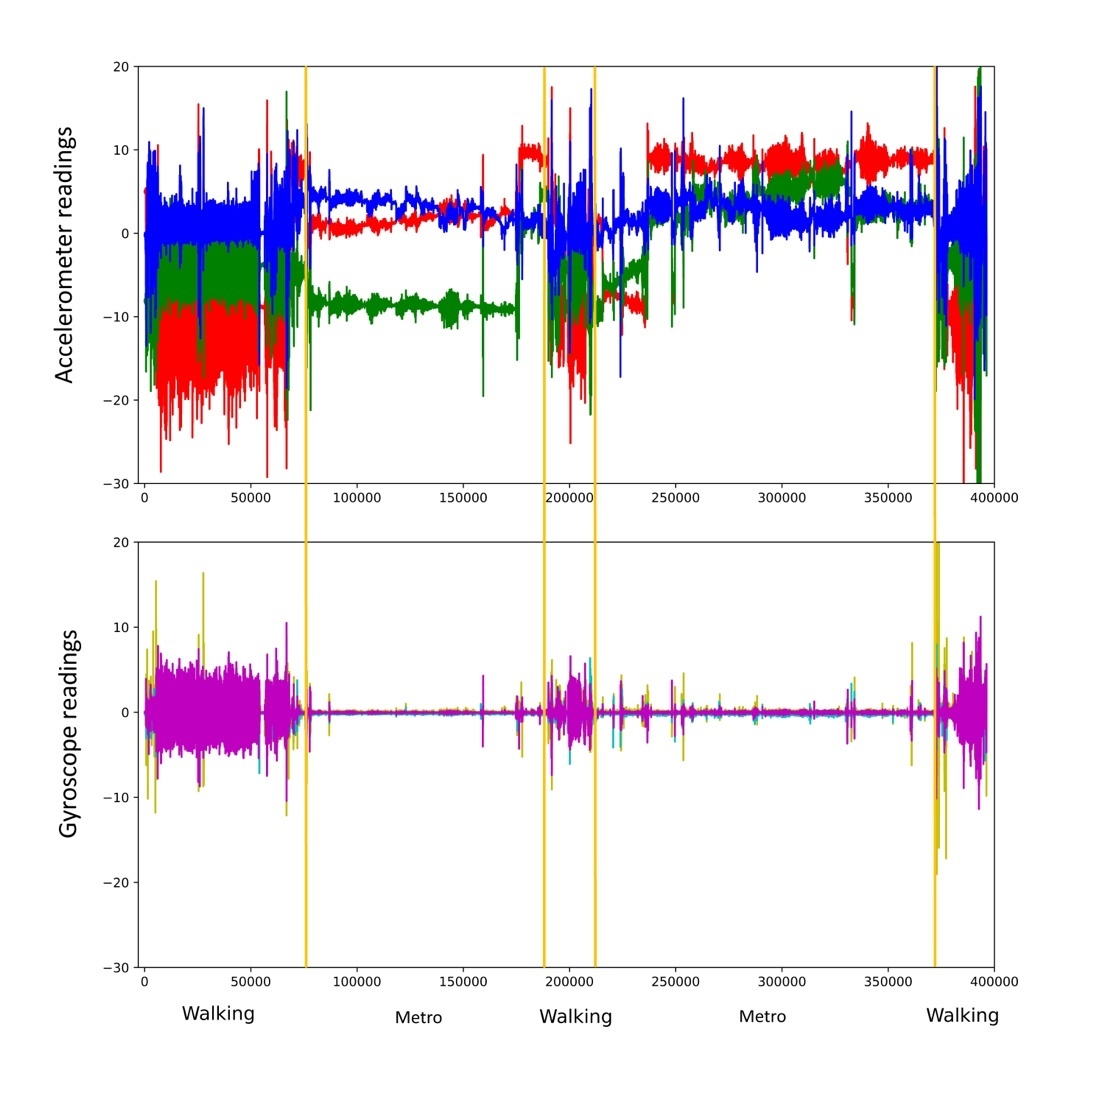
Digital profile of a user recorded in one hour. Top — accelerometer signals, bottom — gyroscope signals
The graphs contains five areas in which different patterns are clearly visible. For those versed in kinematics, this graph tells a lot about the user.
The most obvious motion pattern is walking. We’ll start with that.
When the user is walking, the hand wearing the smartwatch oscillates like a pendulum. Pendulum swings are a periodic process. Therefore, if there are areas on the graph where the acceleration or orientation readings from the motion sensor vary according to the law of periodicity, it can be assumed that the user was walking at that moment. When analyzing the data, it is worth considering the accelerometer and gyroscope readings as a whole.
Let’s take a closer look at the areas with the greatest oscillations over short time intervals (the purple areas Pattern1, Pattern3, and Pattern5).
In our case, periodic oscillations of the hand were observed for a duration of 12 minutes (Pattern1, figure above). Without requesting geoinformation, it’s difficult to say exactly where the user was going, although a double numerical integration of the acceleration data shows with an accuracy up to the integration constants (initial velocity and coordinates) that the person was walking somewhere, and with varying characteristic velocity.
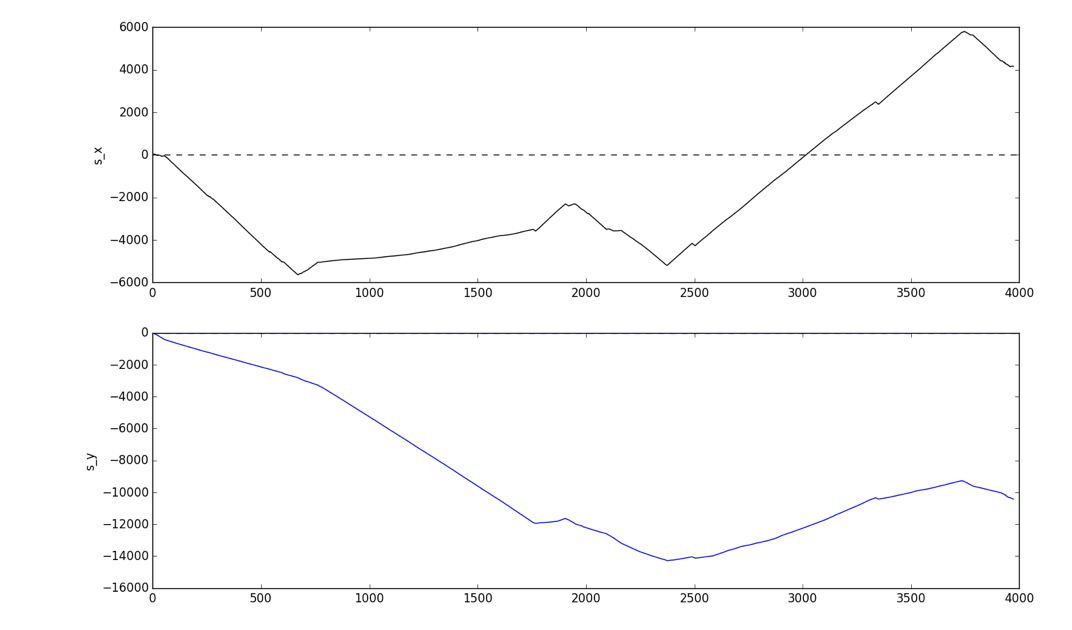
Result of the numerical integration of the accelerometer data, which gives an estimate of the user’s movement along the x and y axes in the space of one hour (z-axis displacement is zero, so the graph does not show it)
Note that plotting the Y-axis displacement relative to the X-axis displacement gives the person’s approximate path. The distances here are not overly precise, but they are in the order of thousands of meters, which is actually quite impressive, because the method is very primitive. To refine the distance traveled, anthropometric data can be used to estimate the length of each step (which is basically what fitness trackers do), but we shall not include this in our study.

Approximate path of the person under observation, determined on the basis of numerically integrating the accelerometer data along the X and Y axes
It is more difficult to analyze the less active areas. Clearly, the person was at rest during these periods. The orientation of the watch does not change, and there is acceleration, which suggests that the person is moving by car (or elevator).
Another 22-minute segment is shown below. This is clearly not walking — there are no observable periodic oscillations of the signal. However, we see a periodic change in the acceleration signal envelope along one axis. It might be a means of public transport that moves in a straight line, but with stops. What is it? Some sort of public transportation?
Here’s another time slice.
This seems to be a mixture of short periods of walking (for a few seconds), pauses, and abrupt hand movements. The person is presumably indoors.
Below we interpret all the areas on the graph.
These are three periods of walking (12, 3, and 5 minutes) interspersed with subway journeys (20 and 24 minutes). The short walking interval has some particular characteristics, since it involved changing from one subway line to another. These features are clearly visible, but our interest was in determining them using algorithms that can be executed on the wearable devices themselves. Therefore, instead of neural networks (which we know to be great at this kind of task), we used a simple cross-correlation calculation.
Taking two walking patterns (Walking1 and Walking2), we calculated their cross-correlation with each other and the cross-correlation with noise data using 10-second signal data arrays.
| Function Experiment |
max (cor) Ax | max (cor) Ay | max (cor) Az | max (cor) Wx | max (cor) Wy | max (cor) Wz |
| Walking1 and Walking2 | 0.73 | 0.70 | 0.64 | 0.62 | 0.41 | 0.83 |
| Walking1 and Noise | 0.33 | 0.30 | 0.32 | 0.30 | 0.33 | 0.33 |
Maxima of the functions for cross-correlation of walking patterns with each other and with an arbitrary noise pattern
It can be seen from the table that even this elementary approach for calculating cross-correlation functions allows us to identify the user’s movement patterns within his/her “digital snapshot” with an accuracy of up to 83% (given a very rough interpretation of the correlation). This indicator may not seem that high, but it should be stressed that we did not optimize the sample size and did not use more complex algorithms, for example, principle component analysis, which is assumed to work quite well in determining the characteristic parts of the signal log.
What does this provide to the potential attackers? Having identified the user’s movements in the subway, and knowing the characteristic directions of such movement, we can determine which subway line the user is traveling on. Sure, it would be much easier having data about the orientation of the X and Y axes in space, which could be obtained using a magnetometer. Unfortunately, however, the strong electromagnetic pickup from the electric motors, the low accuracy of determining a northerly direction, and the relatively few magnetometers in smartwatches forced us to abandon this idea.
Without data on the orientation of the X and Y axes in space (most likely, different for individual periods), the problem of decoding the motion trajectory becomes a geometric task of overlaying time slices of known length onto the terrain map. Again, placing ourselves in the attacker’s shoes, we would look for the magnetic field bursts indicate the acceleration/deceleration of an electric train (or tram or trolleybus), which can provide additional information allowing us to work out the number of interim points in the time slices of interest to us. But this too is outside the scope of our study.
Cyberphysical interception of critical data
But what does this all reveal about the user’s behavior? More than a bit, it turns out. It is possible to determine when the user arrives at work, signs into a company computer, unlocks his or her phone, etc. Comparing data on the subject’s movement with the coordinates, we can pinpoint the moments when they visited a bank and entered a PIN code at an ATM.
PIN codes
How easy is it to capture a PIN code from accelerometer and gyroscope signals from a smartwatch worn on the wrist? We asked four volunteers to enter personal PINs at a real ATM.
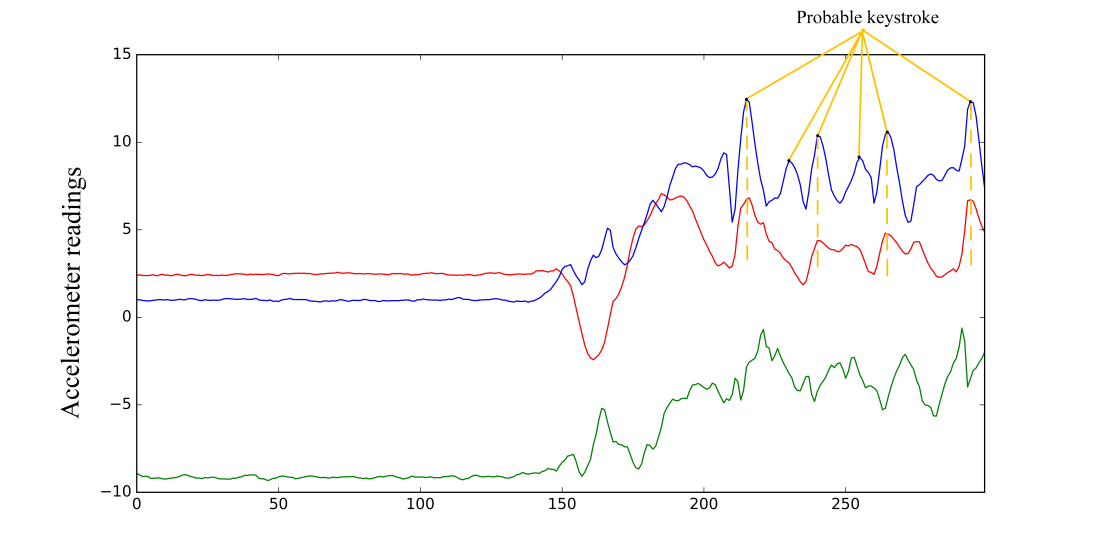
Jumping slightly ahead, it’s not so simple to intercept an unencrypted PIN code from sensor readings by elementary means. However, this section of the “accelerometer log” gives away certain information — for example, the first half of the graph shows that the hand is in a horizontal position, while the oscillating values in the second half indicate keys being pressed on the ATM keypad. With neural networks, signals from the three axes of the accelerometer and gyroscope can be used to decipher the PIN code of a random person with a minimum accuracy of 80% (according to colleagues from Stevens Institute of Technology). The disadvantage of such an attack is that the computing power of smartwatches is not yet sufficient to implement a neural network; however, it is quite feasible to identify this pattern using a simple cross-correlation calculation and then transfer the data to a more powerful machine for decoding. Which is what we did, in fact.
| Function Experiment |
max (cor) Ax | max (cor) Ay | max (cor) Az | max (cor) Wx | max (cor) Wy | max (cor) Wz |
| One person and different tries | 0.79 | 0.87 | 0.73 | 0.82 | 0.51 | 0.81 |
Maxima of the functions for cross-correlation of PIN entry data at an ATM
Roughly interpreting these results, it is possible to claim 87% accuracy in recovering the PIN entry pattern from the general flow of signal traffic. Not bad.
Passwords and unlock codes
Besides trips to the ATM, we were interested in two more scenarios in which a smartwatch can undermine user security: entering computer passwords and unlocking smartphones. We already knew the answer (for computers and phones) using a neural network, of course, but we still wanted to explore first-hand, so to speak, the risks of wearing a smartwatch.
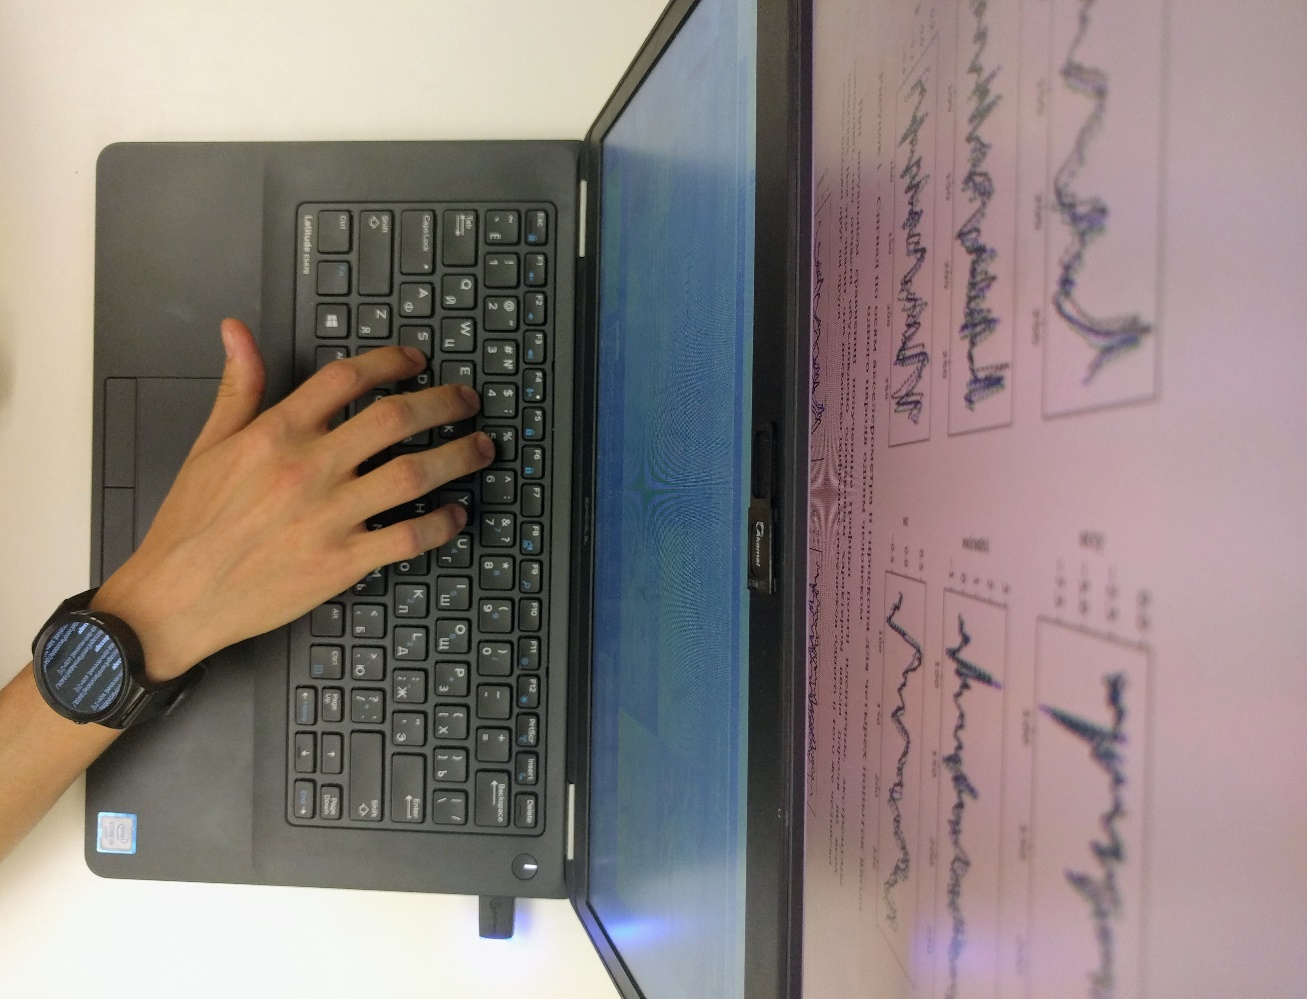
Sure, capturing a password entered manually on a computer requires the person to wear a smartwatch on both wrists, which is an unlikely scenario. And although, theoretically, dictionaries could be used to recover semantically meaningful text from one-handed signals, it won’t help if the password is sufficiently strong. But, again, the main danger here is less about the actual recovery of the password from sensor signals than the ease of detecting when it is being entered. Let’s consider these scenarios in detail.
We asked four people to enter the same 13-character password on a computer 20 times. Similarly, we conducted an experiment in which two participants unlocked an LG Nexus 5X smartphone four times each with a 4-digit key. We also logged the movements of each participant when emulating “normal” behavior, especially in chat rooms. At the end of the experiment, we synchronized the time of the readings, cutting out superfluous signals.
In total, 480 discrete functions were obtained for all sensor axes. Each of them contains 250-350 readings, depending on the time taken to enter the password or arbitrary data (approximately three seconds).

Signal along the accelerometer and gyroscope axes for four attempts by one person to enter one password on a desktop computer
To the naked eye, the resulting graphs are almost identical; the extremes coincide, partly because the password and mode of entry were identical in all attempts. This means that the digital fingerprints produced by one and the same person are very similar to each other.

Signals along the accelerometer and gyroscope axes for attempts to enter the same password by different people on a desktop computer
When overlaying the signals received from different people, it can be seen that, although the passphrase is the same, it is entered differently, and even visually the extremes do not coincide!
It is a similar story with mobile phones. Moreover, the accelerometer captures the moments when the screen is tapped with the thumb, from which the key length can be readily determined.
But the eye can be deceived. Statistics, on the other hand, are harder to hoodwink. We started with the simplest and most obvious method of calculating the cross-correlation functions for the password entry attempts by one person and for those by different people.
The table shows the maxima of the functions for cross-correlation of data for the corresponding axes of the accelerometer and gyroscope.
| Function Experiment |
max (cor) Ax | max (cor) Ay | max (cor) Az | max (cor) Wx | max (cor) Wy | max (cor) Wz |
| One person | 0.92 | 0.63 | 0.71 | 0.55 | 0.76 | 0.96 |
| Different persons | 0.65 | 0.35 | 0.31 | 0.23 | 0.37 | 0.76 |
Maxima of the functions for cross-correlation of password input data entered by different people on a desktop computer
Broadly speaking, it follows that even a very simple cross-correlation calculation can identify a person with up to 96% accuracy! If we compare the maxima of the cross-correlation function for signals from different people in arbitrary text input mode, the correlation maximum does not exceed 44%.
| Function Experiment |
max (cor) Ax | max (cor) Ay | max (cor) Az | max (cor) Wx | max (cor) Wy | max (cor) Wz |
| One person and different activity | 0.32 | 0.27 | 0.39 | 0.26 | 0.30 | 0.44 |
Maxima of the functions for cross-correlation of data for different activities (password entry vs. usual surfing)
| Function Experiment |
max (cor) Ax | max (cor) Ay | max (cor) Az | max (cor) Wx | max (cor) Wy | max (cor) Wz |
| One person | 0.64 | 0.47 | 0.56 | 0.41 | 0.30 | 0.58 |
| Different persons | 0.33 | 0.40 | 0.40 | 0.32 | 0.38 | 0.34 |
Maxima of the functions for cross-correlation of data for an unlock code entered by one person and by different people
Note that the smallest cross-correlation function values were obtained for entering the smartphone unlock code (up to 64%), and the largest (up to 96%) for entering the computer password. This is to be expected, since the hand movements and corresponding acceleration (linear and angular) are minimal in the case of unlocking.
However, we note once more that the computing power available to a smartwatch is sufficient to calculate the correlation function, which means that a smart wearable gadget can perform this task by itself!
Conclusions
Speaking from the information security point of view, we can conclude that, without a doubt, portable cyberphysical systems expand the attack surface for potential intruders. That said, the main danger lies not in the direct interception of input data — that is quite difficult (the most successful results are achieved using neural networks) and thus far the accuracy leaves much to be desired. It lies instead in the profiling of users’ physical behavior based on signals from embedded sensors. Being “smart,” such devices are able to start and stop logging information from sensors not only through external commands, but on the occurrence of certain events or the fulfillment of certain conditions.
The recorded signals can be transmitted by the phone to the attacker’s server whenever the latter has access to the Internet. So an unassuming fitness app or a new watch face from the Google Play store can be used against you, right now in fact. The situation is compounded by the fact that, in addition to this app, simply sending your geotag once and requesting the email address linked to your Google Play account is enough to determine, based on your movements, who you are, where you’ve been, your smartphone usage, and when you entered a PIN at an ATM.
We found that extracting data from traffic likely to correspond to a password or other sensitive information (name, surname, email address) is a fairly straightforward task. Applying the full power of available recognition algorithms to these data on a PC or in cloud services, attackers, as shown earlier, can subsequently recover this sensitive information from accelerometer and gyroscope signal logs. Moreover, the accumulation of these signals over an extended period facilitates the tracking of user movements — and that’s without geoinformation services (such as GPS/GLONASS, or base station signals).
We established that the use of simple methods of analyzing signals from embedded sensors such as accelerometers and gyroscopes makes it possible (even with the computing power of a wearable device) to determine the moments when one and the same text is entered (for example, authentication data) to an accuracy of up to 96% for desktop computers and up to 64% for mobile devices. The latter accuracy could be improved by writing more complex algorithms for processing the signals received, but we intentionally applied the most basic mathematical toolbox. Considering that we viewed this experiment through the prism of the threat to corporate users, the results obtained for the desktop computer are a major cause for concern.
A probable scenario involving the use of wearable devices relates to downloading a legitimate app to a smartwatch — for example, a fitness tracker that periodically sends data packets of several dozen kilobytes in size to a server (for example, the uncompressed “signal signature” for the 13-character password was about 48 kilobytes).
Since the apps themselves are legitimate, we assume that, alongside our Android Wear/Android for Smartwatch test case, this scenario can be applied to Apple smartwatches, too.
Recommendations
There are several indications that an app downloaded onto a smartwatch might not be safe.
- If, for instance, the app sends a request for data about the user’s account (the GET_ACCOUNTS permission in Android), this is cause for concern, since cybercriminals need to match the “digital fingerprint” with its owner. However, the app can also allow the user to register by providing an email address — but in this case you are at least free to enter an address different to that of the Google Play account to which your bank card is linked.
- If the app additionally requests permission to send geolocation data, your suspicions should be aroused even further. The obvious advice in this situation is not to give additional permissions to fitness trackers that you download onto your smartwatch, and to specify a company email address at the time of registration.
- A short battery life can also be a serious cause for concern. If your gadget discharges in just a few hours, this is a sign that you may be under observation. Theoretically, a smartwatch can store logs of your activity with length up to dozens of hours and upload this data later.
In general, we recommend keeping a close eye on smartwatches sported by employees at your office, and perhaps regulating their use in the company’s security policies. We plan to continue our research into cyberphysical systems such as wearable smart gadgets, and the additional risks of using them.




Trojan watch