
Quarterly overview
- The percentage of spam in mail traffic averaged 82.3%
- PayPal led the Top 5 table of organizations most frequently targeted by phishing attacks. Other Top 5 targets included Facebook and World of Warcraft
- Spam with malicious attachments accounted for 4.6% of all mail traffic
- Graphical attachments were found in 8.4% of all spam emails
- Spammers actively created fake notifications, allegedly from well known online resources
- Europe took the lead as the top source of spam, while the percentage of spam coming from Latin America fell quite considerably
Introduction
The third quarter of 2010 started off with several favorable events for the anti-spam industry. In August, the security intelligence firm, LastLine, worked with a task force to shut down over 20 control centers used by the Pushdo / Cutwail botnet which was responsible for approximately 10% of all spam worldwide. The threat posed by this botnet was not just the sheer volume of spam that it distributed, but also its connection to the spread of particularly malicious programs such as Zbot (ZeuS) and TDSS.
When the botnet’s command centers were closed down, an enormous number of bots ceased distributing spam as they were no longer under the spammers’ control. Nevertheless, hoping that the situation would stay that way was futile. As was shown when the McColo and Lethic botnets were shut down, it only takes about a month to restore a botnet by linking infected computers to new control centers. The volume of spam then returns to its previous levels.
In September, the SpamIt partner program announced its closure. This partner program was responsible for enormous volumes of pharmaceutical spam. The program’s websites (Spamit.biz and Spamit.com) stated the reason for the closure as being “a long list of negative events over the past year and intensified attention being paid to the partner program’s operations”. The so-called partnership did indeed take several hits this year, including Mastercard’s refusal to execute any transactions related to payment for medication via the SpamIt partner program. However, the closure of one partner program — even a major one — will only result in a temporary decrease in the amount of advertisements for Viagra in our inboxes; the spammers aren’t about to abandon such a lucrative business. More likely than not, the organizers of the partner program will simply open a new program that will, for a while, remain under the radar of the anti-spam vendors and law enforcement agencies.
There is some bad news along with the good however. Spam is becoming a greater threat as it now frequently contains a variety of malicious attachments and links to infected websites. We urge readers not to open any attachments or click on any links in spam emails.
Spam by category
The chart below illustrates the percentage of spam in mail traffic on a monthly basis during the third quarter of 2010. As can be seen, there was a drop of 1.5 percentage points in the amount of spam appearing in users’ inboxes during September compared to August. This was a direct result of the shutdown of the Pushdo / Cutwail botnet control centers.

The monthly percentage of spam in the third quarter of 2010
The lowest recorded volume of spam for the third quarter of 2010 was 76.9%, which occurred on 15 September, while a peak of 90.1% was observed on 25 July and again on 31 July. The average percentage of spam in mail traffic over the quarter was 82.3%.
Sources of spam
Sources of spam by region
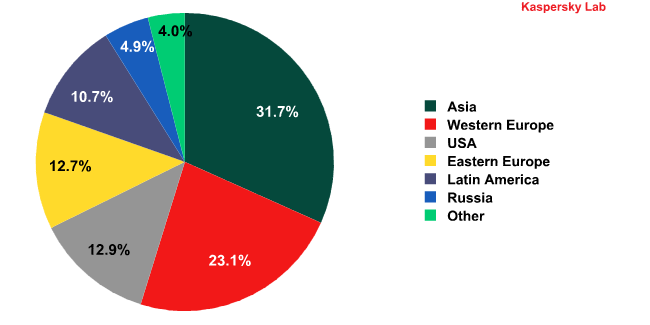
The distribution of spam sources in the third quarter of 2010
Asia is still the number one source of spam.
Latin America, which was the second largest source of spam in the second quarter, fell to fifth place this quarter, down from 16.3% to 10.7%.
Western Europe’s contribution to global spam increased to 23.1%, up from 16.2% in the second quarter.
The increased percentage of spam coming from Western Europe, when added to the outputs from Eastern Europe and Russia, meant that the total spam output for Europe as a whole was driven quite considerably upwards. As a result, in September, the amount of spam coming from Europe amounted to 40.7%, squeezing Asia, with 31.7%, out of the number one slot.

Spam originating in Europe and Asia, month-by-month during the third quarter of 2010
Europe’s increased production of spam may be linked to the mass malicious mailings that started to become active back in June. One of the goals of these mailings was to connect users’ computers to a botnet. The email was made to resemble a notification from an official online resource such as a bank, an online store or a social network. The resources selected by the cybercriminals are very popular among European Internet users, and subsequently when attacked, their computers faced the highest risk of infection. As a result, by September the amount of spam sent from Europe had increased.
Sources of spam by country
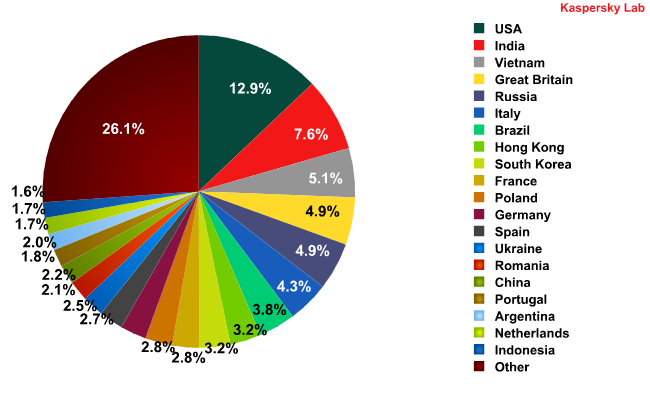
The distribution of spam sources by country
The USA took first place as the primary source of spam, with India and Vietnam taking second and third places respectively, as they did during the second quarter of this year.
It is also worth mentioning that the UK took fourth place in the Top 5 for the first time since Kaspersky Lab began monitoring the most prolific sources of spam. Up until now, the UK has never even made it into the Top 10 countries in terms of spam production.
Types of attachments in spam emails

The percentage of spam emails containing plain text and HTML attachments
Over the third quarter, most spam emails contained a combination of plain text and HTML code. Slightly fewer spam emails also featured unformatted text and less still, just HTML.
The JPEG format was most frequently used for graphical attachments. This was primarily due to mailings promoting spam services in which images were formed using several different JPEG images next to each other.
There was a notable increase in the number of spam emails with ZIP and other similarly packed attachments during the third quarter of 2010. Typically, these types of emails represent under 0.5% of the total volume of spam, but that number rose to 2.6% for Q3. This rise is explained by the mass mailing of malicious programs.
Image spam
The amount of image spam is falling. In the first quarter of the year it reached 11.7%, and then fell to 10.3% in the second quarter. In the third quarter, that number fell once more, going down to 8.4%.
Notably, the technology used to create graphical attachments is now being used by those who spread malicious programs. For example, the email below contained a malicious attachment (Trojan.Win32.Oficla) and the image included both the eFax logo and the text: “The fax message is attached to this e-mail!”.

An example of an email with a graphical attachment
Phishing
PayPal continues to hold a solid lead among the organizations most frequently targeted by phishers. The online auction company, eBay, is once again in second place, followed by Facebook and HSBC which switched places from the second quarter.

The Top 10 organizations targeted by phishers during the third quarter of 2010
Among the most noteworthy changes in the Top 10 was World of Warcraft’s entry among the leaders. Kaspersky Lab has been monitoring attacks against WoW gamers over the past year and this is the first time that they have been targeted so frequently by phishers.
Google fell from fifth place to seventh. The percentage of attacks against users of Google’s services fell by nearly 1 percentage point. However, Google accounts are still drawing the cybercriminals’ attention with malicious users interested in Google’s email service (gmail.com), advertising accounts on the Google AdWords network and Google’s e-payment system, Checkout. The latter draws the most attention from so-called ‘carders’. Carders are scammers who conduct transactions using other peoples’ bank cards or bank card numbers. As Checkout is based on users providing card details, the service has proved attractive to the cybercriminals. As a result, unwary users who send their Google Checkout account data in response to a phishing email risk compromising their account and losing their money.
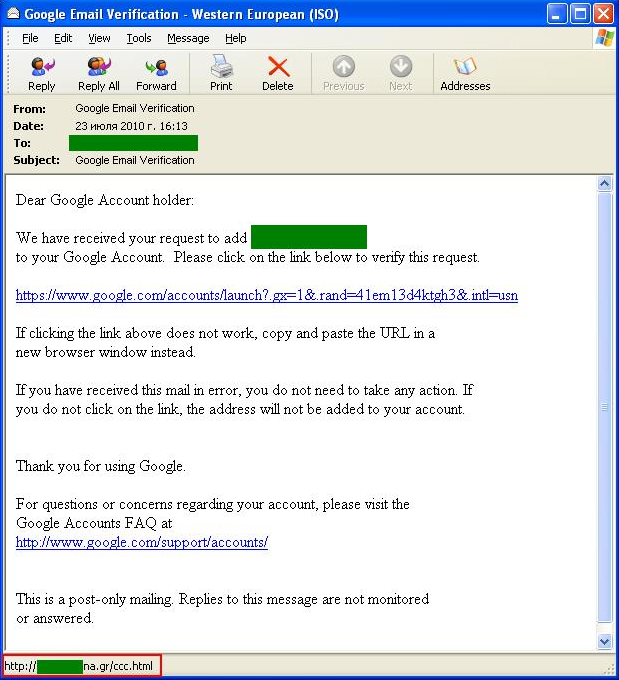
Below is an example of a fairly unusual phishing email targeting Google users.
What makes this phishing email different is that the malicious users did not include the traditional threat of account closure in the communication, nor any request for the user’s password or login information. The email itself basically copies an official notification from Google — with one exception: the link provided in the email does not lead to Google’s official website, but to a phishing page registered on a Greek domain where the user will be asked to enter their username and password.
Malicious email attachments
The percentage of emails with malicious attachments more than doubled in the third quarter of this year, reaching 4.6%, compared with 1.87% in the second quarter. This growth mostly took place in August and September.
In August, the percentage of malicious attachments in email exceeded 6.3%. At the time, spammers clearly did not wait for their clients to return from their summer holidays and simply switched their focus to working with partner programs — including those linked to the spread of malicious programs.
In early September, malicious user activity began to fall. However, in the second half of the month, Kaspersky Lab observed new malicious mass mailings. By the end of the month, 4.33% of all mail traffic contained malicious attachments.
Based on available data, the upswing in malicious mail traffic during late September appeared to be connected to the announcement of the shutdown of the prominent SpamIt partner program which specialized in pharmaceutical spam. Some of the spammers working with this program apparently switched to working with partner programs that send out mailings containing malicious code instead.
The graph below illustrates the ebb and flow of spam containing malicious code over the third quarter of 2010. Of the seven general peaks in activity, only one was observed in July, while the remaining six were spread evenly across August and September.

The percentage of spam with malicious attachments in the third quarter of 2010
The highest peak on the graph occurred on 20 September, with over 4.5% of all emails containing malicious attachments distributed during the quarter being sent on that date.
As a rule, those types of surges occur when virus writers launch a new variant of a common malicious program. Powerful mass mailings are meant to spread as many copies of a new variant in as short a period of time as possible, before antivirus providers are able to add the corresponding signature to their databases.
On 20 September, nearly 90% of all malicious programs received by users via email were detected by Kaspersky Lab using proactive methods, i.e., methods used to detect new malicious programs and new variants of existing threats that have not yet been added to antivirus databases.
Rogue AVs were the prime contributor to the rise in malicious activity on 3, 9 and 19 August. Meanwhile Trojan-Downloader.Win32.FraudLoad.xexa accounted for 66% of all email antivirus responses on 5 August, along with several variants of Trojan-Dropper.Win32.Zbot (ZeuS). Interestingly, email antivirus programs detected mostly new variants of Zbot. A total of 36.5% of all of the malicious programs detected in the third quarter of this year were found in email over the course of a two and a half week period lasting from 2 to 20 August.
Readers may remember that Zbot is a Trojan designed to steal confidential user information and download other malicious programs onto victims’ computers. The information mined in this way is subsequently sold on the black market. One of the latest variants of Trojan-Dropper.Win32.Zbot came in at number six in the Top 10 malicious programs spread via email in the third quarter, appearing most frequently during August.

Top 10 malicious programs detected in email
First place in the third quarter’s Top 10 goes to Trojan-Spy.HTML.Fraud.gen — a regular among the most prevalent malicious programs. Readers may recall this Trojan, which uses spoofing technology and is designed to look like HTML pages. When a user clicks on the relevant link in an email, they are directed to a fake bank or e-payment system website, which then asks for the user’s login credentials. The data that is entered is then forwarded to the cybercriminals. What differentiates this technology from traditional phishing techniques is that the address line in the browser does not show the true web address to which a user will be redirected, but a fake address that looks just like the official website’s address. This technology can fool even the most cautious of users.
Trojan-Downloader.Win32.FraudLoad.hbf, which was very active in late September, and Trojan-Downloader.Win32.FraudLoad.xexa which was mentioned above, took second and fourth places in the Top 10 respectively. The Trojan-Downloader.Win32.FraudLoad family of programs infects computers with a rogue AV program designed to extort money from its victims.
The Packed.Win32.Katusha.o packer took fifth place during the third quarter of 2010. Malicious users often choose this program to pack Zbot, as well as many different rogue AV programs.
The graph below shows email antivirus detection rates for the third quarter of this year according to country:
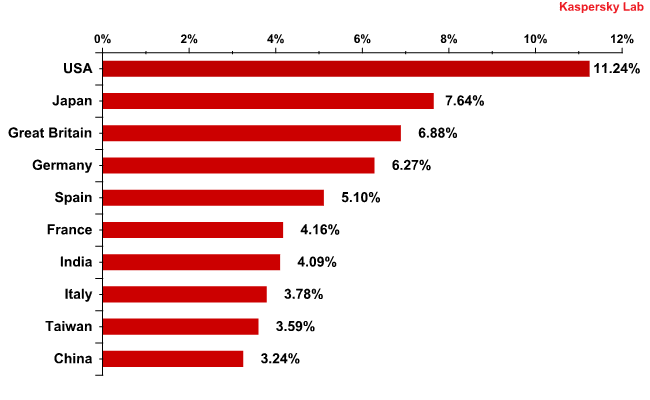
Email antivirus detection rates for different countries
Seven of the ten countries included are developed nations in Europe, Asia and the Americas. The third quarter of 2010 saw the USA take the lead with over 11% of all email antivirus detection activity.
Spammer tricks and techniques
During the third quarter of 2010, spammers frequently distributed emails that closely resembled official notifications from a variety of online resources; this trick was also used in malicious mailings.
The most varied were spam mailings with links to websites infected with JavaScript code from the Trojan-Downloader.JS.Pegel family, which redirects users to a spammer service that downloads Bredolab onto users’ computers. Bredolab then downloads a number of different Trojans, including members of the Zbot family. Meanwhile, the user is redirected to a site advertising medication of various sorts.
This type of spam imitated notifications from such a wide range of legitimate resources that it would be a challenge to find an Internet user who does not have an account with at least one of them. The spam emails were made to look like notifications from Twitter, Facebook, WindowsLive and MySpace, as well as a number of popular online stores such as BestBuy and Zappa, photo hosting sites, prominent banks, e-payment systems and delivery services.
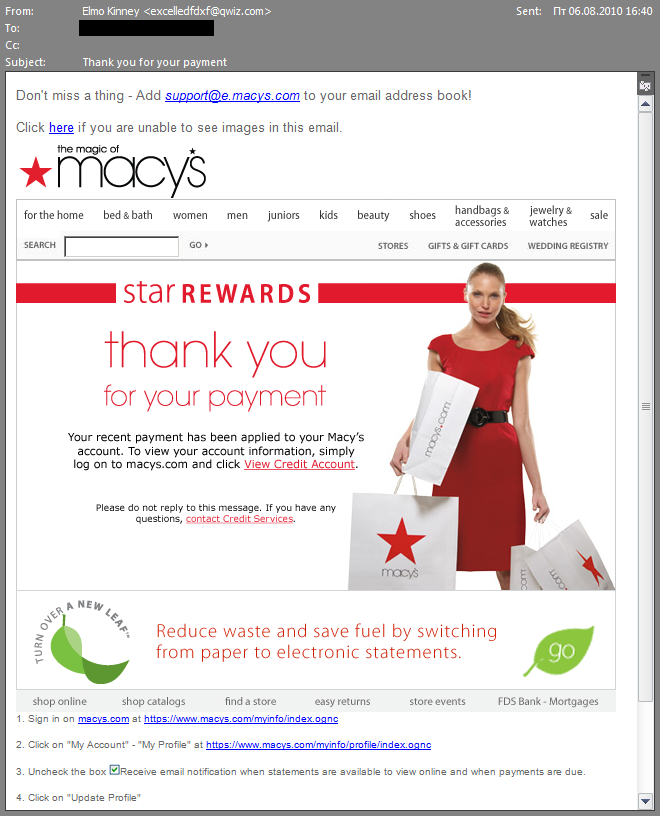
This spam mail resembles an email from Macy’s
The fake notifications were of very high quality:

A spam email that mimics a Twitter notification
In addition to the overall appearance of the email, spammers also copied the technical aspects of the header:

The header details from a typical spam email
As users do not usually see these headers, the obvious assumption must be that these details were copied in order to circumvent spam filters.
In every case, the scheme used to spread the infection was the same. One might assume that these emails were all sent by the same group of people using the same engine, which is backed up by the fact that some email headers were mismatched:
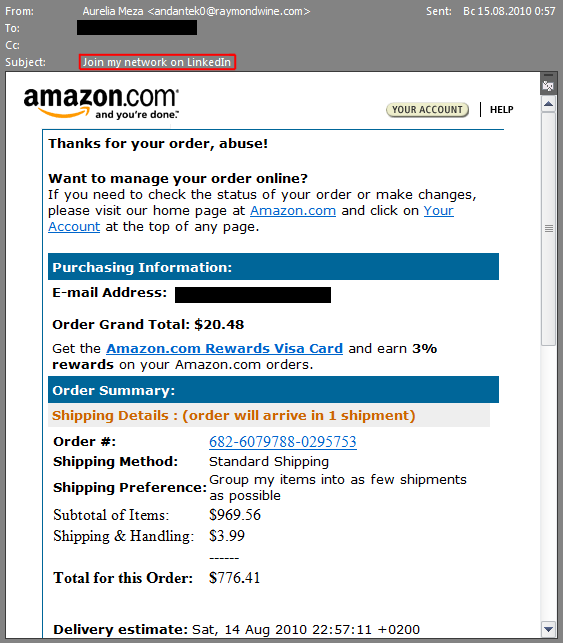
An example of a mismatched header in a spam email
Similar instances of mismatched headers were also noticed in spam emails sent from the same engine advertising medication and fake luxury goods.
In late September, Kaspersky Lab also noticed another rise in the quantity of malicious spam imitating notifications from widely used online resources. This time the cybercriminals’ sights were firmly set on LinkedIn, the prominent professional networking site. Links in fake notifications had subject headers such as “LinkedInUpdate”, “LinkedIn new Messages” and “LinkedIn Alert”. These links led users to compromised websites, or to automatically generated domains within the .info zone. If a user clicked on the link, they were directed to a server controlled by cybercriminals, whereupon a Zbot-family Trojan would be downloaded to the user’s computer.

A spam email made to resemble a notification from LinkedIn
Spam by category

The distribution of spam by category during the third quarter of 2010
Spam advertising medication lost its lead in the first half of 2010, but regained its position ahead of the other categories in the third quarter. This could well be due to the closure of the SpamIt partner program mentioned previously. Promises had been made to shut down the program starting from October, but spammers were determined to maximize their income in the lead-up to the closure. By September, spammers appeared to begin moving to other partner programs, which explains the drop in the volume of medication-themed spam toward the end of the month and the upswing in the amount of malicious programs in email traffic.

The percentage of pharmaceutical spam in the third quarter of 2010
The percentage of spam advertising fake luxury goods, which is typically sent together with advertisements for Viagra, rose from 6.3% to 11%.
The volume of spam in the travel and tourism category fell considerably from the second quarter, slipping from 14% to 4% in the third quarter. In June, this category attained 6.4%, but fell to under 3% in August and September.

The percentage of travel and tourism spam in the third quarter of 2010
The volume of spam in the education category also fell. Overall, this is fairly typical — when the quantity of spam sent via partner programs such as medication and fake luxury goods increases, the percentage of made-to-order spam decreases.

A comparison of the volumes of spam of different
categories for the second and third quarters of 2010
Conclusion
In the third quarter of 2010, just like in the second quarter, we observed strong growth in the amount of malicious attachments in spam. We have been discussing the consistent increase in the criminalization of spam for some time now. Today, we can definitively say that malicious programs are now part and parcel of spam mailings. Malicious emails accounted for 4.6% of all email traffic — the highest figure we have seen since Kaspersky Lab began monitoring email traffic patterns.
The spam industry and the production of malicious programs are becoming more and more aligned. At the same time, technologies such as comprehensive solutions are being developed. Virus writers are creating ever more complex infection methods. Such methods are capable of connecting a victim’s computer to a botnet, sending out spam and downloading a number of Trojans to the victim’s computer in order to steal personal information and other valuable data. The modern spam email may contain a link leading to a promotional website, or to a site containing exploits that may well go unnoticed by the user. For more details on websites with exploits, click here.
Naturally, these trends are worrying — spam is not just an annoyance, it is also a threat.
However, the situation is drawing the attention of legislators and law enforcement agencies. Toward the end of the quarter, nearly 100 people suspected of using ZeuS to steal funds from online accounts were arrested in the UK and the USA. The ZeuS Trojan is detected by Kaspersky Lab as a variant from the Zbot family and is most frequently seen in malicious attachments in spam emails. We continue to hope that this will serve as a starting point for a systemic fight against spam, or at the very least, malicious spam, and for international cooperation in the fight against spam. Meanwhile, we once again reiterate our recommendation not to open any spam emails or their attachments – and never to click on any links in spam emails.








Spam in the Third Quarter of 2010