

Authors
Botnet closures and spam in mail traffic
After the proactive anti-botnet campaign that took place in the second half of 2010, it was especially interesting to monitor the developments that happened in early 2011. As we forecasted, the amount of spam in mail traffic started to gradually increase. However, the average share of unsolicited messages in mail traffic still remains low and has not exceeded 80%.
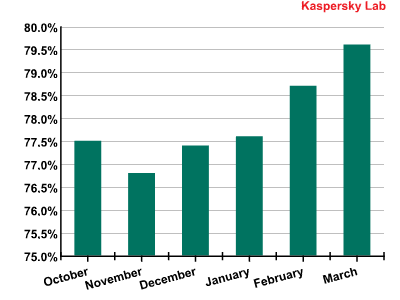
Spam in mail traffic in Q3 2010 and Q1 2011
The amount of spam detected in mail traffic in the first quarter of 2011 averaged 78.6%, an increase of 1.4 percentage points compared with the previous quarter, though still 6.5 percentage points lower than last year’s figure. A low of 60.7% was recorded on 5 January, with a peak of 87.7% on 23 January.
Among the most important events of Q1 2011 was the closure of the Rustock botnet command centers on 16 March. Rustock, one of the leaders in spam distribution, is an old botnet of a very complex design.
However, shutting down Rustock did not impact spam traffic as dramatically as last year’s Pushdo/Cutwail and Bredolab botnet closures: the quantity of spam reduced by 2-3 percentage points for a day or two before bouncing back again. These slight fluctuations did not even impact March’s average figure. According to some, Rustock stopped launching spam attacks at the end of last year. This could be due to the closure of SpamIt, a large pharmaceutical partner program, and the fact that Rustock specialized in pharmaceutical spam, or maybe the botnet was just used for different purposes. It is also probable that the cybercriminals themselves preferred to lie low for a while given law enforcement agency interest in botnets during late 2010. However, they are unlikely to try to restore what they lost and will almost certainly attempt to create a new botnet.
As we can see, the amount of spam continues to grow despite attempts to prevent it; meaning new botnets are appearing to replace the ones that have been closed down. For example, Q1’s Top 10 malicious programs distributed via email includes the Bagle family worm, a program which sends a copy of itself to all of the contacts on an infected computer and downloads malware to the victim machine.
Hot spam topics
As often happens, the spammers did not miss an opportunity to exploit popular events and holidays. For example, they tried to attract users’ attention to their goods and services by reminding them of the upcoming 23 February [Defenders of the Motherland Day, Russia], 8 March [International Women’s Day] and St. Valentine’s Day celebrations. The 2011 Cricket World Cup did not escape cybercriminal attention either: they used this theme to try to defraud unwary users.

A spam email in which a popular theme is exploited
Unfortunately, Q1 was a time of many distressing events worldwide: the overthrow of governments, earthquakes and a major tsunami. Needless to say, the spammers tried to capitalize on these events. For example, they hoped to line their pockets from the disaster in Japan in two ways:
- The sending of emails containing links to allegedly relevant information which in fact led to malicious sites;

- Tricking users into parting with their money by purporting to be part of the Red Cross’ relief effort.


An attentive user would notice that the fraudsters’ messages apparently came from the Red Cross email system (@redcross.org in the From field) while the replies had to be sent to free email system addresses. It is almost certain that the Red Cross would never ask anybody to transfer money via Western Union.
Sources of spam by country
In the first quarter of 2011, the quantities of spam originating from the leading spam-producing countries were fairly similar; with none of them exceeding 10% of the total volume of spam.

Sources of spam in Q1 of 2011
India topped the list of the 20 most popular sources of spam: it became a Top 5 member in 2009 and since that time its contribution to the total volume of spam worldwide has grown constantly. It easily replaced the USA’s former No. 1 position after the latter slipped down the table. Russia and Brazil, which in the previous quarter occupied 2nd and 6th places respectively, came 2nd and 3rd in Q1 of 2011. Brazil’s share also grew throughout the quarter and accounted for 6.62% of March’s total spam volume globally.
The USA, which dropped to 20th position in the previous quarter after the closure of a number of botnet command centers, is now steadily climbing back up this rating. In the first quarter of 2011, 2.97% of all spam came from the USA, taking it up to 11th place in the Top 20. It’s almost certain that the USA will continue its climb up the ranking in the coming months. This is also confirmed by the fact that in March the USA came 2nd in the rating of countries where malware was detected most frequently in mail traffic: after the closure of the Pushdo/Cutwail, Bredolab and Rustock botnets, the cybercriminals are hard at work creating new botnets and extending existing ones.
Sources of spam by region
The first quarter of 2011 differs little from the fourth quarter of 2010: the leaders remained the same. However, there are some changes.


Sources of spam by region
In Q1 2011, the Asian share of the total volume of spam worldwide grew slightly. Previously, we classified this region as including Asia, the Pacific Islands and the Middle East. Now however, the contribution from this region is so significant that we have decided to subdivide it into three different geographical areas: Asia, the Middle East and the Pacific Islands. The total volume of spam distributed from these regions reached 36.39% in the first quarter of 2011.
Latin America also increased its contribution by 3.85 percentage points, while the amount of spam originating from eastern and western Europe fell by 5.64 and 2.36 percentage points respectively. We forecasted that this would happen based on the relocation of botnets to those countries where measures against cybercrime are either ineffective or are not yet taken very seriously at the state level.
Africa is among the regions where the fight against cybercrime is virtually non-existent. We did not consider Africa as a separate region earlier because the amount of spam distributed from this region did not exceed 1% of the total volume. However, in Q1 of 2011 the volume of unsolicited messages coming from African countries accounted for 3.66% of the worldwide spam total, exceeding that of the USA and Canada. Poor anti-spam legislation and a lack of IT competence provide ideal conditions for further increasing the volume of spam being distributed from this region.
Size of spam emails
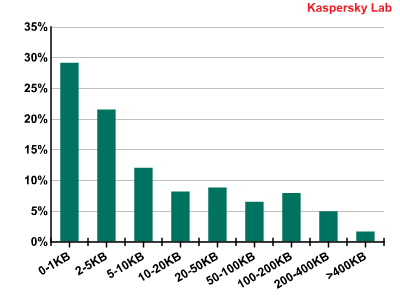
Spam emails by size in Q1 of 2011
Emails below 5 KB in size continued to dominate spam traffic, with nearly 30% of all unsolicited messages being smaller than 1 KB in size. Generally, these messages contain a short advertising phrase and a link to a site.
Notably, emails above 50 KB in size were also popular: their share accounted for 20.73% of all spam. These were mostly messages containing different attachments with which spammers hoped to bypass anti-spam filters.
Malware in mail traffic
In Q1 of 2011, the average percentage of emails with malicious attachments increased by nearly 0.5 percentage points, reaching 3.05%. The graph below illustrates the distribution of spam containing malicious code by month over the first quarter of 2011.
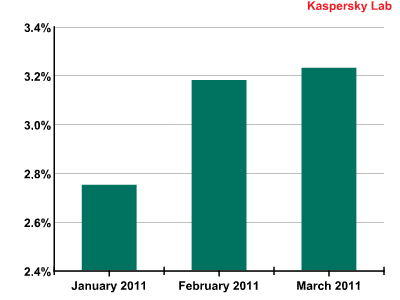
The percentage of spam with malicious attachments in the first quarter of 2011
Email antivirus detection rates for different countries in the first quarter of 2011 looked like this:

Email antivirus detection rates for different countries in the first quarter of 2011
As can be seen from the graph, Russia took the lead with 13% of all email antivirus detection activity. The USA came 2nd with 10.44%, followed by Vietnam on 6.96% and India with 5.99%.
It’s worth mentioning that all of the aforementioned countries changed their positions throughout the quarter. The graph below shows that in January, malicious attachments were most frequently found in mail traffic received in Vietnam and India. However, in February the amount of malware detected in mail traffic in these countries decreased considerably. In March, Vietnam’s figure remained unchanged compared to that of February’s, while India’s share continued to decrease.

Email antivirus detection activity in the first quarter of 2011
The amount of malicious spam sent to the USA saw considerable growth in February and continued to increase in March. Users in Italy and the UK also received more malicious spam though this was less pronounced.
These changes were most probably caused by the botnet owners attempting to restore their networks in the USA and some European countries. Meanwhile, their interest in Asian countries is gradually declining: given the amount of spam originating from Asian countries, botnets located in these regions already include a considerable number of machines. Additionally, this region is unattractive to fraudsters as a target for attacks designed to steal personal and financial data.
In the first quarter of 2011, Trojan-Spy.HTML.Fraud.gen maintained its leading position in the Top 10 list of malicious programs distributed via mail traffic. This Trojan uses spoofing technology and appears in the form of an HTML page. It comes with a phishing email containing a link to a fake site resembling that of a well-known bank or e-pay system where the user is asked to enter a login and a password. More details about this program can be found here.

The Top 10 malicious programs distributed via mail traffic in November 2010
The most notable type of malicious program to appear in the Top 10 and spread via email was the mail worm. The main purpose of malware programs such as this is to harvest email addresses and spread themselves via mail traffic, typical examples being: Email-Worm.Win32.Mydoom.m and Email-Worm.Win32.NetSky.q. The Email-Worm.Win32.Agent.gnd and Email-Worm.Win32.Bagle.gt worms’ functionality is more sophisticated than the aforementioned worms. These two not only collect email addresses and distribute themselves via mail traffic, but also install other malicious programs once they have penetrated a victim computer. Interestingly, Email-Worm.Win32.Agent.gnd mostly installs Trojan downloaders that immediately try to gain access to Internet resources in order to download other malware, while Email-Worm.Win32.Bagle.gt downloads malicious programs itself from Internet resources.
In addition to the aforementioned malicious programs, the first quarter’s Top 10 also included Trojan-Spy.Win32.SpyEyes.fpv., a malicious spyware program that steals confidential data from users. Programs from this family were especially popular in March, though malicious attacks containing them started in February. More than half of March’s Top 10 malicious programs distributed via mail traffic belonged to the Trojan-Downloader.Win32.Deliver family. This type of program is classified as a Trojan downloader that installs new versions of malicious programs on victim computers without the users’ knowledge.
Phishing
In the first quarter of 2011 the volume of phishing emails was very small and accounted for only 0.03% of all mail traffic.
Interestingly, the share of phishing emails as a percentage of the total volume of mail traffic remained practically unchanged throughout the whole quarter. In the first two months it remained at around 0.03%, while in March it decreased slightly and averaged 0.02%.
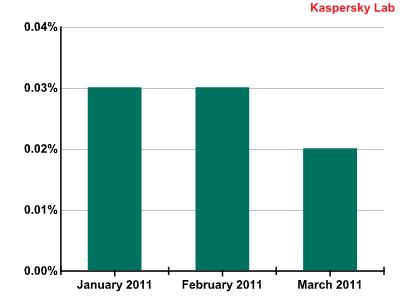
The percentage of phishing emails in mail traffic during the first quarter of 2011
In the first quarter of 2011, PayPal and eBay continued to hold a solid lead among the organizations most frequently targeted by phishers, with Facebook falling to fourth place and HSBC dropping to fifth.

The Top 10 organizations targeted by phishers during the first quarter of 2011
Social networking site Habbo just crept ahead of Facebook to take 3rd position in terms of popularity with the spammers.
World of Warcraft used to be one of the most popular targets for phishers, but dropped to 7th place in the first quarter of 2011, making way for the banks Chase and Santander.
Notably, Google, which was in 5th position at the end of 2010 with 2.5%, dropped out of the rating in the first quarter of 2011 as services such as Google AdWords and Google Checkout were attacked much less often. This time the phishers switched their attentions to the highly popular Brazilian social network Orkut which is owned by Google. The attacks on this social network reached 1.96% of the total, putting it in 12th place in the list of organizations most often targeted by phishers. The figures show that the total volume of attacks on Orkut and other Google services averaged 3.03% of all phishing attacks during the first quarter of 2011. It is worth mentioning that user accounts belonging to Google’s services, including Orkut, are interconnected. Thus, having acquired credentials for one of these accounts, a cybercriminal can access any Google services registered to the same user.
Spammer tricks and techniques
In Q1 of 2011, spammers used both tried and trusted, and new tricks and techniques to bypass filtering and to attract the attention of users.
Sending out spam emails containing a link to a video clip was one such trick. There was just a link without any related text in the message which led users to a video clip advertising spammer services. Apparently, spammers decided to play on the curiosity of users – a link with no subsequent explanation is highly likely to be opened by unwary recipients.

A spam email containing a link to an advertisement for spammer services
This technique was used back in 2009, but there was a difference: two years ago the video clips were located on YouTube.com, while in 2011 the spammers preferred its Russian analogue, RuTube.ru. However, the aforementioned advertizing trick was a complete failure both in 2009 and at the beginning of 2011 because the number of links to the video clips was small and they were easily detected by anti-spam filters.
One innovative spammer tactic designed to evade the filters involved the sending of emails purportedly from users indignant at having received spam.

A spam email purportedly from a user angry at having received spam
Previously we discussed fake ‘Out of the office’ auto-replies containing a link to spammers’ sites. Now the fraudsters are imitating users’ replies. It is not immediately obvious that an email which reads “Stop sending me spam” is in fact itself spam and that the link inside it leads to a spammer’s site.
Fake notifications from notorious web resources such as Twitter, Facebook and Amazon, etc. remained fairly popular with the spammers.

A fake notification from a popular web resource
The links in such emails can lead to an advertising site as well as download malware to a victim computer.
Spam by category on the Russian Internet
In Q1 of 2011, the majority of spam emails advertised different seminars and training sessions. The Medication and Health-Related Goods and Services category came 2nd followed by the E-Advertising Services category.
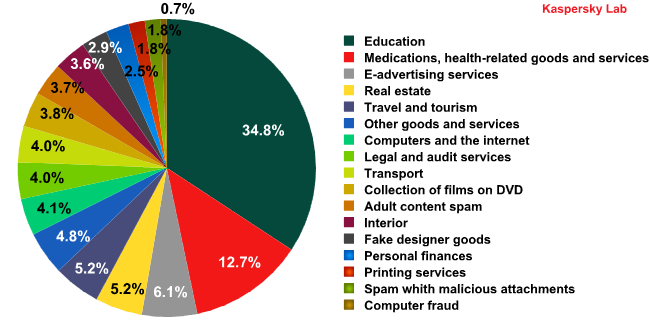
Spam by category in the first quarter of 2011
Notably, in January 2011 the two leading categories – Education, and Medication and Health-Related Goods and Services – were neck and neck; however, in March the amount of emails in the Education category exceeded those in the Medication category eightfold. Huge scale ‘educational’ spam mailings saw emails being sent to millions of addresses and ending up in the same inbox many times over.
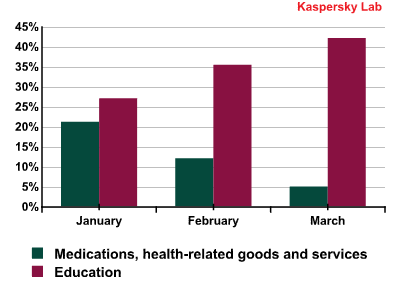
The Education, and Medication and Health-Related Goods and Services categories in the first quarter of 2011
The Education category is considered to be ‘spam-to-order’, i.e. a client actively seeks assistance from the spammers and pays for their services. The Medication category is typical of ‘partner spam’ in which spammers organize mass mailings and receive a percentage in cash from the goods sold. In the fourth quarter of last year, the amount of ‘partner spam’ began to decrease while the volume of ‘ordered spam’ began to grow. This reallocation was primarily due to the closure of botnet command centers such as Pushdo/Cutwail and Bredolab and the shutdown of the SpamIt partner program. The fact that this trend continued into the first quarter of 2011 may be the result of the closure of the Rustock command centers.
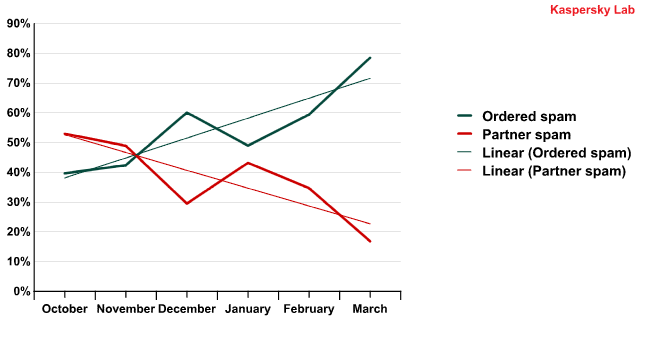
Ordered and partner spam from October 2010 to March 2011
As can be seen from the graph, the aforementioned trend was only broken in January, which is to be expected: during long holidays nobody orders advertising as it does not bring in much money, while ‘partner spam’ is sent anyway, though in smaller volumes. The overall quantity of spam in mail traffic at the beginning of the year was about five times lower than usual.
Speaking about spam categories, in Q1 of 2011 there were many emails that did not follow the usual format for spam: in the run-up to the supposed 2012 doomsday scenario, spammers are offering users the opportunity to learn how to time travel and the chance to buy an ark. They also reminded users that bribe-taking and corruption were unacceptable.

A spam email that departed from the usual format sent during the first quarter of 2011
Many people do actually believe that 21 December, 2012 will be the last day of human civilization. This may affect the content of some mass mailings. If we are already finding emails exploiting the doomsday theme today, it will be interesting to see how many of them appear closer to the ‘event’.
Conclusion
The amount of spam in mail traffic after last year’s botnet command center closures has not yet returned to its previous levels although it has increased noticeably. It is almost certain to exceed 80% in the next quarter, if of course another targeted strike on the botnets by law enforcement agencies does not occur first. The closure of the Rustock botnet command centers could have made a dent in the statistics during the first quarter of 2011, but it seems the cybercriminals had either prepared for such an event in advance or were very quick to respond to the situation – thus the closure of the command centers did not seriously affect the total volume of spam.
As far as sources of spam are concerned, our forecasts regarding the relocation of botnets to those regions with ineffective anti-spam legislation and low levels of IT competence have proved correct. The contribution made by Asia and Latin America to the total volume of spam worldwide increased, while Europe’s share reduced. We predict that in future the cybercriminals will locate their botnets relatively evenly across both less and better protected regions, just as they are now.
The volume of malicious attachments in mail traffic continues to remain as high as it was last year. The situation will remain largely unchanged until new botnets appear to replace the ones that were closed down: spam has long since been criminalized and it is amazing that such huge volumes of malware should only start emerging last year.
In the first quarter of 2011, spammers preferred to revert to tried and trusted techniques. They distributed video-related spam and tried to imitate users’ emails. Video-related spam was not and will not be successful while fake user messages and personal correspondence remain popular with the spammers. It is highly probable that we will see a change of tactic in the next quarter.
Once again, we advise all users to keep their eyes open and to check the authenticity of emails before opening any attachments or clicking on any links.
From the same authors


In the same category


Spam in the First Quarter of 2011