
Authors
Report of Kaspersky Lab, 2018-2019
Today’s children navigate the Internet better than adults. They are not afraid to try out new technology, and are quick to grasp new trends and sometimes invent their own. New social networks, mobile games, music, and gadgets are all part and parcel of their daily lives. But just because they feel at home online does not mean that they need not pay attention to potential hazards. To help children avoid potential dangers in the digital world, parents must understand what their children are interested in, know about the latest online trends, and be aware of what might pose a risk.
How statistics are collected
Kaspersky Lab solutions scan the content of web pages that children try to access. If a particular site belongs to one of fourteen unwanted categories, the module sends a notification to the Kaspersky Security Network (there is no transfer of personal user data and no violation of privacy). There are two important things to note about this:
- Parents decide for themselves what content should be blocked and configure the application accordingly. However, anonymous statistics are collected across all fourteen categories.
- Data is harvested only from computers running Windows and Mac OS; no mobile statistics are provided in this report.
Website categorization
In products that have Parental Control features, web filtering is currently performed across the following categories:
- Internet Communication Media (Social Networks, Messengers, Chat Rooms, Message Boards)
- Adult Content
- Alcohol, Tobacco, Drugs
- Violence
- Weapons, Explosives, Pyrotechnics
- Profanity
- Gambling, Lotteries, Sweepstakes
- Video Games
- Electronic Commerce
- Software, Audio, Video
- HTTP Query Redirection
- Job Search
- Religions, Religious Associations
- News Media
Filtering search queries
Children’s search activity is the best indicator of their interests. Kaspersky Safe Kids can filter children’s queries in five different search engines (Bing, Google, Mail.ru, Yahoo!, Yandex) on six potentially dangerous topics: Adult Content, Alcohol, Tobacco, Drugs, Racism, and Profanity.
We have grouped the search queries by language. We consider statistics for the English language as international due to its prevalence. All searches in a specific language, minus repeat queries, were taken as the 100% reference value. The popularity of each topic – defined as the percentage of queries about it – is calculated for each separate language and for the entire world.
Search queries sent to us during the period May 2018 – May 2019 were broken down into several thematic categories:
- Alcohol, Tobacco, Drugs
- Anime
- News
- Memes
- Celebrities
- Sports
- Education
- Music
- Online Communication
- Shopping
- Online Translators
- Adult Content
- Video Games
- Video
Global picture
Site categories
Over the past year, the global picture has changed quite radically.
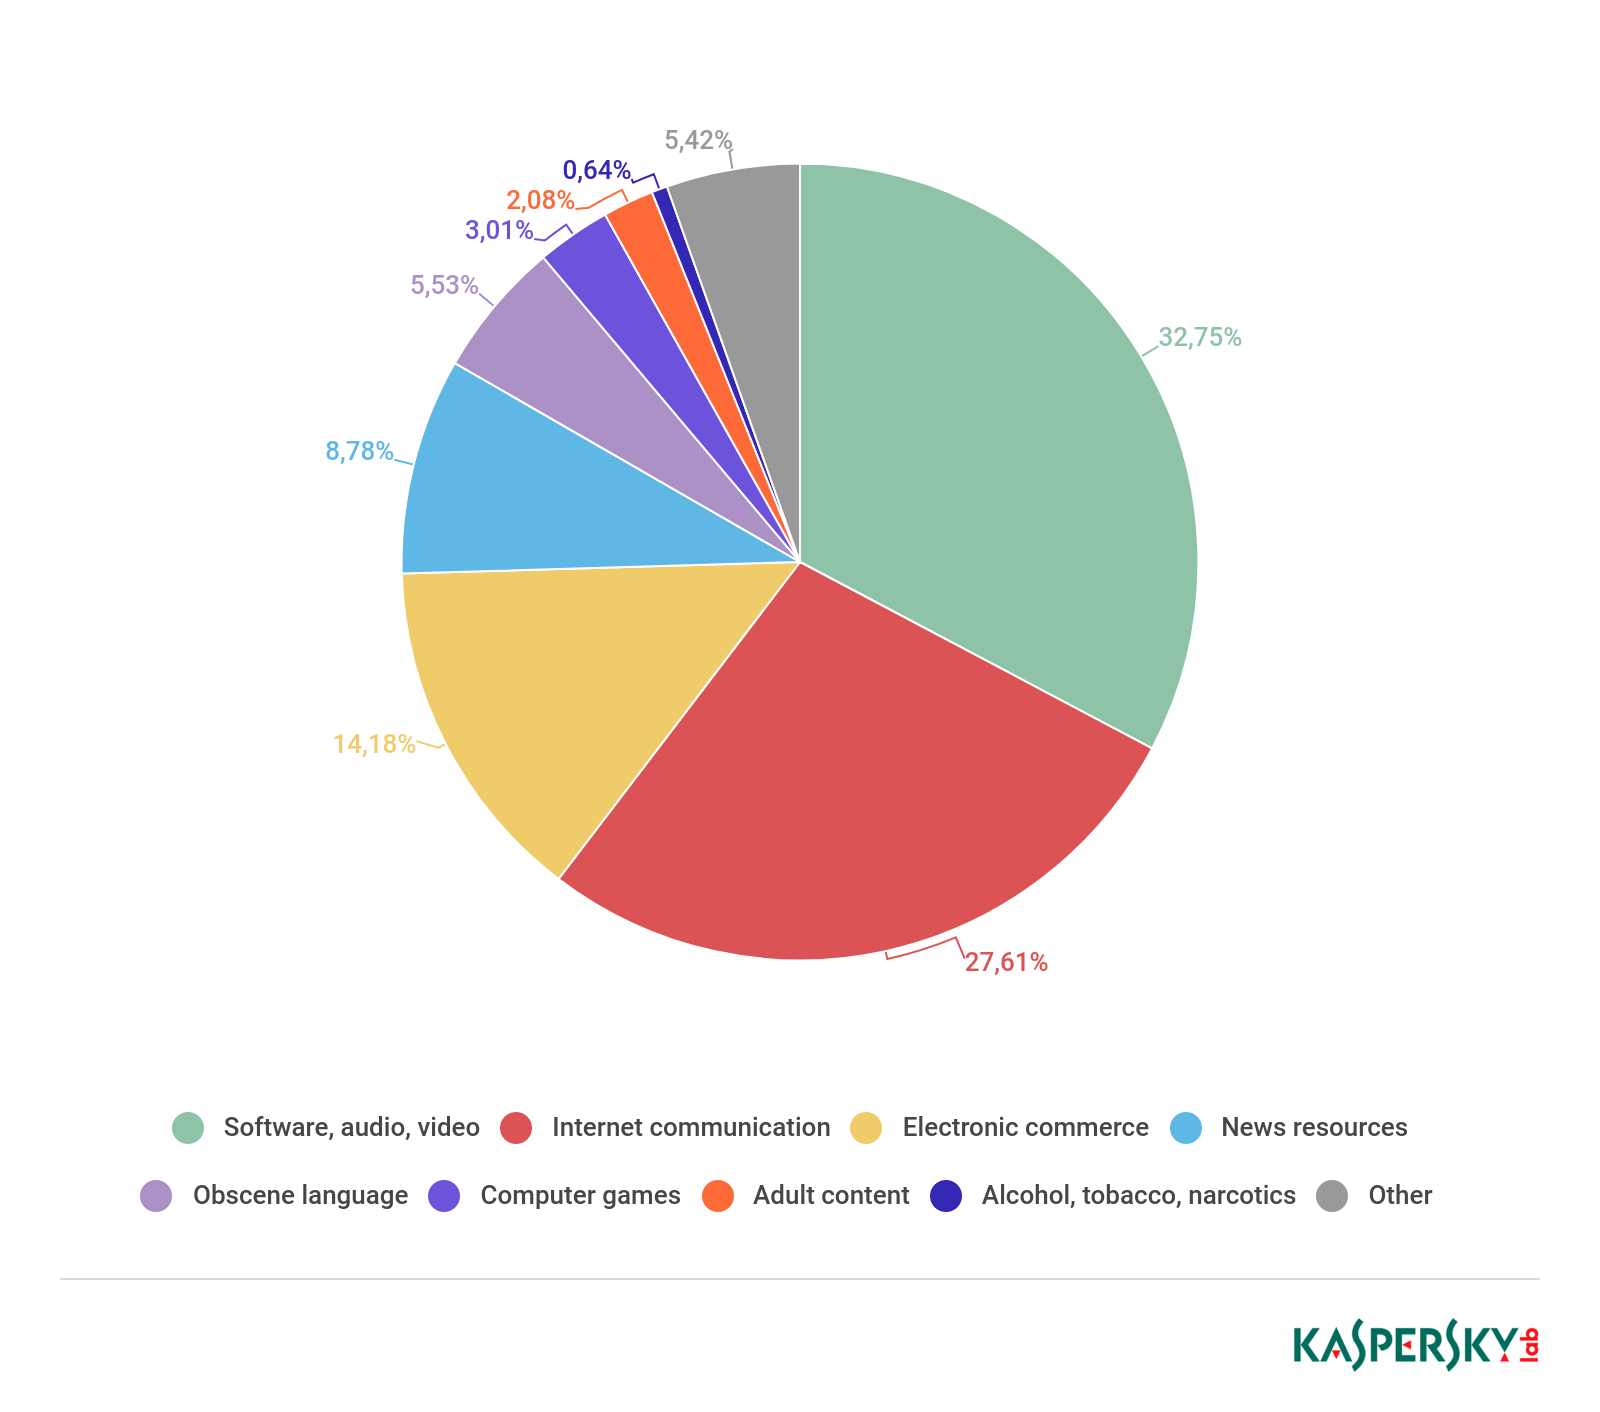
Distribution of Parental Control and Safe Kids notifications across fourteen categories, May 2018 – May 2019
A few years ago, we noted a downward trend in the number of visits from PCs to sites in the Online Communication category, and this is continuing. Whereas last year, the share of this category was 59.68%, this year has seen a sharp drop, to 27.61%. At the same time, the share of the Software, Audio, Video category rose to 32.75% against 22.4% last year.
Electronic Commerce ranks third; compared with the data for 2017-2018, the popularity of online stores among children increased dramatically, from 2.83% to 14.18%. Children have started accessing news resources more frequently: Last year, this category accounted for slightly less than one percent, while this year’s figure stands at 8.78%.
The share of computer game-related sites was 3.01%, which is 1.98 p.p. lower than in the previous reporting period. Meanwhile, the share of adult content sites climbed to 2.08%, which is up 1.34 percentage points on last year (0.74%). The share of sites in the Alcohol, Tobacco, Drugs category collapsed, amounting to 0.64% (6.32% in the last reporting period).
Search queries
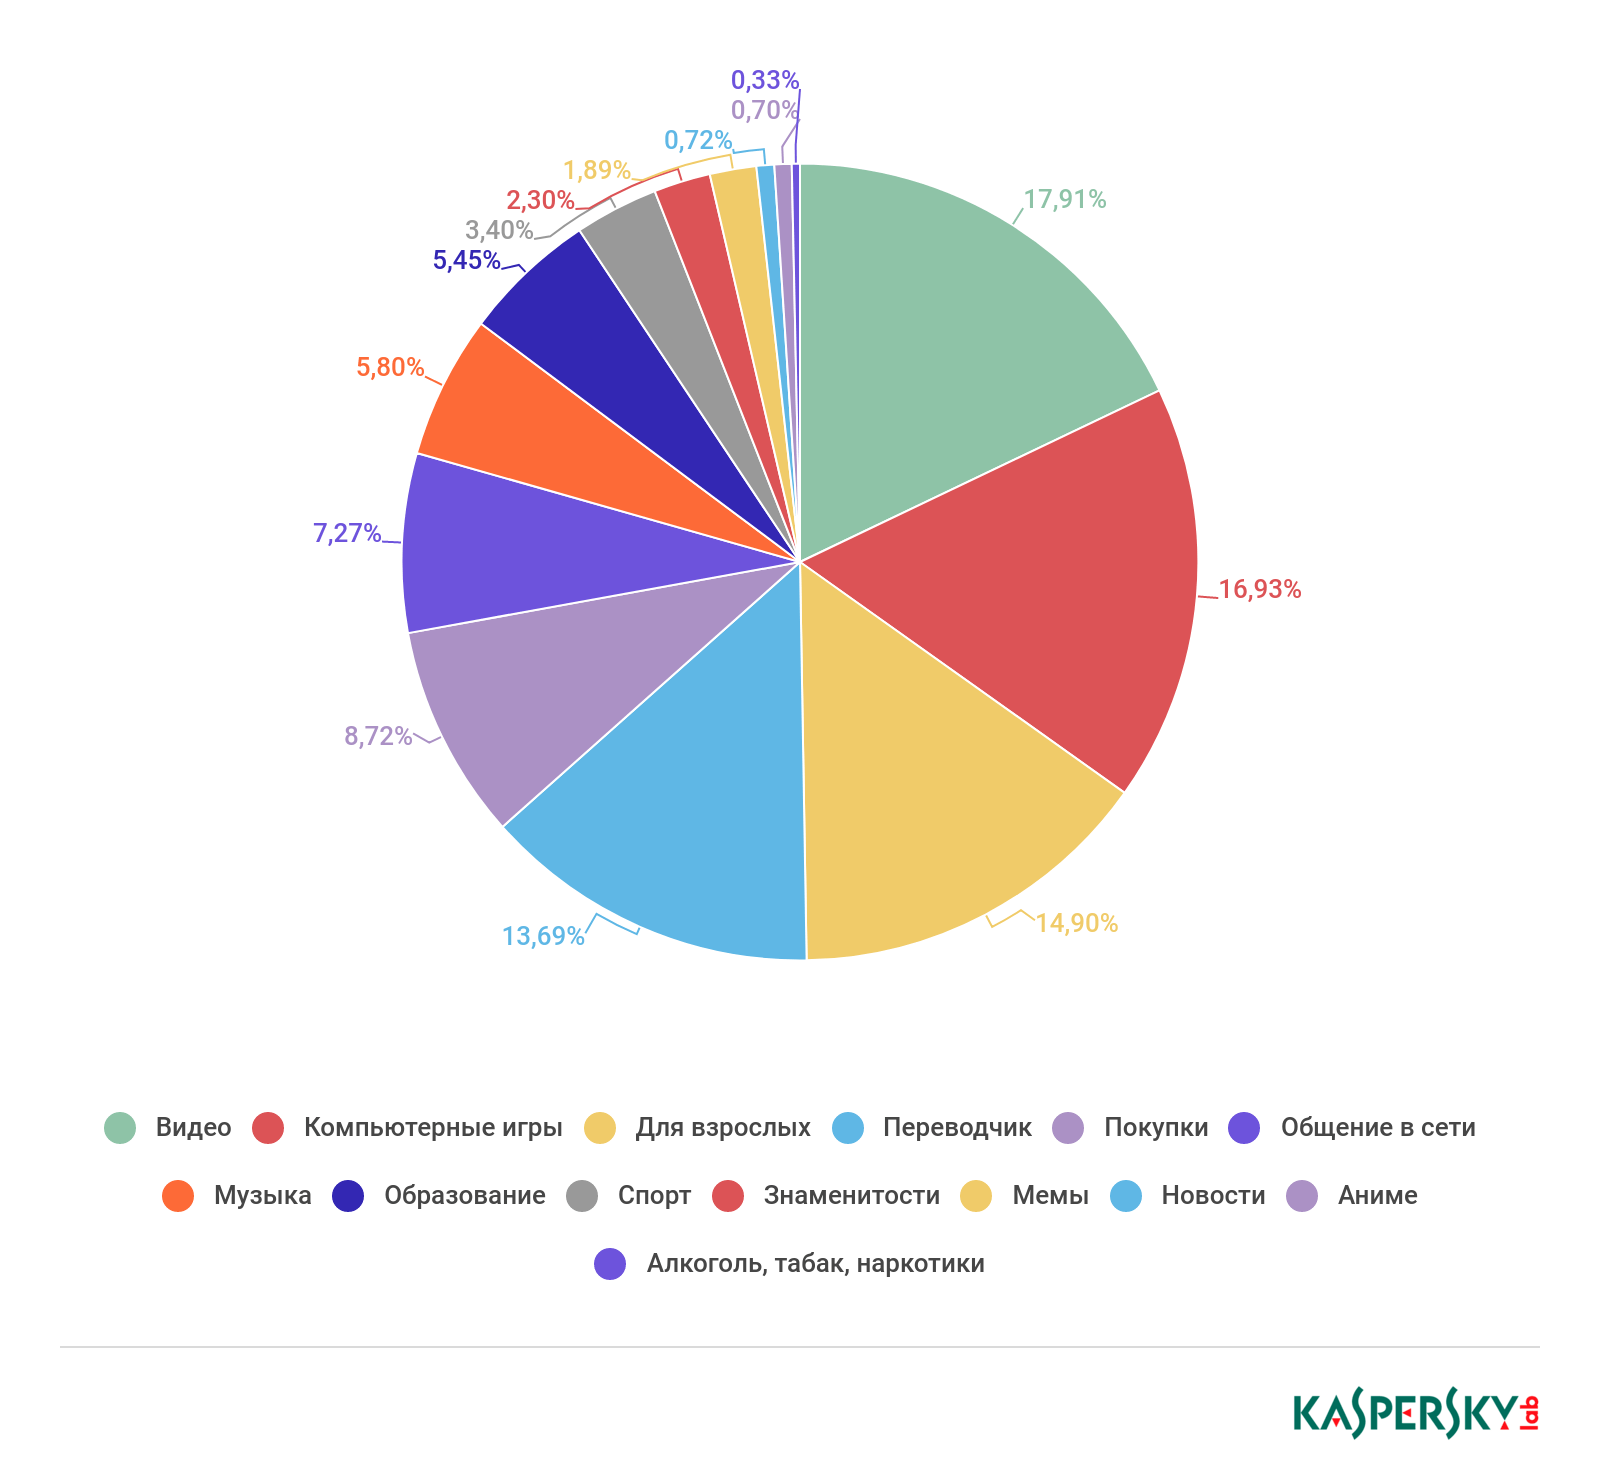
Distribution of users’ search queries by thematic category, May 2018 – May 2019
Children most commonly search for movies and cartoons on YouTube. Compared to last year, the share of search queries related to video content remained practically the same at 17.91% (17.25% in 2017-2018).
Although children visited gaming sites less frequently, they have not lost interest in the topic; the share of game-related search queries actually increased by 10.84 percentage points to 16.93%. Interest also rose in adult content (from 8.59% to 14.90%) and online shopping (from 2.4% to 8.72%). Meanwhile, interest in online translators remains at the same level as last year: 13.69% in 2018-2019 against 13.58% in the previous reporting period.
The number of queries related to social networks and online communication fell by a couple of percentage points, from 9.88% to 7.27%. This year, children searched more often for music (5.80% in 2018-2019 vs. 3.78% in 2017-2018) and topics related to education (5.45% vs. 4.86%), but there was a decline in the number of searches for anime (from 0.79% to 0.70%) and sports (from 3.69% to 3.40%).
Differences by region, country, and language
To understand the reasons behind the changes, we shall examine each of the popular categories in more detail, and take a look at the changes in different regions and countries.
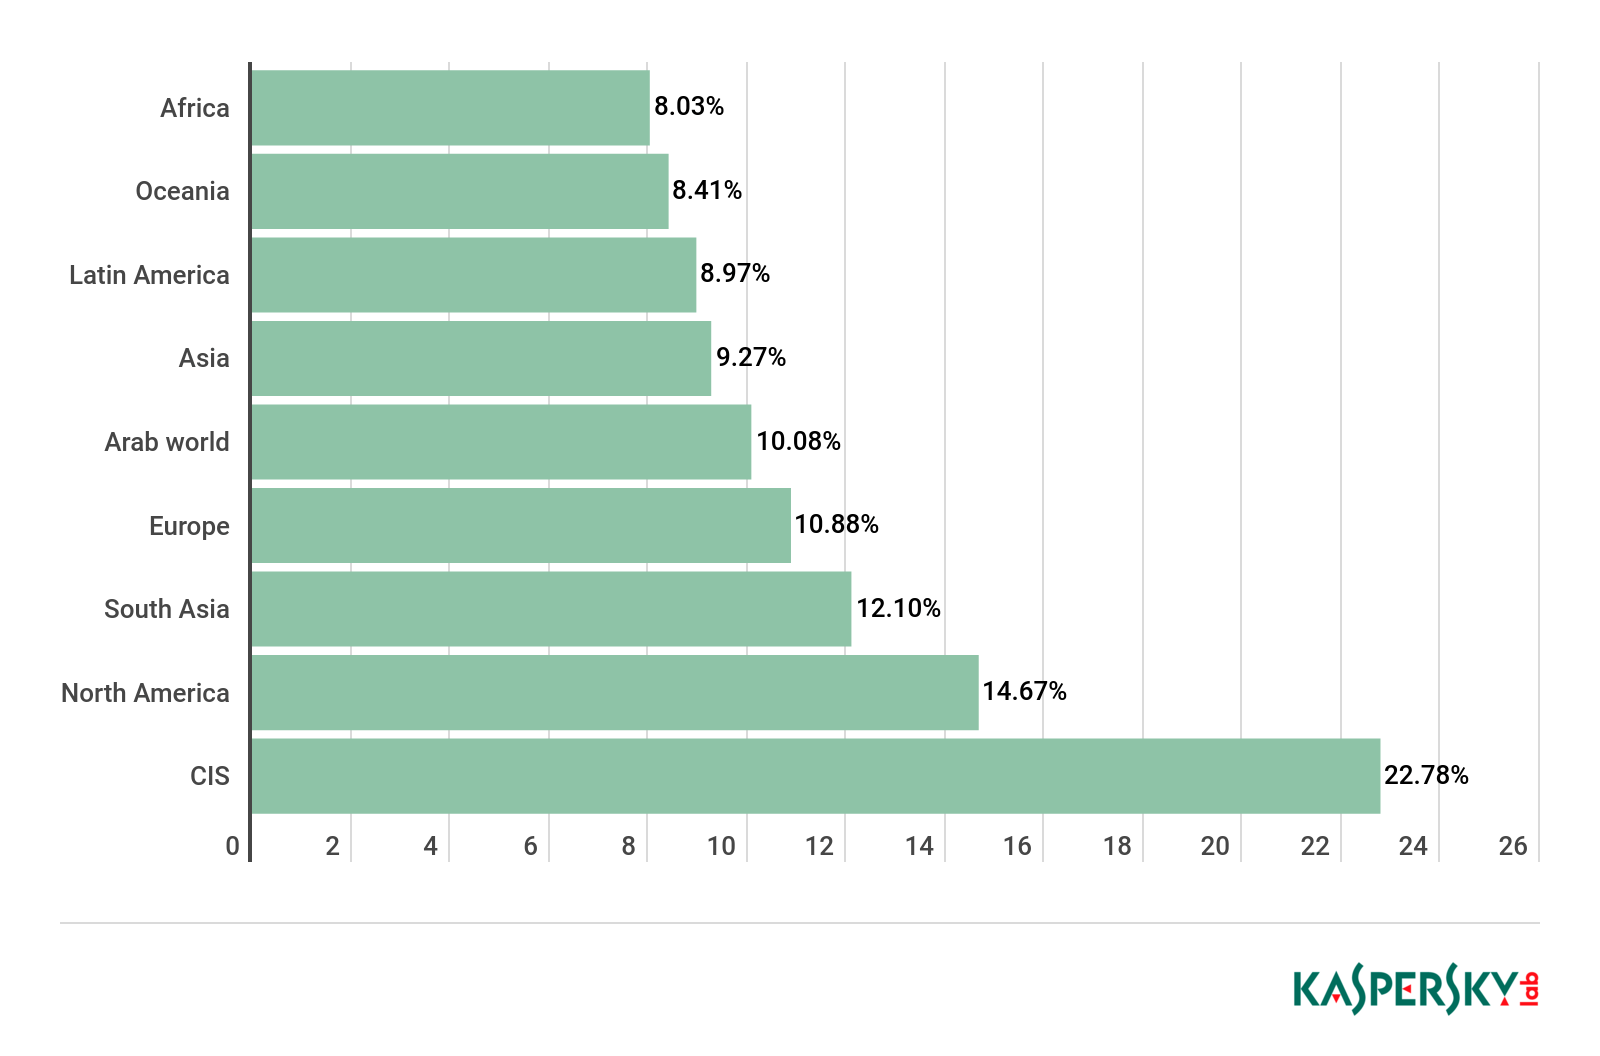
Software, Audio, Video
Most often, children visited sites – and searched for information – relating to the Software, Audio, Video category.

Popularity of the Software, Audio, Video category in different regions, May 2018 – May 2019
Children in Africa more than anywhere else visit sites from this category. Their favorites include youtube.com, dvdvideosoft.com, dropbox.com, and play.google.com.
We see a rise in interest in this category in all regions with the exception of the Commonwealth of Independent States (CIS), where a slight drop occurred. This was the first year that we included the regions of Africa and South Asia in the statistics, so a comparison with the previous year is not possible.
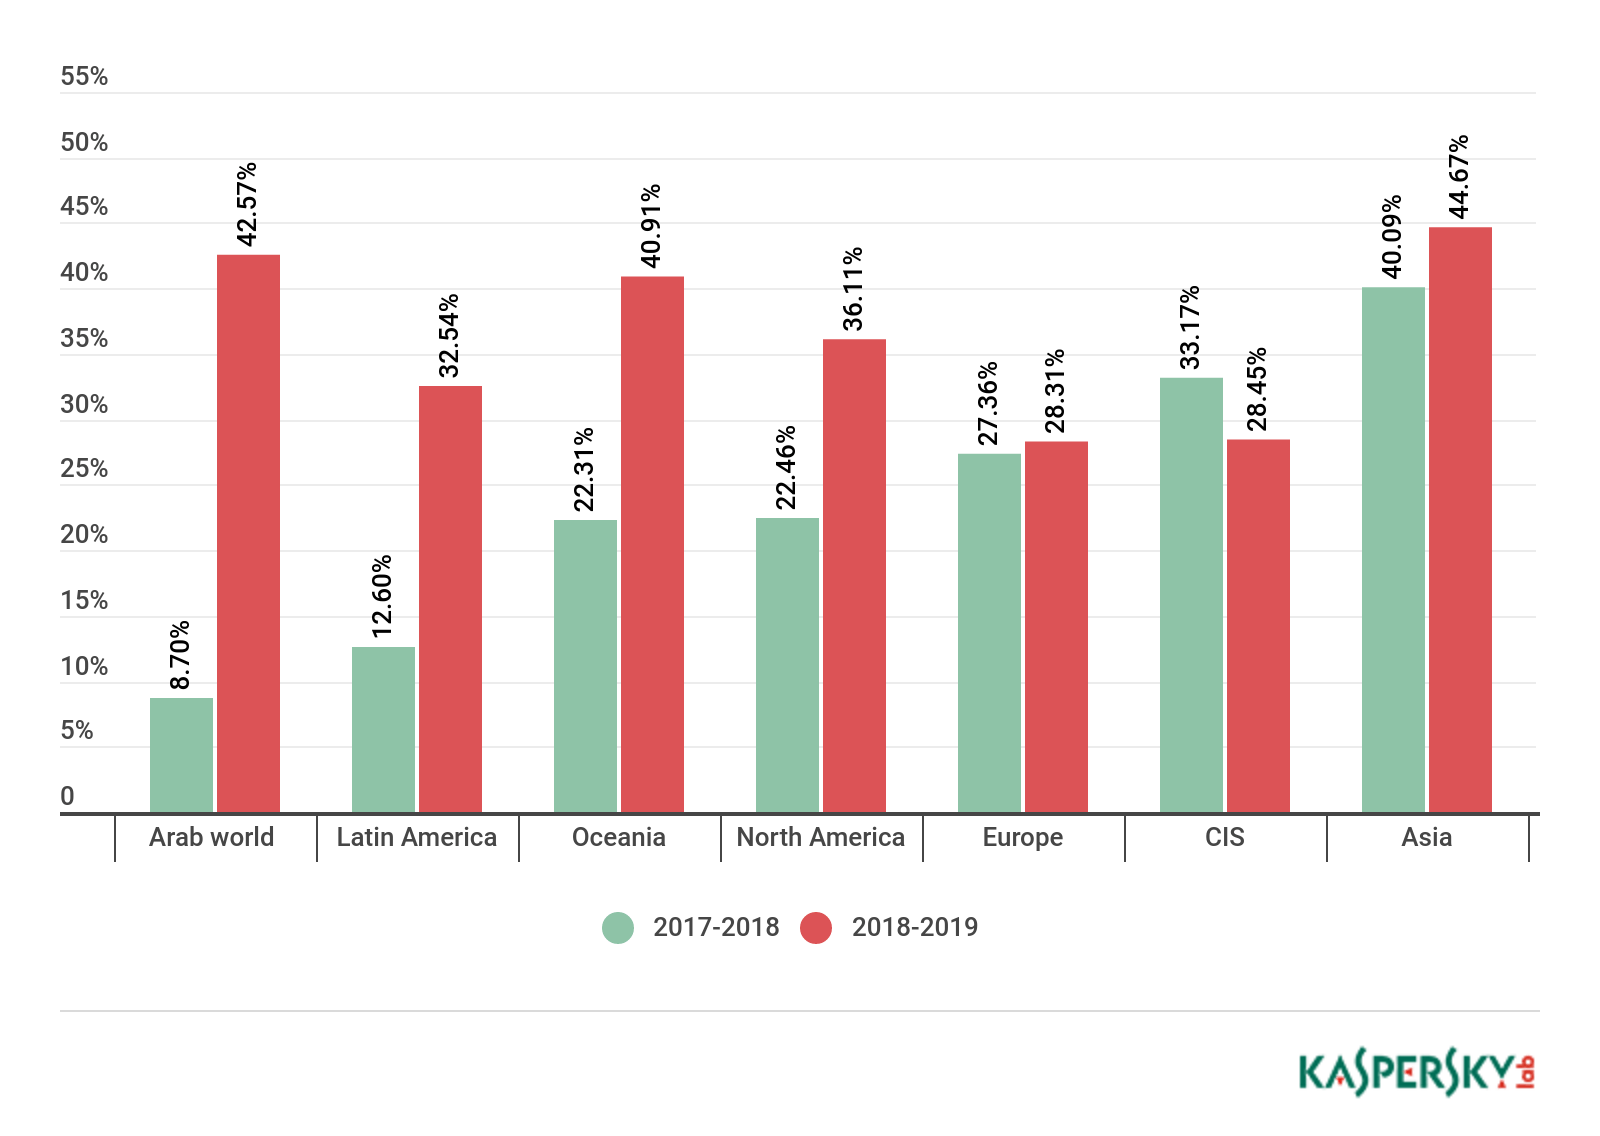
Comparison of the popularity of the Software, Audio, Video category in different regions, May 2017 – May 2018 and May 2018 – May 2019
The largest growth in visits to sites with video, music, and software was observed in Arab countries: Their share of the total number of visited resources grew significantly from 8.70% to 42.57%. The most visited resources in this region are youtube.com, dvdvideosoft.com, play.google.com, and uptv.ir.
There was a marked increase in Latin America, too, from 12.60% to 32.54%. The most visited sites in this region are, of course, youtube.com along with play.google.com, dvdvideosoft.com, and spotify.com.

Popularity of the Software, Audio, Video category in different countries, May 2017 – May 2018
Kids in China spend more time than others watching videos and listening to music (69.36%). Last year, China also beat all other countries in this respect, but with a larger figure (78.76%).
Since this time, we expanded the list of countries, some of last year’s frontrunners, such as Germany and Russia, are now closer to the foot of the ranking, although their share of visits did not change all that much: Germany (34.05%) saw a 2.09 p.p. swing and Russia, (28.23%) 4.95 p.p.
In some countries, children’s time spent on listening to music and watching videos shot up. The figure grew exponentially in Saudi Arabia (from 0.38% to 51.34%), which could be related to the launch of Spotify in the region, Egypt (from 11.03% to 40.28%), Mexico (from 10.65% to 42.37%), the UAE (from 9.17% to 23.29%), and Brazil (from 13.53% to 27.44%). In all these countries, the most popular site in this category is youtube.com.

Distribution of search queries on the Video topic in different languages, May 2018 – May 2019
As we have seen, the top topic in search queries around the world is video, which generally corresponds to the map of visited sites, where for the first time ever Software, Audio, Video has dislodged Online Communication as the leading category.
In the English language, the percentage of video-related search queries increased against last year from 20.54% to 28.35%. The most common searches were for “youtube,” “netflix,” and “amazon prime.” As in previous years, the most searched-for blogger is PewDiePie. The top cartoon channels are Nickelodeon, Disney, and Cartoon Network. There was also heightened interest in Game of Thrones.

The Video category’s share of searches among Chinese-speaking children this time around came to 21.12% (4.21% in the last reporting period). In Chinese, children searched for 愛奇藝 (iQiyi, the Chinese online video platform) and 復仇者聯盟4 (Avengers: Endgame).
Note that search queries in English reflect the interests not just of English-speaking children, but of all kids in general, since children worldwide often search for platforms, services, games, and social networks by their English names. In particular, the most popular site, as well as the most popular search query among children, is YouTube.
The graph below shows the percentage of YouTube-related search queries in different languages, with all other queries on the video topic (cartoons, movies, TV shows). In English, for example, 70.58% of all queries on the video topic are linked to YouTube. Only in China are children not interested in this video platform, since the service is blocked there.
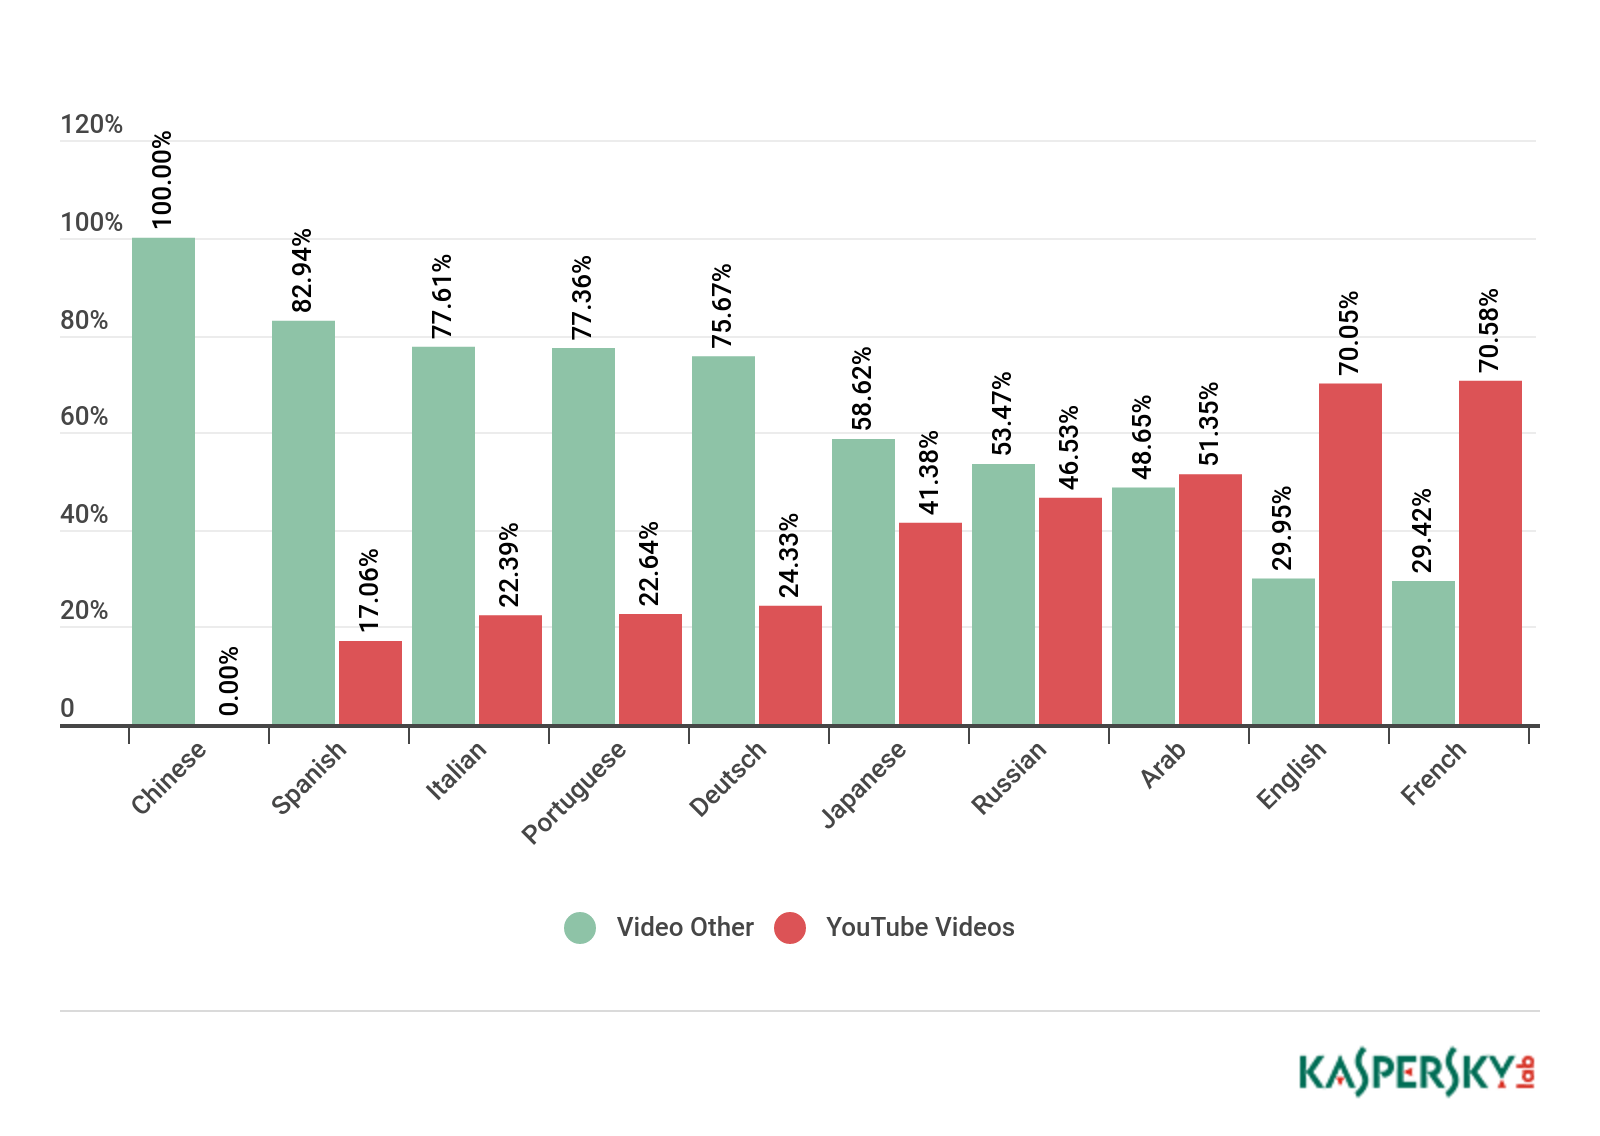
Comparison of the popularity of YouTube-related queries, and other searches on the video topic, May 2018 – May 2019
Another search topic in the Software, Audio, Video category is music. Compared to last year, children searched more often for songs, performers, and music videos. The sharpest hike in music-related queries came in the Japanese language, rising from 0.50% last year to 20.64% this year. This could be because Asian performers are wildly popular these days across the world, in particular the South Korean boy and girl bands BTS and BLACKPINK, and the Japanese virtual singer Hatsune Miku.
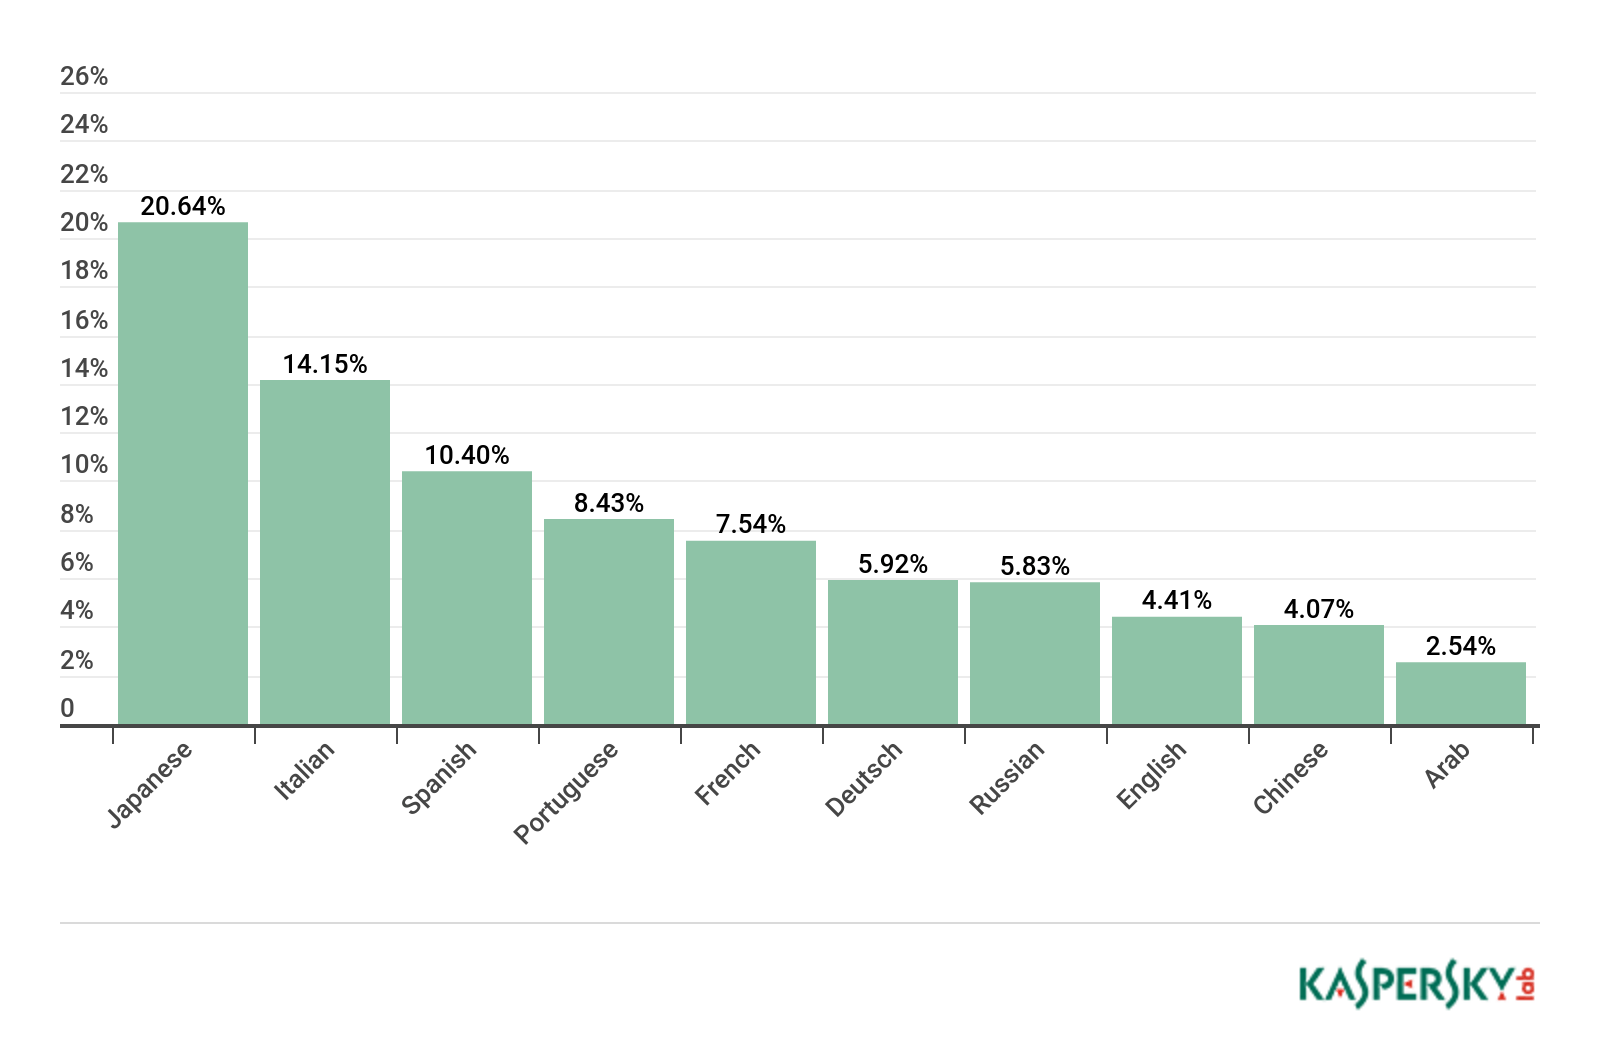
Distribution of thematic search queries on the music topic by language, May 2018 – May 2019
Besides music from Asia, children searched in English for the streaming service Spotify, singer Ariana Grande, rapper xxxtentacion (we wrote about him here), performer Marshmello, and singer Billie Eilish.

Online Communication
Each of our reports in recent years has noted a downward trend in children’s use of social networking sites and instant messengers on PCs. And now the day has come when the usual leader Online Communication has given way to video and music as the top category.

Popularity of the Internet Communication Media category in different regions, May 2018 – May 2019
Nevertheless, in our report’s new region, South Asia, children still communicate a lot online using desktops and laptops. In all other regions, we noticed a sharp drop in the number of visits. Facebook remains the most popular site in this category in practically all countries, with the exception of China.

Such a sharp drop in popularity can be put down to the craze among children and teenagers for the “mobile” social network TikTok (we wrote about it on our Kids Kaspersky portal, dedicated to keeping children safe). The steep decline could also be caused by the trend we have long observed for children to increasingly favor mobile over PC-based communication.

Comparison of the popularity of websites in the Internet Communication Media category in different regions, May 2017 – May 2018 and May 2018 – May 2019
Interestingly, as with the Software, Audio, Video category, the largest difference between the reporting periods is seen in Arab and Latin American countries.

Popularity of websites in the Internet Communication Media category in different countries, May 2018 – May 2019
The country-specific data also shows a decline in visits to sites in the Online Communication category. This could be due to various factors, including the scandals around Facebook and VKontakte over the confidentiality of user data, as well as with the growing popularity of “mobile” social networks, such as Instagram, SnapChat, and TikTok.

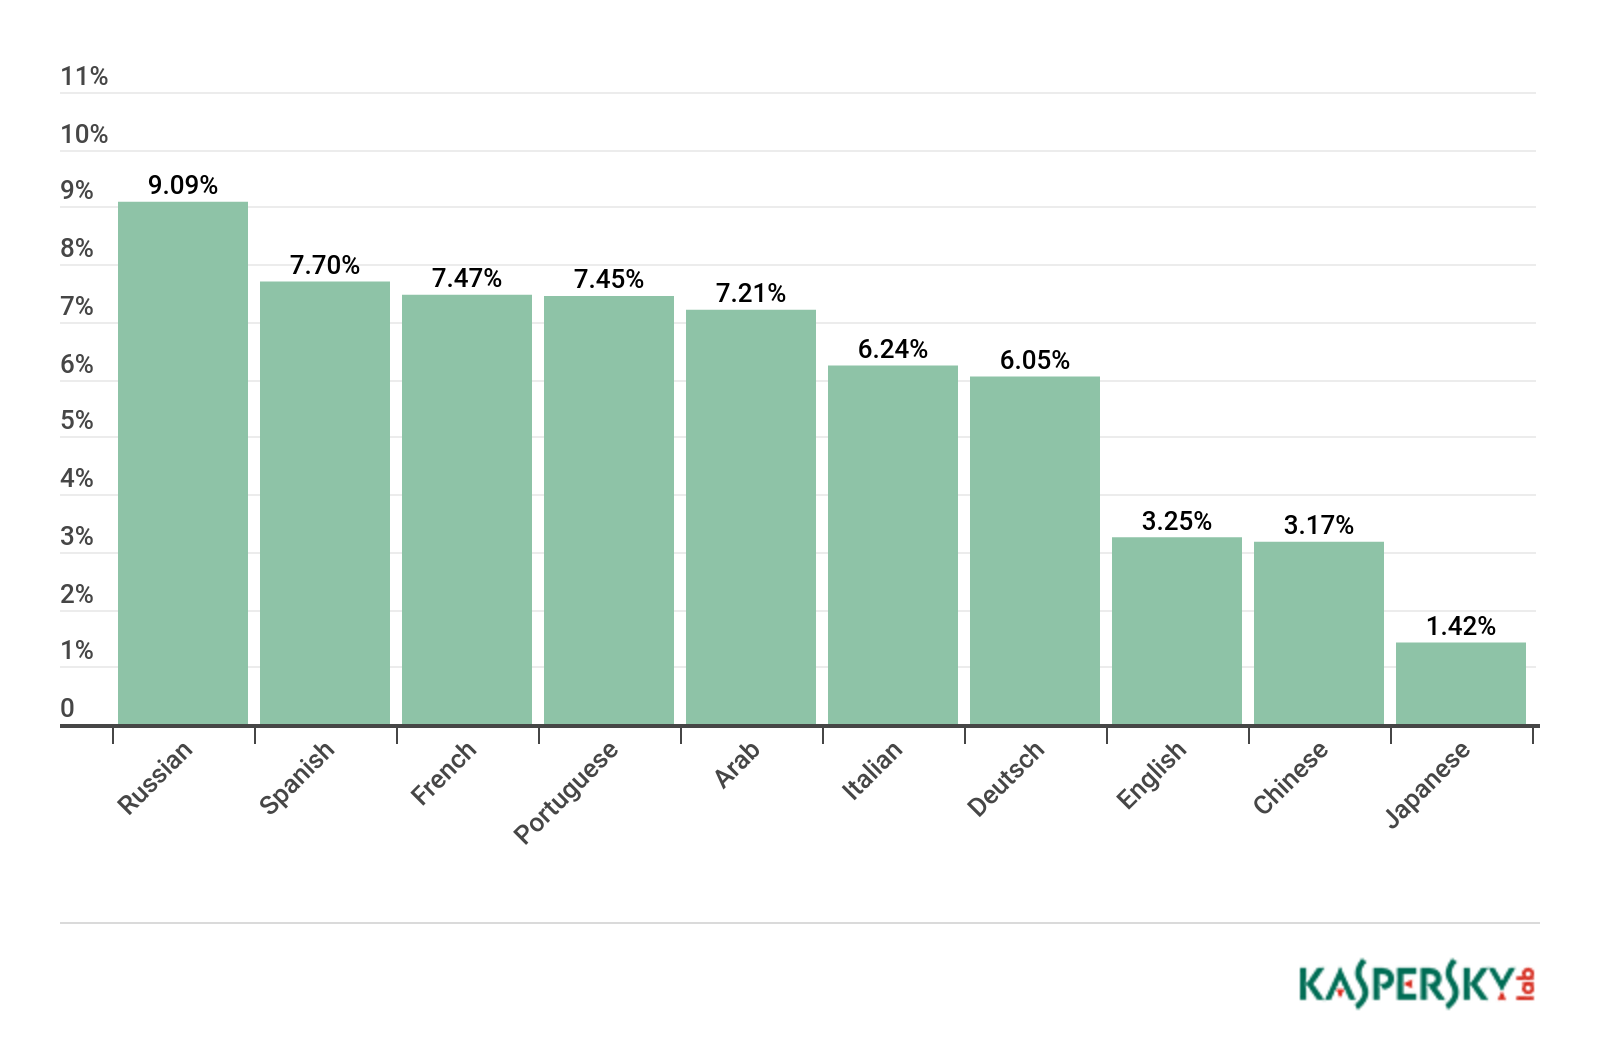
Distribution of search queries on the social networks topic in different languages, May 2018 – May 2019
As for search queries, Russian-speaking children most often searched for “ВК” (VK), “инстаграм” (instagram), and “скайп” (skype). Popular search queries in English were “facebook,” “instagram,” and “tiktok.” In Japanese, the most common searches were for stickers for the messenger Line. And in Arabic, they were for تويتر (Twitter) and Facebook.
Note that the share of search queries related to online communication decreased in most languages, as did visitor traffic to sites in this category. Their share in English decreased by 3.6 p.p. to 6.72%, and in Russian by 4.35 p.p. to 9.11% against the previous reporting period.
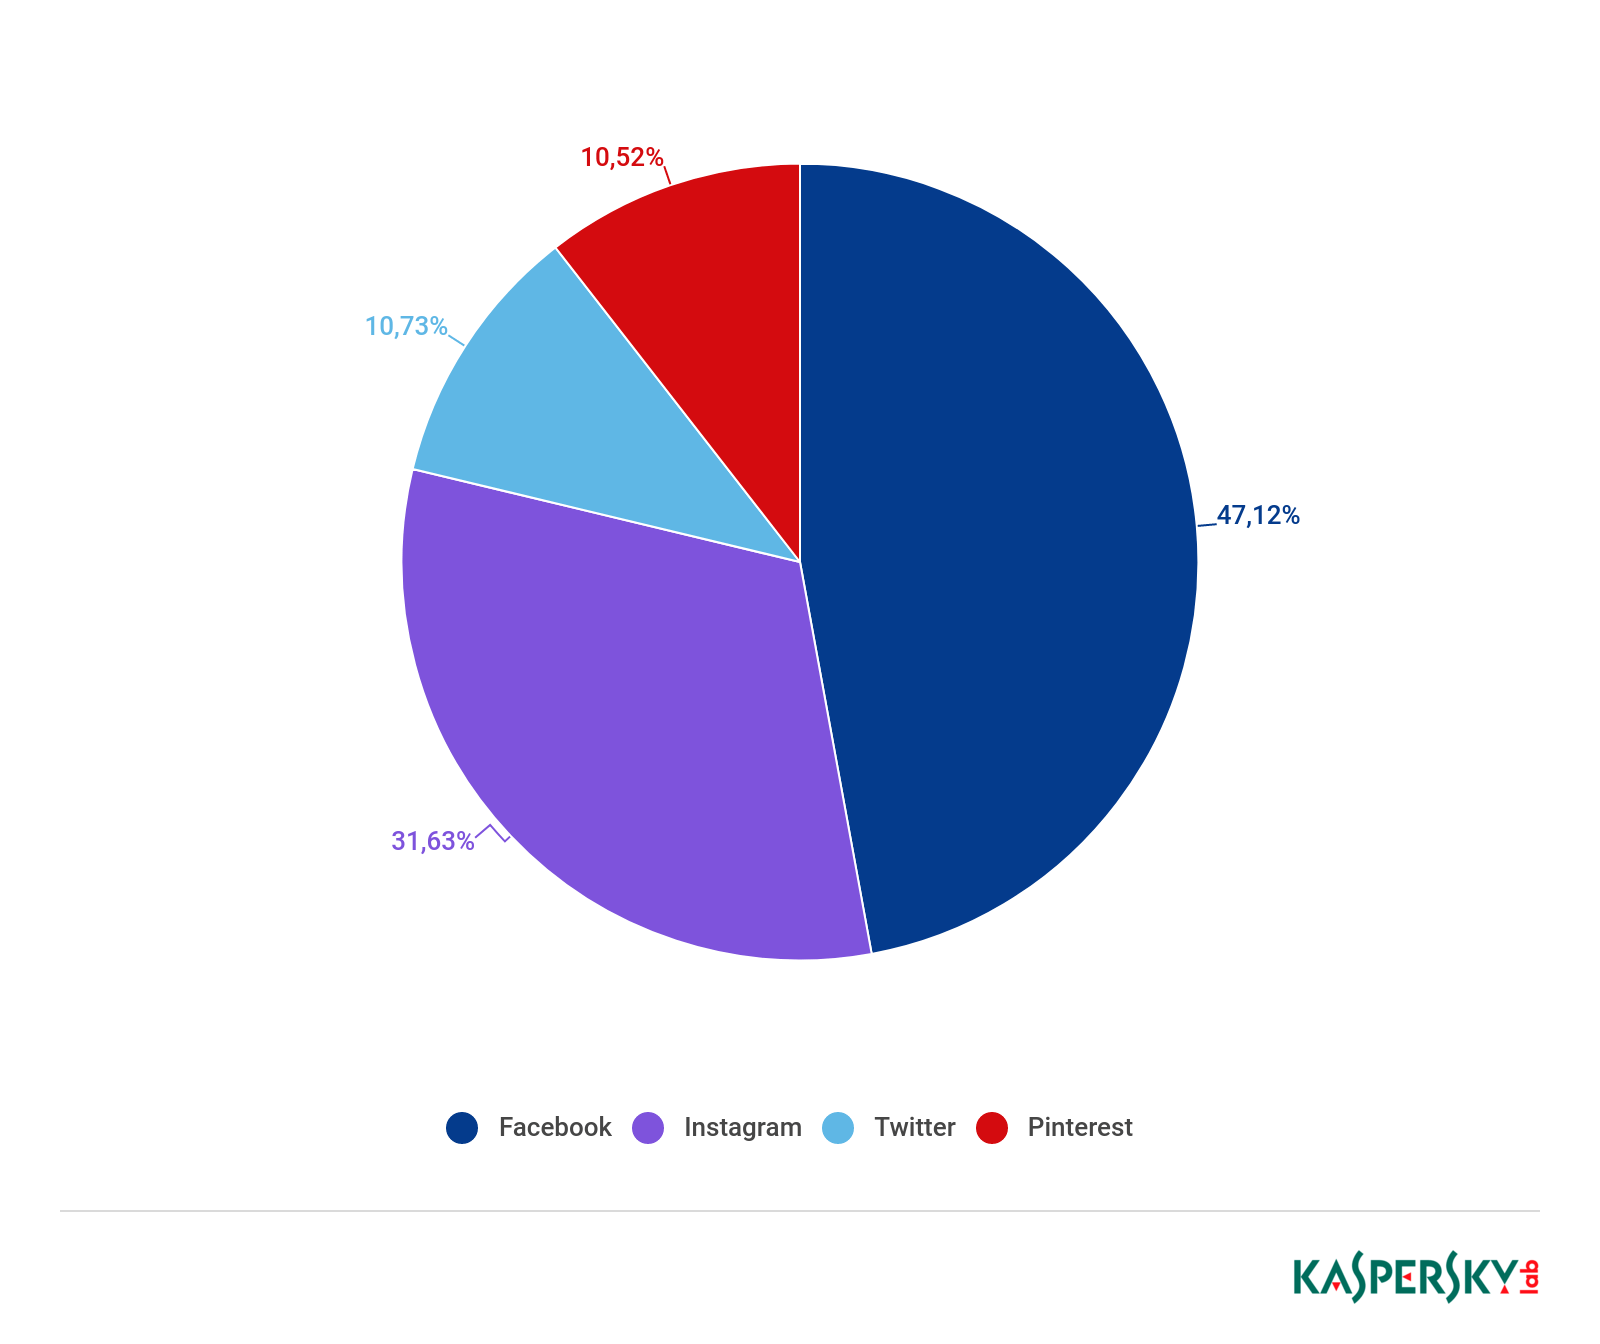
Distribution of search queries related to one of the four most popular social networks, May 2018 – May 2019
Electronic Commerce
Popularity of websites in the Electronic Commerce category in different regions, May 2018 – May 2019
Another category of resources more popular this year than last is Electronic Commerce. The most popular sites are Aliexpress, Amazon, and eBay. Children’s interest in the online store Aliexpress is growing year on year. This report has already noted the upward trend in the popularity of services of Chinese origin; for example, the social network TikTok belongs to the Chinese Internet company ByteDance.

Comparison of the popularity of websites in the Electronic Commerce category in different regions, May 2017 – May 2018 and May 2018 – May 2019
The most significant rise in the popularity of online stores over the past year came in CIS countries. The Top 3 sites by number of visits are Avito, Aliexpress, and Wildberries.

Popularity of websites in the Electronic Commerce category in different countries, May 2018 – May 2019
The country-specific data confirms that children in Belarus and Russia show most interest in online shopping.

Distribution of search queries on the online shopping topic in different languages, May 2018 – May 2019
What exactly children were looking for is revealed in the search queries. In Japanese, the most frequent searches were for products from the Rakuten store and the Japanese version of Amazon, as well as candy from the 7-Eleven store. The most popular stores in German were Zalando, Saturn, eBay Kleinanzeigen, and Tiger; in English, Amazon, eBay, Aliexpress, Ikea, and Asos; and in Russian, Aliexpress, Авито (Avito), Юлу (Yulu), and Детский мир (Children’s World).
As for brands, in this reporting period children searched for Nike, Adidas, Samsung, Gucci, Vans, Supreme, Zara, and Bershka. Product-wise, the younger generation showed interest in the iPhone X, iPhone 7, Huawei p20, Samsung S7, Nike and Adidas footwear, and various books.
Video Games
Compared to last year, the share of this category decreased almost threefold. This does not mean that children are losing interest in games, since some of the content they watch on YouTube is devoted specifically to games, including walkthroughs, analysis, and reviews.

Share of websites in the Video Games category in different regions, May 2018 – May 2019
Not for the first year, the region with the largest gaming category share is Oceania. And this year we saw growth: from 11.03% to 13.63%. The most popular gaming sites in Oceania are roblox.com, blizzard.com, steamcommunity.com, ubisoft.com, and ea.com.
In North America, the share of visits to gaming sites from PCs dropped from 13.05% to 7.70%. The most popular sites in this region are roblox.com, blizzard.com, and twitch.tv.

Comparison of the popularity of websites in the Video Games category in different regions, May 2017 – May 2018 and May 2018 – May 2019
The share of this category decreased in other regions, too. For instance, it fell from 10.02% to 4.19% in Europe, from 3.96% to 1.24% in Latin America, and from 3.03% to 2.81% in the CIS. In others, meanwhile, it increased: from 1.49% to 2.04% in the Arab world, and from 2.93% to 4.71% in Asia.

Popularity of websites in the Video Games category in different countries, May 2018 – May 2019
In the diagram, we see that in Australia (part of the Oceania region) the Video Games category has a greater share than in other countries (12.74%). It is followed by Germany (10.59%), which last year came mid-table, but this time ousted the UK (8.21%) from second place.
But the share of this category is still on a downward trend. This is likely due to the increased popularity of mobile games, which now attract children more than PC games. Overall, the mobile games market is growing year on year.
That said, PC games are still popular, although many of them have been adapted to mobile platforms and consoles. One example is Minecraft, which, judging by kids’ search queries, is still in high demand.

Distribution of search queries on the Video Games topic in different languages, May 2018 – May 2019
Unsurprisingly, the lion’s share of game-related search queries are in English, since most games have English-language titles. The most popular queries in English this past year were: fortnite, roblox, minecraft, epic games (the publisher of Fortnite), steam, twitch, discord, overwatch, and pubg.
It is worth noting that many of the top search queries in English were related to Fortnite, for example: fortnite tracker, fortnite download, fortnite battle royale, and epic games fortnite.

Fortnite is available on almost all possible gaming platforms (Microsoft Windows, macOS, Xbox One, PlayStation 4, iOS, Android, Nintendo Switch). The gameplay originally consisted in studying the in-game map, collecting resources, building fortifications, and simply surviving (including defending yourself against night-time zombies). But then the developers released the multiplayer deathmatch mode Fortnite Battle Royale, which later turned into a full-fledged game and became even more of a hit than the original. The queries “fortnite mobile” and “fortnite android” confirm our suspicion that children are increasingly switching allegiance to mobile games.
In addition to PC and mobile games, children were interested in consoles. They searched for Nintendo Switch, PS4, Xbox, and Playstation.
Adult Content
Many people worry about the extent to which children are interested in pornography and erotica.
In terms of percentage of all website categories visited from PCs, the Adult Content category in the past reporting year accounted for 2.08%, up 1.34 p.p. on last year (0.74%).
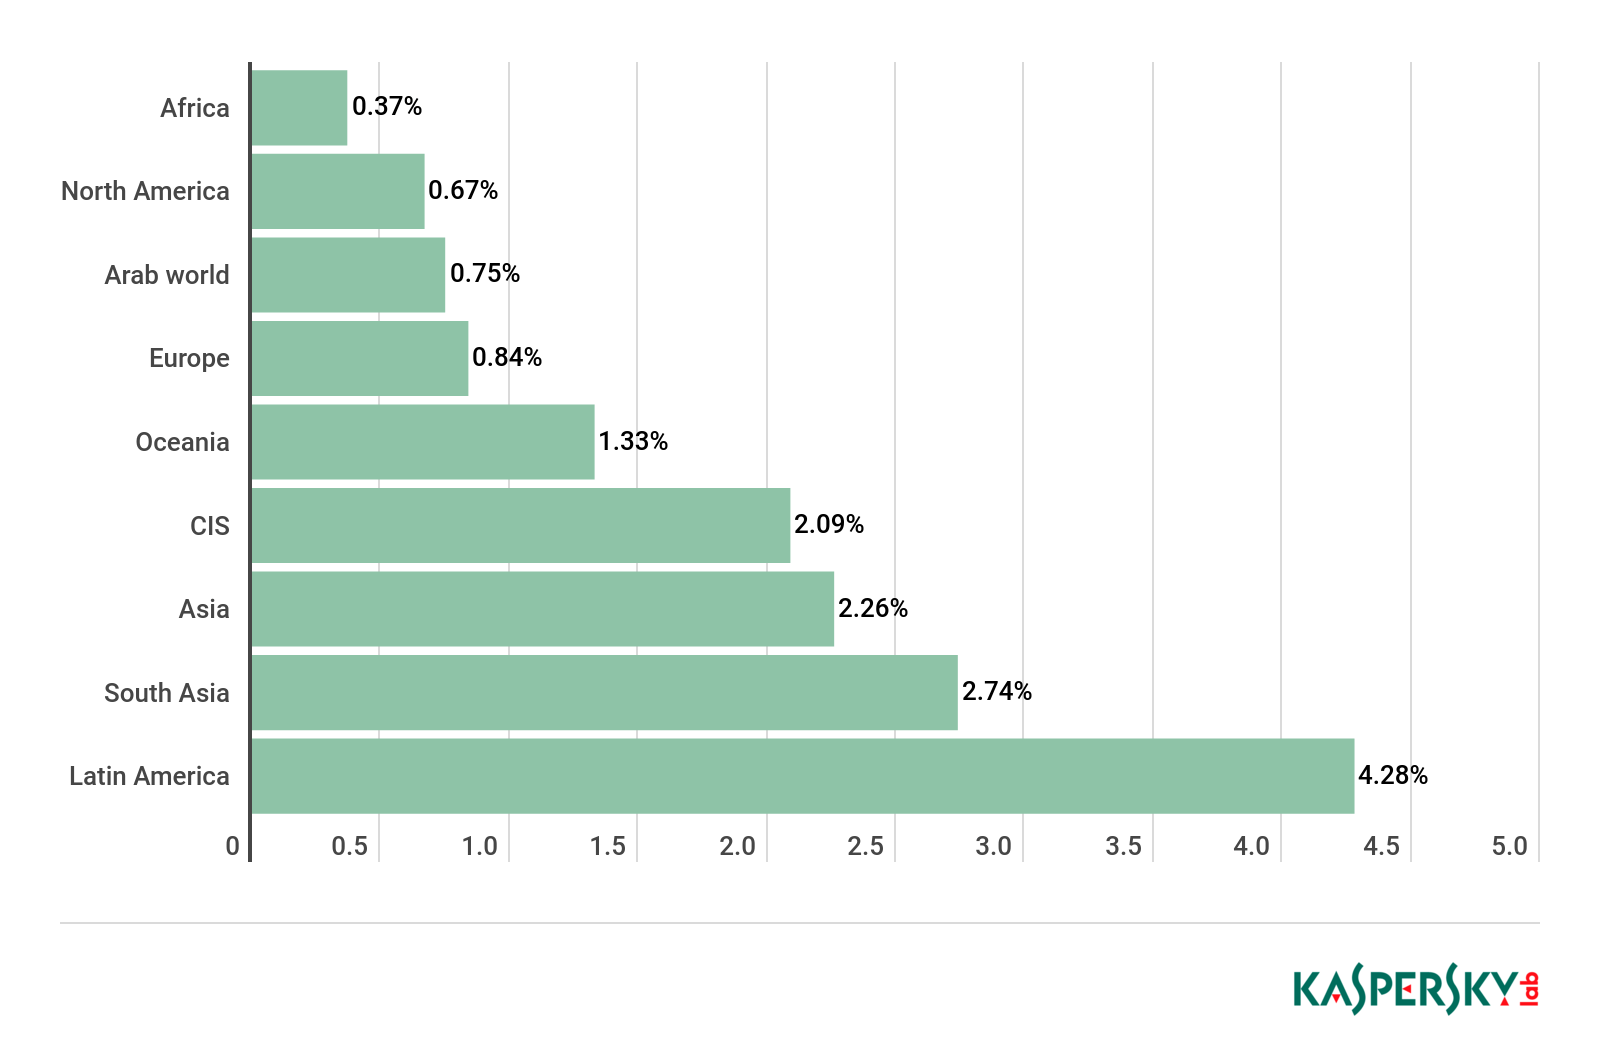
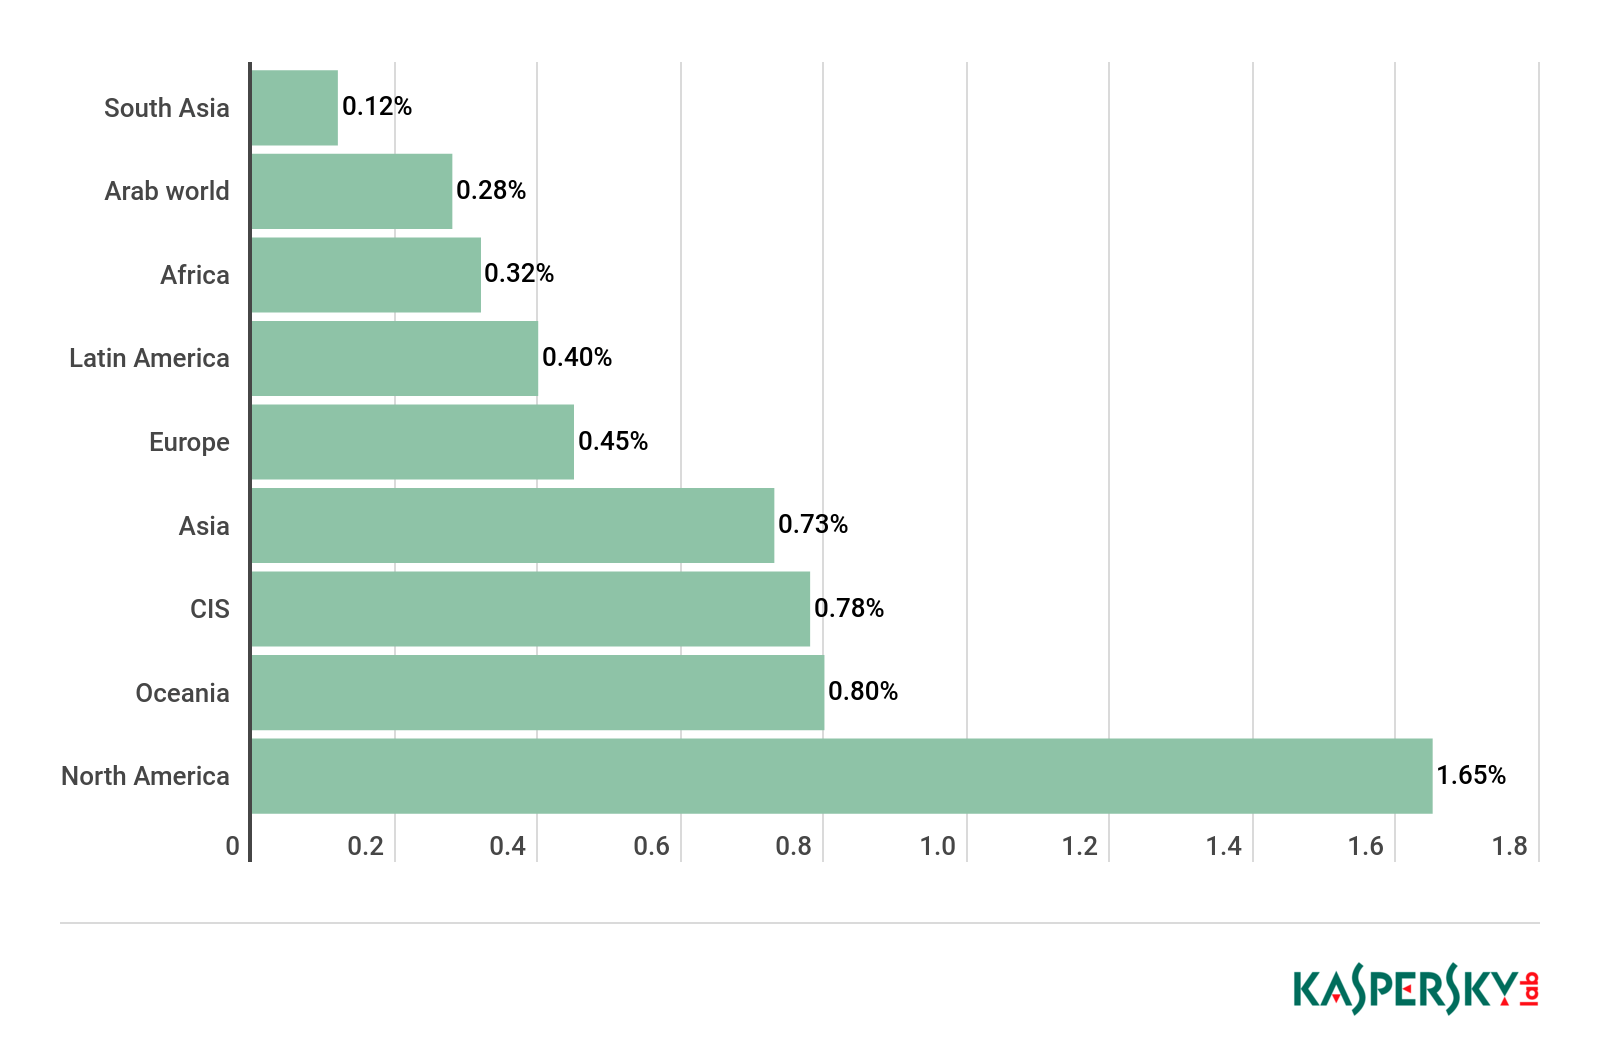
Share of websites in the Adult Content category in different regions, May 2018 – May 2019
The statistics by region show that the largest share of visits to adult sites belongs to Latin America (4.28%). In second place is South Asia (2.74%), with Asia in third place on 2.26%.

Comparison of the popularity of websites in the Adult Content category in different regions, May 2017 – May 2018 and May 2018 – May 2019
Compared to last year, the share of adult sites in Latin America climbed from 0.63% to 4.28%. In the CIS, we also saw an increase: from 0.48% to 2.09%. The most popular resources in the Adult Content category, as previously, are pornhub.com, xnxx.com, and livejasmin.com. Interestingly, in some regions this category became less popular. For example, it fell from 1.18% to 0.84% in Europe.
This is not the first year that Asia has posted an increased interest in the topic of pornography and erotica. Interestingly, this year it declined from 2.72% to 2.26%, but still remained quite high compared to other regions.
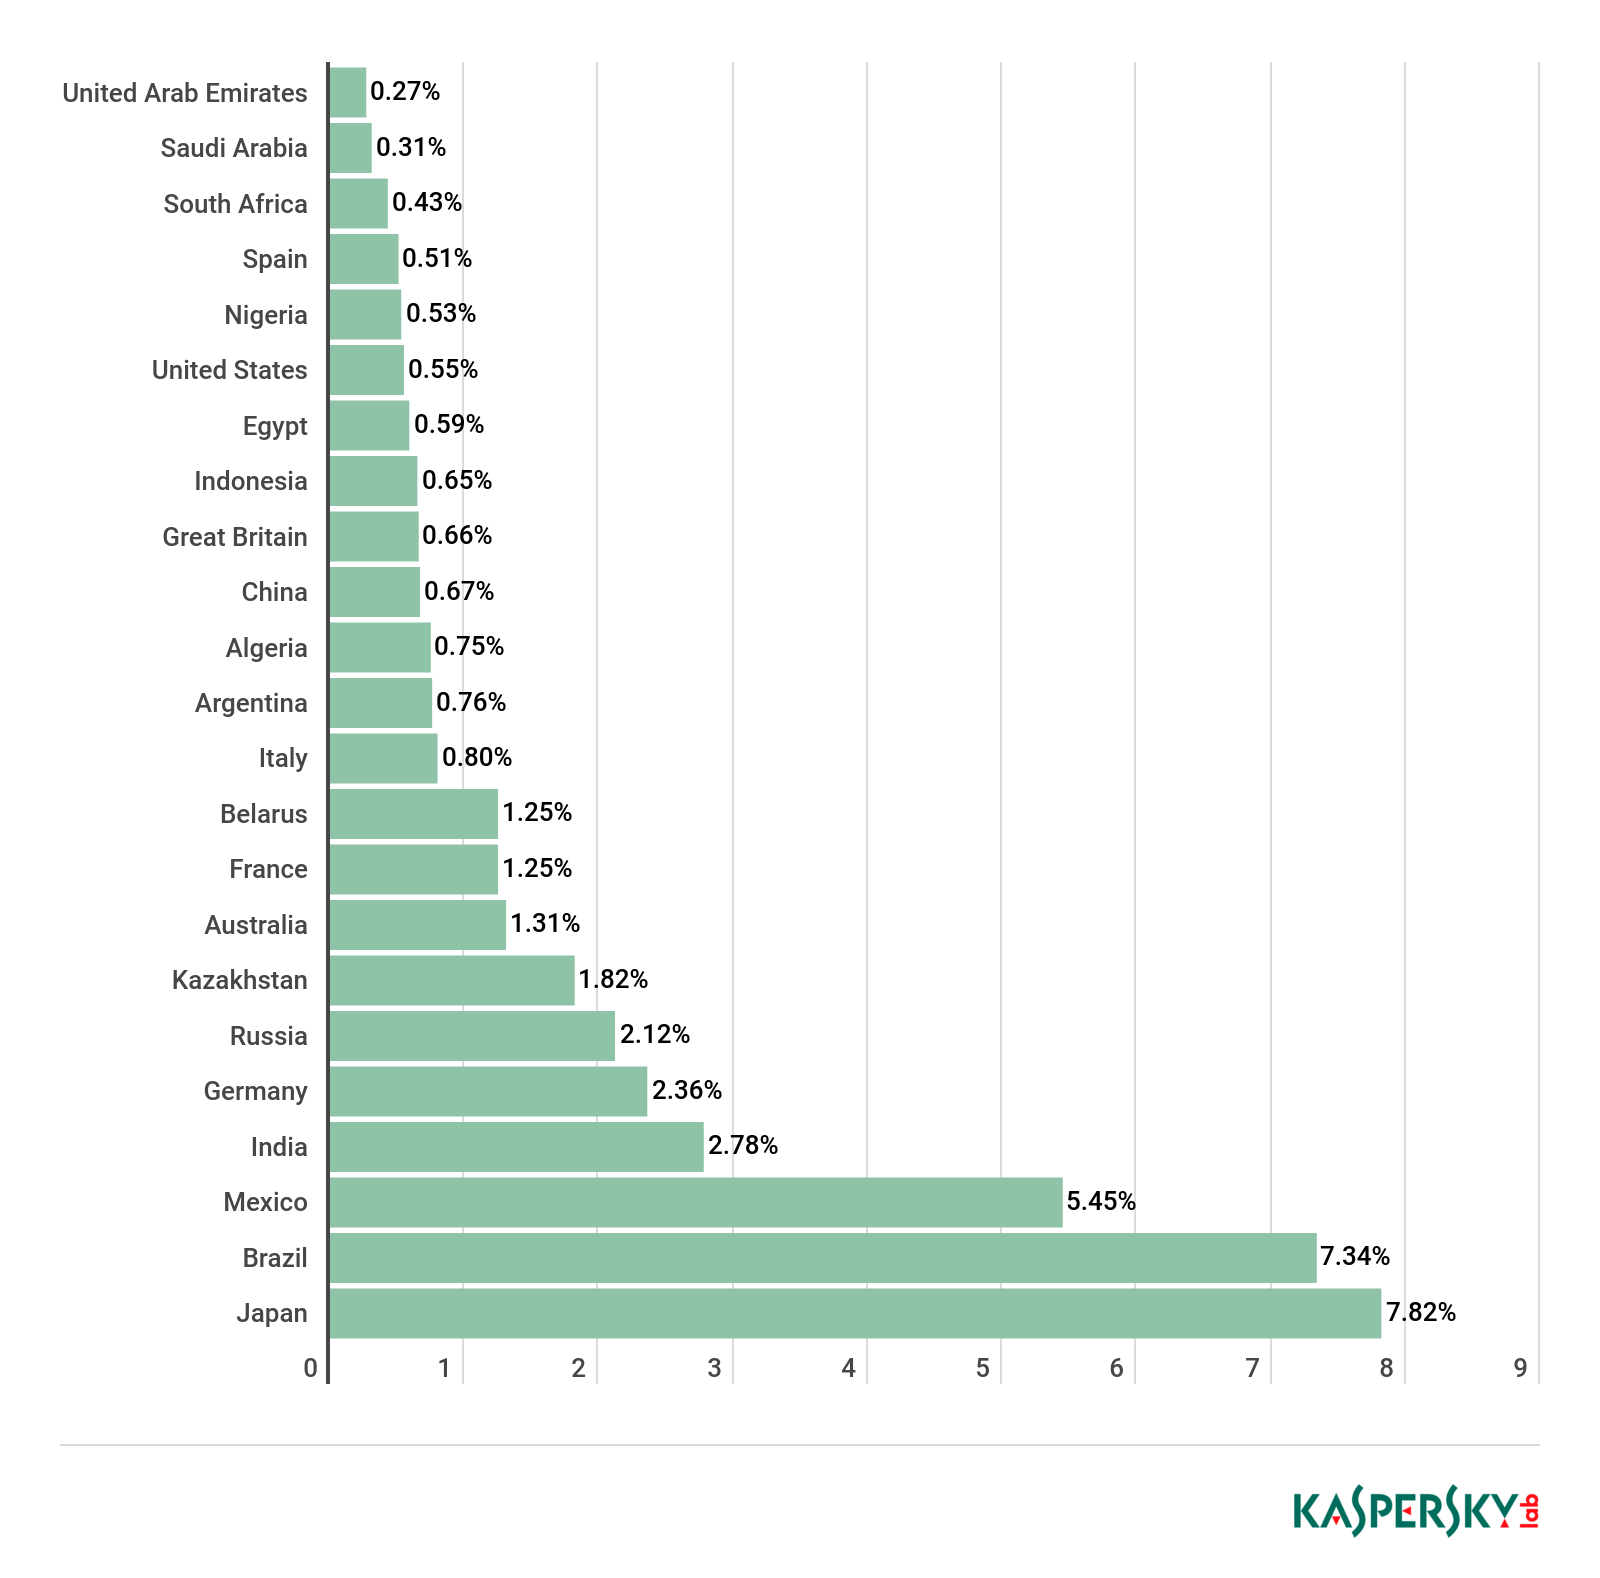
Share of websites in the Adult Content category in different countries, May 2018 – May 2019
Children in Japan are the most likely to try to visit (or actually visit if there is no parental block) porn sites – 7.82% of all website categories accessed by children from PCs. In second place is Brazil (7.34%), where children also show interest in adult content. Third place goes to Mexico (5.45%). The high figures in these countries mean that Asia and Latin America are the world’s leading regions in this category.
The language with the largest share of all porn-related search queries is Portuguese.

Distribution of search queries related to adult content in different languages, May 2018 – May 2019
In second place is Arabic, which last year accounted for the largest share of porn-related search queries (34.32%). Search queries in German came third.
Of interest here is not so much the sites that children visit from PCs, but the search queries they make; as we have noted in previous reports, children prefer viewing porn from mobile devices than PCs. Therefore, it would not be amiss to compare the search figures for the past two years:

Comparison of the popularity of Adult Content search queries in different languages, May 2017 – May 2018 and May 2018 – May 2019
Alcohol, Tobacco, Drugs
In the past two years, we have witnessed a downward trend in the number of visits by children worldwide to sites in the Alcohol, Tobacco, Drugs category.

Comparison of the popularity of websites in the Alcohol, Tobacco, Drugs category in different regions, May 2016 – May 2017, May 2017 – May 2018, and May 2018 – May 2019
Another reason for the decrease in the number of visits to sites in this category may be the loss of interest in electronic cigarettes and vapes. Whereas two or three years ago, vaping was all the rage, it is now a niche activity.
Popularity of websites in the Alcohol, Tobacco, Drugs category in different regions, May 2018 – May 2019
All the same, children in North America and Oceania are the most likely to visit sites related to alcohol, tobacco, or drugs. But in Europe, the figure fell against previous years. Interestingly, despite the regional figures, the share of visits to alcohol-, tobacco-, and drug-related sites in Japan (2.21%) is higher than in other countries. The US is in second place (1.59%), and Germany is in third (1.00%).

Popularity of websites in the Alcohol, Tobacco, Drugs category in different countries, May 2018 – May 2019
We cannot say for sure that children intentionally visit sites with such content, since the search queries that best reflect kids’ interest in the subject do not reveal any increase in such interest.

Distribution of search queries on the Alcohol, Tobacco, Drugs topic in different languages, May 2018 – May 2019
That said, in Chinese, children searched for 酒, 毒品 (alcohol, drugs); in German, “rauchen” (smoking), “bier” (beer), and “zigaretten” (cigarettes); in Portuguese, “maconha” (marijuana) and “caipirinha” (a Brazilian cocktail); and in Russian, “наркотики” (drugs), “алкоголь” (alcohol), and “сигареты” (cigarettes).
Other
Besides the categories examined in this report, our investigation of search queries revealed other topics of interest to kids. For instance, search queries related to online translators are among the most popular.
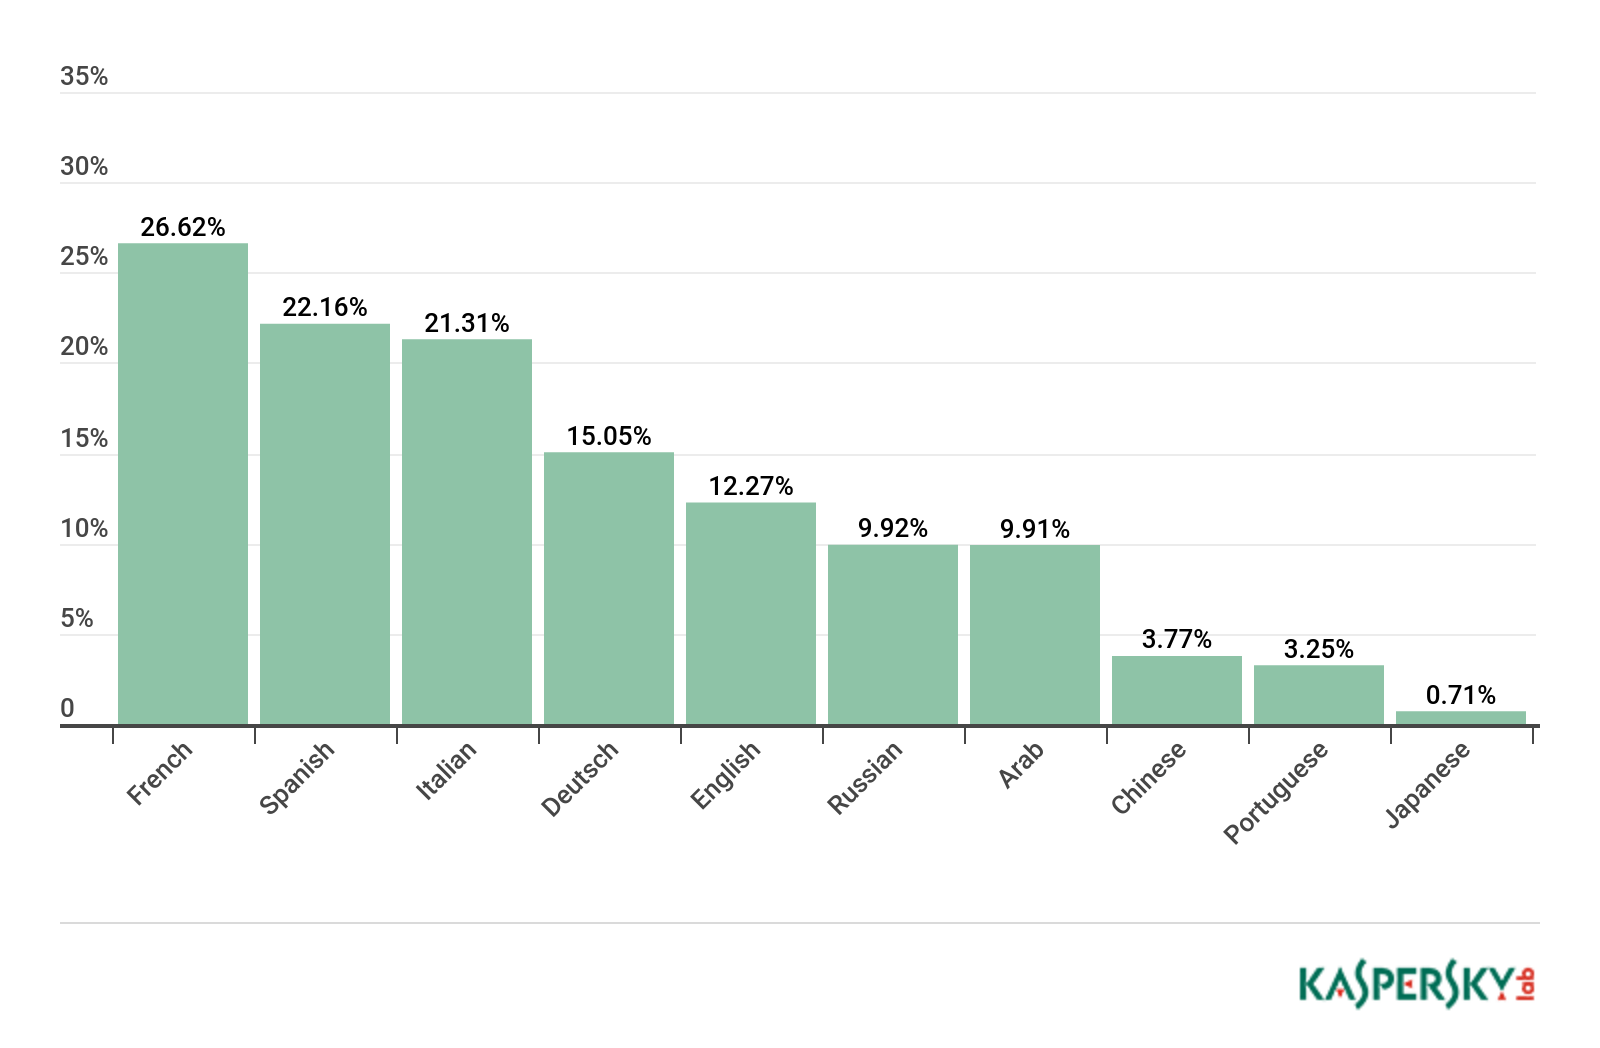
Distribution of search queries related to the topic of online translation in different languages, May 2018 – May 2019
In French, children searched for “traduction francais anglais” and “traduction espagnol français”; in Spanish, “traductor español ingles” and “traductor español frances”; in Italian, “traduttore inglese italiano” and “traduttore francese italiano”; and in German, “google übersetzer” and “englisch deutsch”.
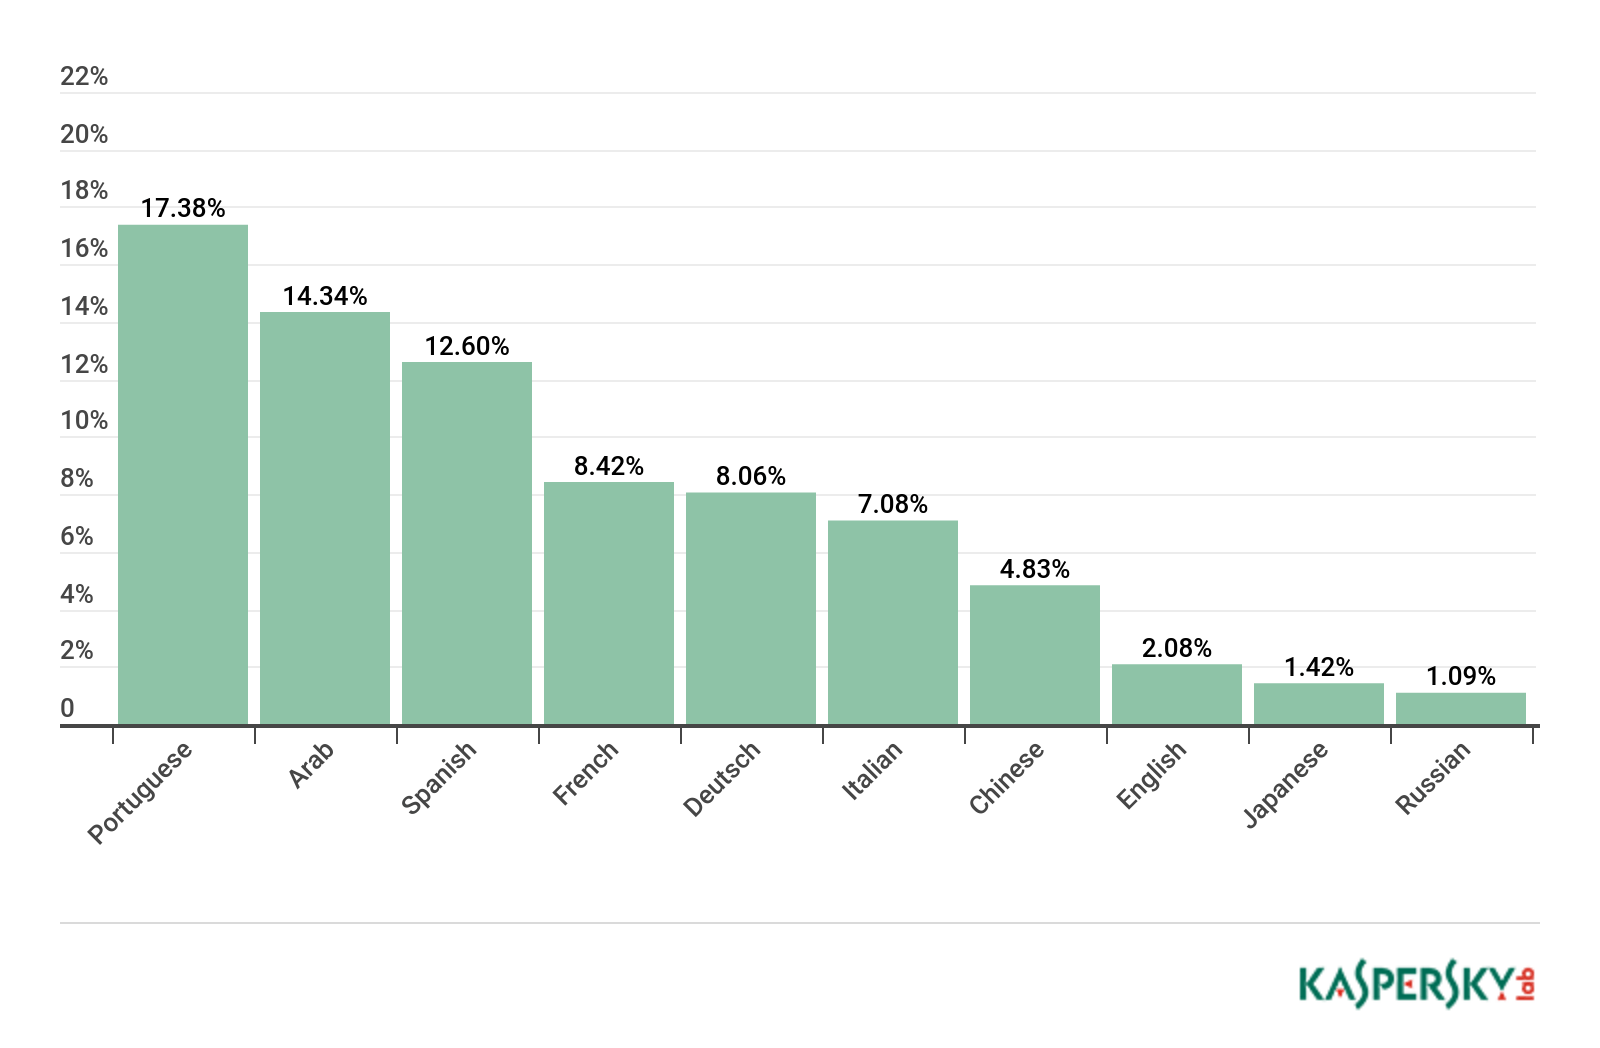
Distribution of sports-related search queries in different languages, May 2018 – May 2019
Portuguese-speaking children showed most interest in the topic of sport. Their search queries included Brazilian soccer stars and match results. Sports were also of great interest to children in the Arab world and Spanish-speaking countries. The vast majority of queries were soccer-related.

Distribution of celebrity-related search queries in different languages, May 2018 – May 2019
Children also searched for information about real-life celebrities and various fictional characters. Interestingly, whatever the language, children most often searched for the same names: Harry Potter, Hitler, Donald Trump, and Kim Kardashian.
Alongside entertainment, children also use the Internet for educational purposes. The largest share of queries on the education topic were in Russian.
Distribution of search queries on the Education topic in different languages, May 2018 – May 2019
Conclusion
Every year, we see increasing numbers of children going online from mobile devices. Whereas this trend used to be more pronounced in Western countries than in the Arab world and Latin America, kids in these regions too are starting to switch to mobile platforms.
This is evidenced, above all, by the decrease in the number of visits to social networking sites from PCs. Developers are actively supporting users’ transition to mobile devices, adapting their services to smartphone screens. New social networks aimed exclusively at smartphones are becoming extremely popular with children and teenagers, who pick up innovations before adults do. Last year, for instance, the world of social networks was rocked by TikTok; Instagram and SnapChat are also increasing their audiences. Despite remaining the most popular social network in the world, Facebook is attracting ever fewer children and teenagers in the West.
Games, just like social networks, are increasingly shifting to mobile platforms. A good example is Fortnite, which children prefer to play on mobile devices and is (according to search queries) more popular than Roblox and Minecraft.
When it comes to online shopping, children still favor PCs. This is not surprising, since not all online stores have a user-friendly app or mobile version. Not for the first year did we see a rise in the popularity of the Software, Audio, Video category. And it was the first year that it dislodged the Online Communication from the top of the leaderboard. Children increasingly prefer to spend time watching videos on YouTube, and in addition to clips on the video hosting site, they also showed interest in Game of Thrones, the series Riverdale, and the latest Avengers.
We recommend using parental control to keep tabs on what children are looking at. Kaspersky Lab’s parental control component forms part of the Kaspersky Internet Security and Kaspersky Total Security solutions. We also have a separate product, Kaspersky Safe Kids, which not only prevents children from accessing undesirable websites, but notifies parents about what their children have been searching for online, and helps track their location and manage their gadget time.
Authors
What kids get up to online
Table of Contents
From the same authors


In the same category


Markus Freitag
The evaluations are great. What I am missing here is (1) some definitions, like you do not even define what “children” means (e.g. age) and (2) a more detailed partitioning of the categories: “Software, Audio, and Video” is much too broad – each of these would be interesting themselves.
Moreover, there are some results that I do not understand. You say you are collecting website access and/or queries. But how can you explain the number of access for websites that actually only relate to apps? Those are actually one time visits: Instagram, SnapChat, Spotify, TikTok. You download the app, use the service and never visit the website again. Why do they have such a large number of queries?
E K
Hello Markus, thank you for the question.
1. We do not collect data about the age of our users, so we can only assume that they are children aged from 5 to 17-18.
2. See here for a detailed description of the Software, audio, video category: https://support.kaspersky.com/11396?cid=KIS_16.0#catSoftware
We decided to talk about the topics that make up the overwhelming majority of Parental Control triggers.
3. We only have data about websites visited from PCs, as described in the article “Data is harvested from computers running Windows and Mac OS; no mobile statistics are provided in this report.” We do not see app activity and have no statistics on it. The popularity of different apps we can judge only indirectly, by search queries that come from both PCs and mobile devices. We counted only the total number of times that an unknown number of children performed a search, not the number of children who created the particular query. So we can only assume that a greater number of children searched for these apps. Moreover, queries such as “facebook” could simply be an attempt to visit a Facebook page from a PC, because in many browsers the address bar is also a search bar. It’s quite often the case that to access a particular website, you automatically enter the first letters of the domain, go to the search results (Google’s, for example) where you click the first link, and, presto, you’re on the site.