

Q3 figures
According to KSN data, Kaspersky Lab solutions detected and repelled 277,646,376 malicious attacks from online resources located in 185 countries all over the world.
72,012,219 unique URLs were recognized as malicious by web antivirus components.
Attempted infections by malware that aims to steal money via online access to bank accounts were registered on 204,388 user computers.
Crypto ransomware attacks were blocked on 186283 computers of unique users.
Kaspersky Lab’s file antivirus detected a total of 198,228,428 unique malicious and potentially unwanted objects.
Kaspersky Lab mobile security products detected:
- 1,598,196 malicious installation packages;
- 19,748 mobile banking Trojans (installation packages);
- 108,073 mobile ransomware Trojans (installation packages).
Mobile threats
Q3 events
The spread of the Asacub banker
In the third quarter, we continued to monitor the activity of the mobile banking Trojan Trojan-Banker.AndroidOS.Asacub that actively spread via SMS spam. Q3 saw cybercriminals carry out a major campaign to distribute the Trojan, resulting in a tripling of the number of users attacked. Asacub activity peaked in July, after which there was a decline in the number of attacks: in September we registered almost three times fewer attacked users than in July.

Number of unique users attacked by Trojan-Banker.AndroidOS.Asacub in Q2 and Q3 2017
New capabilities of mobile banking Trojans
Q3 2017 saw two significant events in the world of mobile banking Trojans.
Firstly, the family of mobile banking Trojans Svpeng has acquired the new modification Trojan-Banker.AndroidOS.Svpeng.ae capable of granting all the necessary rights to itself and stealing data from other applications. To do this, it just needs to persuade the user to allow the Trojan to utilize special functions designed for people with disabilities. As a result, the Trojan can intercept text that a user is entering, steal text messages and even prevent itself from being removed.
Interestingly, in August we discovered yet another modification of Svpeng that uses special features. Only, this time the Trojan was not banking related – instead of stealing data, it encrypts all the files on a device and demands a ransom in bitcoins.
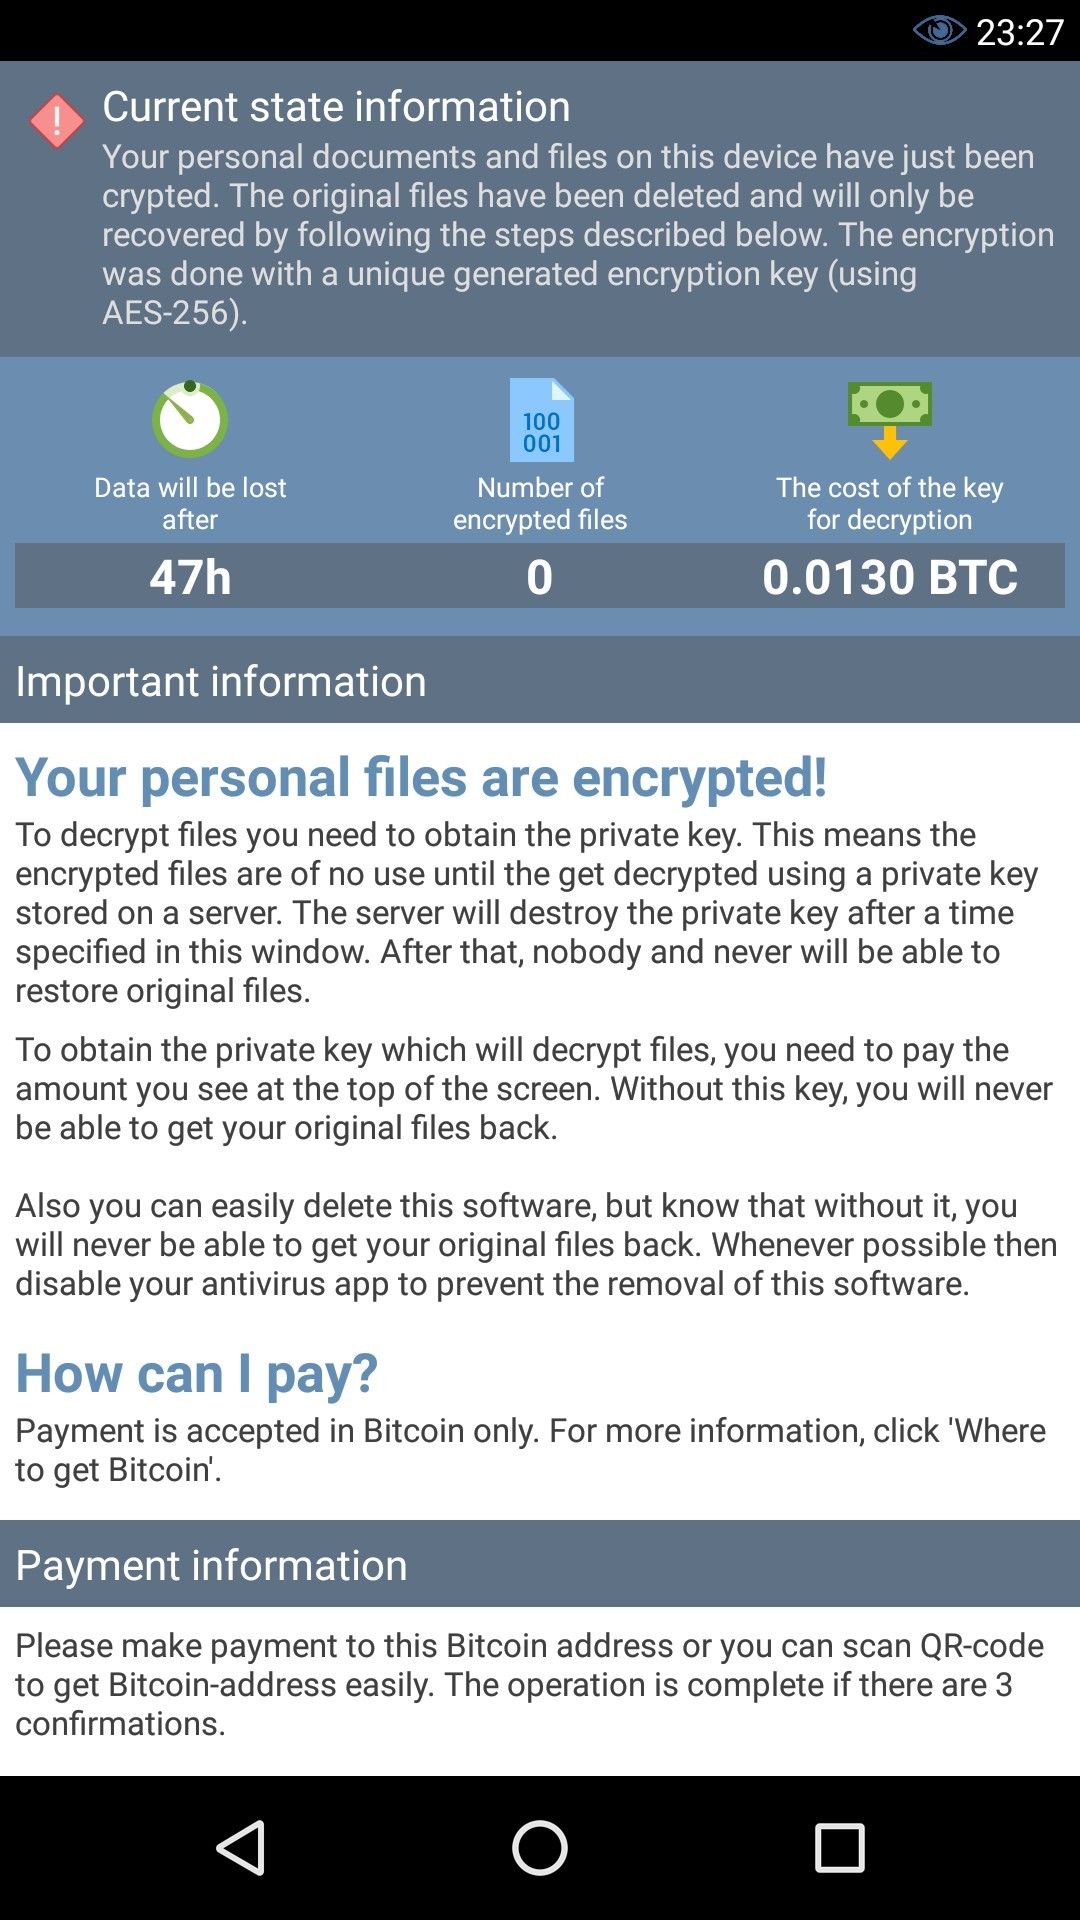
Trojan-Banker.AndroidOS.Svpeng.ag. window containing ransom demand
Secondly, the FakeToken family of mobile banking Trojans has expanded the list of apps it attacks. If previously representatives of this family mostly overlaid banking and some Google apps (e.g. Google Play Store) with a phishing window, it is now also overlaying apps used to book taxis, air tickets and hotels. The aim of the Trojan is to harvest data from bank cards.
The growth of WAP billing subscriptions
In the third quarter of 2017, we continued to monitor the increased activity of Trojans designed to steal users’ money via subscriptions. To recap, these are Trojans capable of visiting sites that allow users to pay for services by deducting money from their mobile phone accounts. These Trojans can usually click buttons on such sites using special JS files, and thus make payments without the user’s knowledge.
Our Top 20 most popular Trojan programs in Q3 2017 included three malware samples that attack WAP subscriptions. They are Trojan-Dropper.AndroidOS.Agent.hb and Trojan.AndroidOS.Loapi.b in fourth and fifth, and Trojan-Clicker.AndroidOS.Ubsod.b in seventh place.
Mobile threat statistics
In the third quarter of 2017, Kaspersky Lab detected 1,598,196 malicious installation packages, which is 1.2 times more than in the previous quarter.

Number of detected malicious installation packages (Q4 2016 – Q3 2017)
Distribution of mobile malware by type

Distribution of new mobile malware by type (Q2 and Q3 2017)
RiskTool (53.44%) demonstrated the highest growth in Q3 2017, with its share increasing by 12.93 percentage points (p.p.). The majority of all installation packages discovered belonged to the RiskTool.AndroidOS.Skymobi family.
Trojan-Dropper malware (10.97%) came second in terms of growth rate: its contribution increased by 6.29 p.p. Most of the installation packages are detected as Trojan-Dropper.AndroidOS.Agent.hb.
The share of Trojan-Ransom programs, which was first in terms of the growth rate in the first quarter of 2017, continued to fall and accounted for 6.69% in Q3, which is 8.4 p.p. less than the previous quarter. The percentage of Trojan-SMS malware also fell considerably to 2.62% – almost 4 p.p. less than in Q2.
In Q3, Trojan-Clicker malware broke into this rating after its contribution increased from 0.29% to 1.41% in the space of three months.
TOP 20 mobile malware programs
Please note that this rating of malicious programs does not include potentially dangerous or unwanted programs such as RiskTool or adware.
| Verdict | % of attacked users* | |
| 1 | DangerousObject.Multi.Generic | 67.14 |
| 2 | Trojan.AndroidOS.Boogr.gsh | 7.52 |
| 3 | Trojan.AndroidOS.Hiddad.ax | 4.56 |
| 4 | Trojan-Dropper.AndroidOS.Agent.hb | 2.96 |
| 5 | Trojan.AndroidOS.Loapi.b | 2.91 |
| 6 | Trojan-Dropper.AndroidOS.Hqwar.i | 2.59 |
| 7 | Trojan-Clicker.AndroidOS.Ubsod.b | 2.20 |
| 8 | Backdoor.AndroidOS.Ztorg.c | 2.09 |
| 9 | Trojan.AndroidOS.Agent.gp | 2.05 |
| 10 | Trojan.AndroidOS.Sivu.c | 1.98 |
| 11 | Trojan.AndroidOS.Hiddapp.u | 1.87 |
| 12 | Backdoor.AndroidOS.Ztorg.a | 1.68 |
| 13 | Trojan.AndroidOS.Agent.ou | 1.63 |
| 14 | Trojan.AndroidOS.Triada.dl | 1.57 |
| 15 | Trojan-Ransom.AndroidOS.Zebt.a | 1.57 |
| 16 | Trojan-Dropper.AndroidOS.Hqwar.gen | 1.53 |
| 17 | Trojan.AndroidOS.Hiddad.an | 1.48 |
| 18 | Trojan.AndroidOS.Hiddad.ci | 1.47 |
| 19 | Trojan-Banker.AndroidOS.Asacub.ar | 1.41 |
| 20 | Trojan.AndroidOS.Agent.eb | 1.29 |
* Percentage of unique users attacked by the malware in question, relative to all users of Kaspersky Lab’s mobile security product that were attacked.
First place was occupied by DangerousObject.Multi.Generic (67.14%), the verdict used for malicious programs detected using cloud technologies. This is basically how the very latest malware is detected.
As in the previous quarter, Trojan.AndroidOS.Boogr.gsh (7.52%) came second. This verdict is issued for files recognized as malicious by our system based on machine learning.
Trojan.AndroidOS.Hiddad.an (4.56%) was third. The main purpose of this Trojan is to open and click advertising links received from the C&C. The Trojan requests administrator rights to prevent its removal.
Trojan-Dropper.AndroidOS.Agent.hb (2.96%) climbed from sixth in Q2 to fourth this quarter. This Trojan decrypts and runs another Trojan – a representative of the Loaipi family. One of them –Trojan.AndroidOS.Loapi.b – came fifth in this quarter’s Top 20. This is a complex modular Trojan whose main malicious component needs to be downloaded from the cybercriminals’ server. We can assume that Trojan.AndroidOS.Loapi.b is designed to steal money via paid subscriptions.
Trojan-Dropper.AndroidOS.Hqwar.i (3.59%), the verdict used for Trojans protected by a certain packer/obfuscator, fell from fourth to sixth. In most cases, this name indicates representatives of the FakeToken and Svpeng mobile banking families.
In seventh was Trojan-Clicker.AndroidOS.Ubsod.b, a small basic Trojan that receives links from a C&C and opens them. We wrote about this family in more detail in our review of Trojans that steal money using WAP subscriptions.
Trojan Backdoor.AndroidOS.Ztorg.c came eighth. This is one of the most active advertising Trojans that uses superuser rights. In the third quarter of 2017, our Top 20 included eight Trojans that try to obtain or use root rights and which make use of advertising as their main means of monetization. Their goal is to deliver ads to the user more aggressively, applying (among other methods) hidden installation of new advertising programs. At the same time, superuser privileges help them ‘hide’ in the system folder, making it very difficult to remove them. It’s worth noting that the quantity of this type of malware in the Top 20 has been decreasing (in Q1 2017, there were 14 of these Trojans in the rating, while in Q2 the number was 11).
Trojan.AndroidOS.Agent.gp (2.05%), which steals money from users making calls to premium numbers, rose from fifteenth to ninth. Due to its use of administrator rights, it resists attempts to remove it from an infected device.
Occupying fifteenth this quarter was Trojan-Ransom.AndroidOS.Zebt.a, the first ransom Trojan in this Top 20 rating in 2017. This is a fairly simple Trojan whose main goal is to block the device with its window and demand a ransom. Zebt.a tends to attack users in Europe and Mexico.
Trojan.AndroidOS.Hiddad.an (1.48%) fell to sixteenth after occupying second and third in the previous two quarters. This piece of malware imitates various popular games or programs. Interestingly, once run, it downloads and installs the application it imitated. In this case, the Trojan requests administrator rights to withstand removal. The main purpose of Trojan.AndroidOS.Hiddad.an is the aggressive display of adverts. Its main ‘audience’ is in Russia.
The geography of mobile threats

The geography of attempted mobile malware infections in Q3 2017 (percentage of all users attacked)
Top 10 countries attacked by mobile malware (ranked by percentage of users attacked):
| Country* | % of attacked users** | |
| 1 | Iran | 35.12 |
| 2 | Bangladesh | 28.30 |
| 3 | China | 27.38 |
| 4 | Côte d’Ivoire | 26.22 |
| 5 | Algeria | 24.78 |
| 6 | Nigeria | 23.76 |
| 7 | Indonesia | 22.29 |
| 8 | India | 21.91 |
| 9 | Nepal | 20.78 |
| 10 | Kenya | 20.43 |
* We eliminated countries from this rating where the number of users of Kaspersky Lab’s mobile security product is relatively low (under 10,000).
** Percentage of unique users attacked in each country relative to all users of Kaspersky Lab’s mobile security product in the country.
For the third quarter in a row Iran was the country with the highest percentage of users attacked by mobile malware – 35.12%. Bangladesh came second, with 28.3% of users there encountering a mobile threat at least once during Q3. China (27.38%) followed in third.
Russia (8.68%) came 35th this quarter (vs 26th place in Q2), France (4.9%) was 59th, the US (3.8%) 67th, Italy (5.3%) 56th, Germany (2.9%) 79th, and the UK (3.4%) 72nd.
The safest countries were Georgia (2.2%), Denmark (1.9%), and Japan (0.8%).
Mobile banking Trojans
Over the reporting period we detected 19,748 installation packages for mobile banking Trojans, which is 1.4 times less than in Q2 2017.
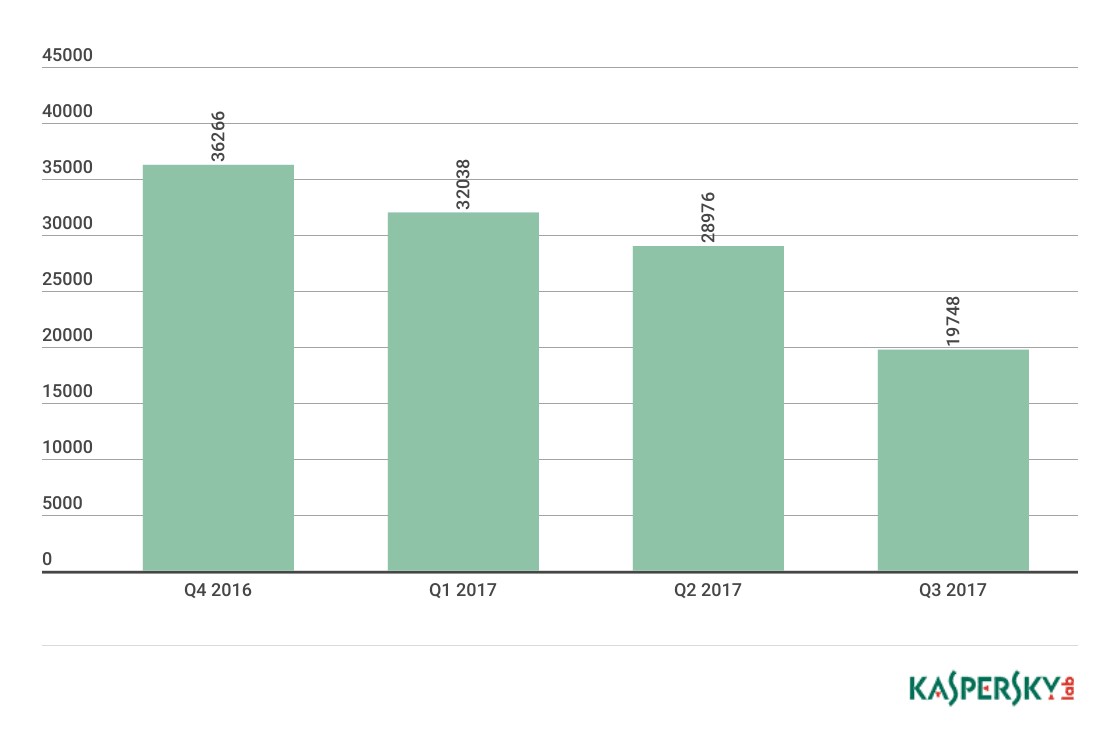
Number of installation packages for mobile banking Trojans detected by Kaspersky Lab solutions (Q4 2016 – Q3 2017)
Banker.AndroidOS.Asacub.ar became the most popular mobile banking Trojan in Q3, replacing the long-term leader Trojan-Banker.AndroidOS.Svpeng.q. These mobile banking Trojans use phishing windows to steal credit card data and logins and passwords for online banking accounts. In addition, they steal money via SMS services, including mobile banking.

Geography of mobile banking threats in Q3 2017 (percentage of all users attacked)
Top 10 countries attacked by mobile banker Trojans (ranked by percentage of users attacked):
| Country* | % of attacked users** | |
| 1 | Russia | 1.20 |
| 2 | Uzbekistan | 0.40 |
| 3 | Kazakhstan | 0.36 |
| 4 | Tajikistan | 0.35 |
| 5 | Turkey | 0.34 |
| 6 | Moldova | 0.31 |
| 7 | Ukraine | 0.29 |
| 8 | Kyrgyzstan | 0.27 |
| 9 | Belarus | 0.26 |
| 10 | Latvia | 0.23 |
* We eliminated countries from this rating where the number of users of Kaspersky Lab’s mobile security product is relatively low (under 10,000).
** Percentage of unique users in each country attacked by mobile banker Trojans, relative to all users of Kaspersky Lab’s mobile security product in the country.
In Q3 2017, the Top 10 countries attacked by mobile banker Trojans saw little change: Russia (1.2%) topped the ranking again. In second and third places were Uzbekistan (0.4%) and Kazakhstan (0.36%), which came fifth and tenth respectively in the previous quarter. In these countries the Faketoken.z, Tiny.b and Svpeng.y families were the most widespread threats.
Of particular interest is the fact that Australia, a long-term resident at the top end of this rating, didn’t make it into our Top 10 this quarter. This was due to a decrease in activity by the Trojan-Banker.AndroidOS.Acecard and Trojan-Banker.AndroidOS.Marcher mobile banking families.
Mobile ransomware
In Q3 2017, we detected 108,073 mobile Trojan-Ransomware installation packages, which is almost half as much as in the previous quarter.

Number of mobile Trojan-Ransomware installation packages detected by Kaspersky Lab (Q3 2016 – Q3 2017)
In our report for Q2, we wrote that in the first half of 2017, we had discovered more mobile ransomware installation packages than in any other period. The reason was the Trojan-Ransom.AndroidOS.Congur family. However, in the third quarter of this year we observed a decline in this family’s activity.
Trojan-Ransom.AndroidOS.Zebt.a became the most popular mobile Trojan-Ransomware in Q3, accounting for more than a third of users attacked by mobile ransomware. Second came Trojan-Ransom.AndroidOS.Svpeng.ab. Meanwhile, Trojan-Ransom.AndroidOS.Fusob.h, which topped the rating for several quarters in a row, was only third in Q3 2017.

Geography of mobile Trojan-Ransomware in Q3 2017 (percentage of all users attacked)
Top 10 countries attacked by mobile Trojan-Ransomware (ranked by percentage of users attacked):
| 1 | US | 1.03% |
| 2 | Mexico | 0.91% |
| 3 | Belgium | 0.85% |
| 4 | Kazakhstan | 0.79% |
| 5 | Romania | 0.70% |
| 6 | Italy | 0.50% |
| 7 | China | 0.49% |
| 8 | Poland | 0.49% |
| 9 | Austria | 0.45% |
| 10 | Spain | 0.33% |
* We eliminated countries from this ranking where the number of users of Kaspersky Lab’s mobile security product is lower than 10,000.
** Percentage of unique users in each country attacked by mobile Trojan-Ransomware, relative to all users of Kaspersky Lab’s mobile security product in the country.
The US (1.03%) again topped the rating of countries attacked most by mobile Trojan-Ransomware; the most widespread family in the country was Trojan-Ransom.AndroidOS.Svpeng. These Trojans appeared in 2014 as a modification of the Trojan-Banker.AndroidOS.Svpeng mobile banking family. They demand a ransom of about $500 from victims to unblock their devices.
In Mexico (0.91%), which came second in Q3 2017, most mobile ransomware attacks involved Trojan-Ransom.AndroidOS.Zebt.a. Belgium (0.85%) came third, with Zebt.a the main threat to users there too.
Vulnerable apps exploited by cybercriminals
Q3 2017 saw continued growth in the number of attacks launched against users involving malicious Microsoft Office documents. We noted the emergence of a large number of combined documents containing an exploit as well as a phishing message – in case the embedded exploit fails.
Although two new Microsoft Office vulnerabilities, CVE-2017-8570 and CVE-2017-8759, have emerged, cybercriminals have continued to exploit CVE-2017-0199, a logical vulnerability in processing HTA objects that was discovered in March 2017. Kaspersky Lab statistics show that attacks against 65% users in Q3 exploited CVE-2017-0199, and less than 1% exploited CVE-2017-8570 or CVE-2017-8759. The overall share of exploits for Microsoft Office was 27.8%.
There were no large network attacks (such as WannaCry or ExPetr) launched in Q3 using vulnerabilities patched by the MS17-010 update. However, according to KSN data, there was major growth throughout the quarter in the number of attempted exploitations of these vulnerabilities that were blocked by our Intrusion Detection System component. Unsurprisingly, the most popular exploits have been EternalBlue and its modifications, which use an SMB protocol vulnerability; however, KL statistics show that EternalRomance, EternalChampion and an exploit for the CVE-2017-7269 vulnerability in IIS web servers have also been actively used by cybercriminals. EternalBlue, however, accounts for millions of blocked attempted attacks per month, while the numbers for other exploits are much lower.

Distribution of exploits used in attacks by type of application attacked, Q3 2017
The distribution of exploits by the type of attacked application this quarter was practically the same as in Q2. First place is still occupied by exploits targeting browsers and browser components with a share of 35.0% (a decline of 4 p.p. compared to Q2.) The proportion of exploits targeting Android vulnerabilities (22.7%) was almost identical to that in Q2, placing this type of attacked application once again in third behind Office vulnerabilities.
Online threats (Web-based attacks)
These statistics are based on detection verdicts returned by the web antivirus module that protects users at the moment when malicious objects are downloaded from a malicious/infected web page. Malicious sites are specifically created by cybercriminals; infected web resources include those whose content is created by users (e.g. forums), as well as legitimate resources.
Online threats in the banking sector
These statistics are based on detection verdicts of Kaspersky Lab products, received from users of Kaspersky Lab products who have consented to provide their statistical data. Beginning from the first quarter of 2017 these statistics include malicious programs for ATMs and POS terminals, but do not include mobile threats.
In Q3 2017, Kaspersky Lab solutions blocked attempts to launch one or more malicious programs capable of stealing money via online banking on 204,388 computers.

Number of users attacked by financial malware, Q3 2017
Geography of attacks
To evaluate and compare the risk of being infected by banking Trojans and ATM and POS-malware worldwide, we calculate the percentage of Kaspersky Lab product users in the country who encountered this type of threat during the reporting period, relative to all users of our products in that country.

Geography of banking malware attacks in Q3 2017 (percentage of all users attacked)
TOP 10 countries attacked by mobile banker Trojans (ranked by percentage of users attacked)
| Country* | % of users attacked** | |
| 1 | Togo | 2.30 |
| 2 | China | 1.91 |
| 3 | Taiwan | 1.65 |
| 4 | Indonesia | 1.58 |
| 5 | South Korea | 1.56 |
| 6 | Germany | 1.53 |
| 7 | United Arab Emirates | 1.52 |
| 8 | Lebanon | 1.48 |
| 9 | Libya | 1.43 |
| 10 | Jordan | 1.33 |
These statistics are based on detection verdicts returned by the antivirus module, received from users of Kaspersky Lab products who have consented to provide their statistical data.
* We excluded those countries in which the number of Kaspersky Lab product users is relatively small (under 10,000).
** Unique users whose computers have been targeted by banking Trojan malware attacks as a percentage of all unique users of Kaspersky Lab products in the country.
TOP 10 banking malware families
The table below shows the Top 10 malware families used in Q3 2017 to attack online banking users (in terms of percentage of users attacked):
| Name* | % of attacked users** | |
| 1 | Trojan-Spy.Win32.Zbot | 27.9 |
| 2 | Trojan.Win32.Nymaim | 20.4 |
| 3 | Trojan.Win32.Neurevt | 10.0 |
| 4 | Trickster | 9.5 |
| 5 | SpyEye | 7.5 |
| 6 | Caphaw | 6.3 |
| 7 | Trojan-Banker.Win32.Gozi | 2.0 |
| 8 | Shiz | 1.8 |
| 9 | ZAccess | 1.6 |
| 10 | NeutrinoPOS | 1.6 |
* The detection verdicts of Kaspersky Lab products, received from users of Kaspersky Lab products who have consented to provide their statistical data.
** Unique users whose computers have been targeted by the malware in question as a percentage of all users attacked by financial malware.
The malware families Dridex and Tinba lost their places in this quarter’s Top 10. One of their former positions was occupied by the Trickster bot (accounting for 9.5% of attacked users), also known as TrickBot, a descendant of the now defunct Dyre banker. There was a small change in the leading three malicious families. First and second places are still occupied by Trojan-Spy.Win32.Zbot (27.9%) and Trojan.Win32.Nymaim (20.4%) respectively, while third place is now occupied by Trojan.Win32.Neurevt (10%) whose share grew by nearly 4 p.p.
Cryptoware programs
Q3 highlights
Crysis rises from the dead
In our Q2 report we wrote that the cybercriminals behind the Crysis ransomware cryptor halted distribution of the malware and published the secret keys needed to decrypt files. This took place in May 2017, and all propagation of the ransomware was stopped completely at that time.
However, nearly three months later, in mid-August, we discovered that this Trojan had come back from the dead and had set out on a new campaign of active propagation. The email addresses used by the blackmailers were different from those used in earlier samples of Crysis. A detailed analysis revealed that the new samples of the Trojan were completely identical to the old ones apart from just one thing – the public master keys were new. Everything else was the same, including the compilation timestamp in the PE header and, more interestingly, the labels that the Trojan leaves in the service area at the end of each encrypted file. Closer scrutiny of the samples suggests that the new distributors of the malware didn’t have the source code, so they just took its old body and used a HEX editor to change the key and the contact email.
The above suggests that this piece of ‘zombie’ malware is being spread by a different group of malicious actors rather than its original developer who disclosed all the private keys in May.
Surge in Cryrar attacks
The Cryrar cryptor (aka ACCDFISA) is a veteran among the ransomware Trojans that are currently being spread. It emerged way back in 2012 and has been active ever since. The cryptor is written in PureBasic and uses a legitimate executable RAR archiver file to place the victim’s files in password-encrypted RAR-sfx archives.
In the first week of September 2017 we recorded a dramatic rise in the number of attempted infections with Cryrar – a surge never seen before or since. The malicious actors used the following approach: they crack the password to RDP by brute force, get authentication on the victim’s system using the remote access protocol and manually launch the Trojan’s installation file. The latter, in turn, installs the cryptor’s body and the components it requires (including the renamed RAR.EXE file), and then automatically launches the cryptor.
According to KSN data, this wave of attacks primarily targeted Vietnam, China, the Philippines and Brazil.
Master key to original versions of Petya/Mischa/GoldenEye published
In July 2017, the authors of the Petya Trojan published their master key, which can be used to decrypt the Salsa keys required to decrypt MFT and unblock access to systems affected by Petya/Mischa or GoldenEye.
This happened shortly after the ExPetr epidemic which used part of the GoldenEye code. This suggests that the authors of Petya/Mischa/GoldenEye did so in an attempt to distance themselves from the ExPetr attack and the outcry that it caused.
Unfortunately, this master key won’t help those affected by ExPetr, as its creators didn’t include the option of restoring a Salsa key to decrypt MFT.
The number of new modifications
In Q3 2017, we identified five new ransomware families in this classification. It’s worth noting here that this number doesn’t include all the Trojans that weren’t assigned their own ‘personal’ verdict. Each quarter, dozens of these malicious programs emerge, though they either have so few distinctive characteristics or occur so rarely that they and the hundreds of others like them remain nameless, and are detected with generic verdicts.

Number of newly created cryptor modifications, Q3 2016 – Q3 2017
The number of new cryptor modifications continues to decline compared to previous quarters. This could be a temporary trend, or could indicate that cybercriminals are gradually losing their interest in cryptors as a means of making money, and are switching over to other types of malware.
The number of users attacked by ransomware
July was the month with the lowest ransomware activity. From July to September, the number of ransomware attacks rose, though it remained lower than May and June when two massive epidemics (WannaCry and ExPetr) struck.

Number of unique users attacked by Trojan-Ransom cryptor malware (Q3 2017)
The geography of attacks

Top 10 countries attacked by cryptors
| Country* | % of users attacked by cryptors** | |
| 1 | Myanmar | 0.95% |
| 2 | Vietnam | 0.92% |
| 3 | Indonesia | 0.69% |
| 4 | Germany | 0.62% |
| 5 | China | 0.58% |
| 6 | Russia | 0.51% |
| 7 | Philippines | 0.50% |
| 8 | Venezuela | 0.50% |
| 9 | Cambodia | 0.50% |
| 10 | Austria | 0.49% |
* We excluded those countries where the number of Kaspersky Lab product users is relatively small (under 50,000)
** Unique users whose computers have been targeted by ransomware as a percentage of all unique users of Kaspersky Lab products in the country.
Most of the countries in this Top 10 are from Asia, including Myanmar (0.95%), a newcomer to the Top 10 that swept into first place in Q3. Vietnam (0.92%) came second, moving up two places from Q2, while China (0.58%) rose one place to fifth.
Brazil, Italy and Japan were the leaders in Q2, but in Q3 they failed to make it into the Top 10. Europe is represented by Germany (0.62%) and Austria (0.49%).
Russia, in tenth the previous quarter, ended Q3 in sixth place.
Top 10 most widespread cryptor families
| Name | Verdict* | % of attacked users** | ||
| 1 | WannaCry | Trojan-Ransom.Win32.Wanna | 16.78% | |
| 2 | Crypton | Trojan-Ransom.Win32.Cryptoff | 14.41% | |
| 3 | Purgen/GlobeImposter | Trojan-Ransom.Win32.Purgen | 6.90% | |
| 4 | Locky | Trojan-Ransom.Win32.Locky | 6.78% | |
| 5 | Cerber | Trojan-Ransom.Win32.Zerber | 4.30% | |
| 6 | Cryrar/ACCDFISA | Trojan-Ransom.Win32.Cryrar | 3.99% | |
| 7 | Shade | Trojan-Ransom.Win32.Shade | 2.69% | |
| 8 | Spora | Trojan-Ransom.Win32.Spora | 1.87% | |
| 9 | (generic verdict) | Trojan-Ransom.Win32.Gen | 1.77% | |
| 10 | (generic verdict) | Trojan-Ransom.Win32.CryFile | 1.27% |
* These statistics are based on detection verdicts received from users of Kaspersky Lab products who have consented to provide their statistical data.
** Unique users whose computers have been targeted by a specific Trojan-Ransom family as a percentage of all users of Kaspersky Lab products attacked by Trojan-Ransom malware.
Wannacry (16.78%) tops the rating for Q3, and the odds are that it’s set to remain there: the worm has been propagating uncontrollably, and there are still huge numbers of computers across the globe with the unpatched vulnerability that Wannacry exploits.
Crypton (14.41%) came second. This cryptor emerged in spring 2016 and has undergone many modifications since. It has also been given multiple names: CryptON, JuicyLemon, PizzaCrypts, Nemesis, x3m, Cry9, Cry128, Cry36.
The cryptor Purgen (6.90%) rounds off the top three after rising from ninth. The rest of the rating is populated by ‘old timers’ – the Trojans Locky, Cerber, Cryrar, Shade, and Spora.
The Jaff cryptor appeared in the spring of 2017, going straight into fourth place in the Q2 rating, and then stopped spreading just as suddenly.
Top 10 countries where online resources are seeded with malware
The following statistics are based on the physical location of the online resources used in attacks and blocked by our antivirus components (web pages containing redirects to exploits, sites containing exploits and other malware, botnet command centers, etc.). Any unique host could be the source of one or more web attacks. In order to determine the geographical source of web-based attacks, domain names are matched against their actual domain IP addresses, and then the geographical location of a specific IP address (GEOIP) is established.
In the third quarter of 2017, Kaspersky Lab solutions blocked 277,646,376 attacks launched from web resources located in 185 countries around the world. 72,012,219 unique URLs were recognized as malicious by web antivirus components.

Distribution of web attack sources by country, Q3 2017
In Q3 2017, the US (3.86%) was home to most sources of web attacks. The Netherlands (25.22%) remained in second place, while Germany moved up from fifth to third. Finland and Singapore dropped out of the top five and were replaced by Ireland (1.36%) and Ukraine (1.36%).
Countries where users faced the greatest risk of online infection
In order to assess the risk of online infection faced by users in different countries, we calculated the percentage of Kaspersky Lab users in each country who encountered detection verdicts on their machines during the quarter. The resulting data provides an indication of the aggressiveness of the environment in which computers work in different countries.
This rating only includes attacks by malicious programs that fall under the Malware class. The rating does not include web antivirus module detections of potentially dangerous or unwanted programs such as RiskTool or adware.
| Country* | % of users attacked** | |
| 1 | Belarus | 27.35 |
| 2 | Algeria | 24.23 |
| 3 | Russia | 23.91 |
| 4 | Armenia | 23.74 |
| 5 | Moldova | 23.61 |
| 6 | Greece | 21.48 |
| 7 | Azerbaijan | 21.14 |
| 8 | Kyrgyzstan | 20.83 |
| 9 | Uzbekistan | 20.24 |
| 10 | Albania | 20.10 |
| 11 | Ukraine | 19.82 |
| 12 | Kazakhstan | 19.55 |
| 13 | France | 18.94 |
| 14 | Venezuela | 18.68 |
| 15 | Brazil | 18.01 |
| 16 | Portugal | 17.93 |
| 17 | Vietnam | 17.81 |
| 18 | Tajikistan | 17.63 |
| 19 | Georgia | 17.50 |
| 20 | India | 17.43 |
These statistics are based on detection verdicts returned by the web antivirus module, received from users of Kaspersky Lab products who have consented to provide their statistical data.
* These calculations excluded countries where the number of Kaspersky Lab users is relatively small (under 10,000 users).
** Unique users whose computers have been targeted by Malware-class attacks as a percentage of all unique users of Kaspersky Lab products in the country.
On average, 16.61% of computers connected to the Internet globally were subjected to at least one Malware-class web attack during the quarter.

Geography of malicious web attacks in Q3 2017 (ranked by percentage of users attacked)
The countries with the safest online surfing environments included Iran (9.06%), Singapore (8.94%), Puerto Rico (6.67%), Niger (5.14%) and Cuba (4.44%).
Local threats
Local infection statistics for user computers are a very important indicator: they reflect threats that have penetrated computer systems by infecting files or removable media, or initially got on the computer in an encrypted format (for example, programs integrated in complex installers, encrypted files, etc.).
Data in this section is based on analyzing statistics produced by antivirus scans of files on the hard drive at the moment they were created or accessed, and the results of scanning removable storage media.
In Q3 2017, Kaspersky Lab’s file antivirus detected 198,228,428 unique malicious and potentially unwanted objects.
Countries where users faced the highest risk of local infection
For each country, we calculated the percentage of Kaspersky Lab product users on whose computers the file antivirus was triggered during the quarter. These statistics reflect the level of personal computer infection in different countries.
The rating of malicious programs only includes Malware-class attacks. The rating does not include web antivirus module detections of potentially dangerous or unwanted programs such as RiskTool or adware.
| Country* | % of users attacked** | |
| 1 | Yemen | 56.89 |
| 2 | Vietnam | 54.32 |
| 3 | Afghanistan | 53.25 |
| 4 | Uzbekistan | 53.02 |
| 5 | Laos | 52.72 |
| 6 | Tajikistan | 49.72 |
| 7 | Ethiopia | 48.90 |
| 8 | Syria | 47.71 |
| 9 | Myanmar | 46.82 |
| 10 | Cambodia | 46.69 |
| 11 | Iraq | 45.79 |
| 12 | Turkmenistan | 45.47 |
| 13 | Libya | 45.00 |
| 14 | Bangladesh | 44.54 |
| 15 | China | 44.40 |
| 16 | Sudan | 44.27 |
| 17 | Mongolia | 44.18 |
| 18 | Mozambique | 43.84 |
| 19 | Rwanda | 43.22 |
| 20 | Belarus | 42.53 |
These statistics are based on detection verdicts returned by on-access and on-demand antivirus modules, received from users of Kaspersky Lab products who have consented to provide their statistical data. The data include detections of malicious programs located on users’ computers or on removable media connected to the computers, such as flash drives, camera and phone memory cards, or external hard drives.
* These calculations exclude countries where the number of Kaspersky Lab users is relatively small (under 10,000 users).
** The percentage of unique users in the country with computers that blocked Malware-class local threats as a percentage of all unique users of Kaspersky Lab products.
This Top 20 of countries has not changed much since Q2, with the exception of China (44.40%), Syria (47.71%) and Libya (45.00%) all making an appearance. The proportion of users attacked in Russia amounted to 29.09%.
On average, 23.39% of computers globally faced at least one Malware-class local threat during the third quarter.

Geography of local malware attacks in Q3 2017 (ranked by percentage of users attacked)
The safest countries in terms of local infection risks included Estonia (15.86%), Singapore (11.97%), New Zealand (9.24%), Czechia (7.89%), Ireland (6.86%) and Japan (5.79%).
All the statistics used in this report were obtained using Kaspersky Security Network (KSN), a distributed antivirus network that works with various anti-malware protection components. The data was collected from KSN users who agreed to provide it. Millions of Kaspersky Lab product users from 213 countries and territories worldwide participate in this global exchange of information about malicious activity.
Table of Contents
- Q3 figures
- Mobile threats
- Q3 events
- The spread of the Asacub banker
- New capabilities of mobile banking Trojans
- The growth of WAP billing subscriptions
- Mobile threat statistics
- Vulnerable apps exploited by cybercriminals
- Online threats (Web-based attacks)
- Online threats in the banking sector
- Cryptoware programs
- Q3 highlights
- Crysis rises from the dead
- Surge in Cryrar attacks
- Master key to original versions of Petya/Mischa/GoldenEye published
- The number of new modifications
- The number of users attacked by ransomware
- The geography of attacks
- Top 10 countries attacked by cryptors
- Top 10 most widespread cryptor families
- Top 10 countries where online resources are seeded with malware
- Local threats
From the same authors


In the same category


IT threat evolution Q3 2017. Statistics