

Q2 figures
According to KSN:
- Kaspersky Lab solutions blocked 962,947,023 attacks launched from online resources located in 187 countries across the globe.
- 351,913,075 unique URLs were recognized as malicious by Web Anti-Virus components.
- Attempted infections by malware designed to steal money via online access to bank accounts were logged on the computers of 215,762 users.
- Ransomware attacks were registered on the computers of 158,921 unique users.
- Our File Anti-Virus logged 192,053,604 unique malicious and potentially unwanted objects.
- Kaspersky Lab products for mobile devices detected:
- 1,744,244 malicious installation packages
- 61,045 installation packages for mobile banking Trojans
- 14,119 installation packages for mobile ransomware Trojans.
Mobile threats
General statistics
In Q2 2018, Kaspersky Lab detected 1,744,244 malicious installation packages, which is 421,666 packages more than in the previous quarter.

Number of detected malicious installation packages, Q2 2017 – Q2 2018
Distribution of detected mobile apps by type
Distribution of newly detected mobile apps by type, Q1 2018

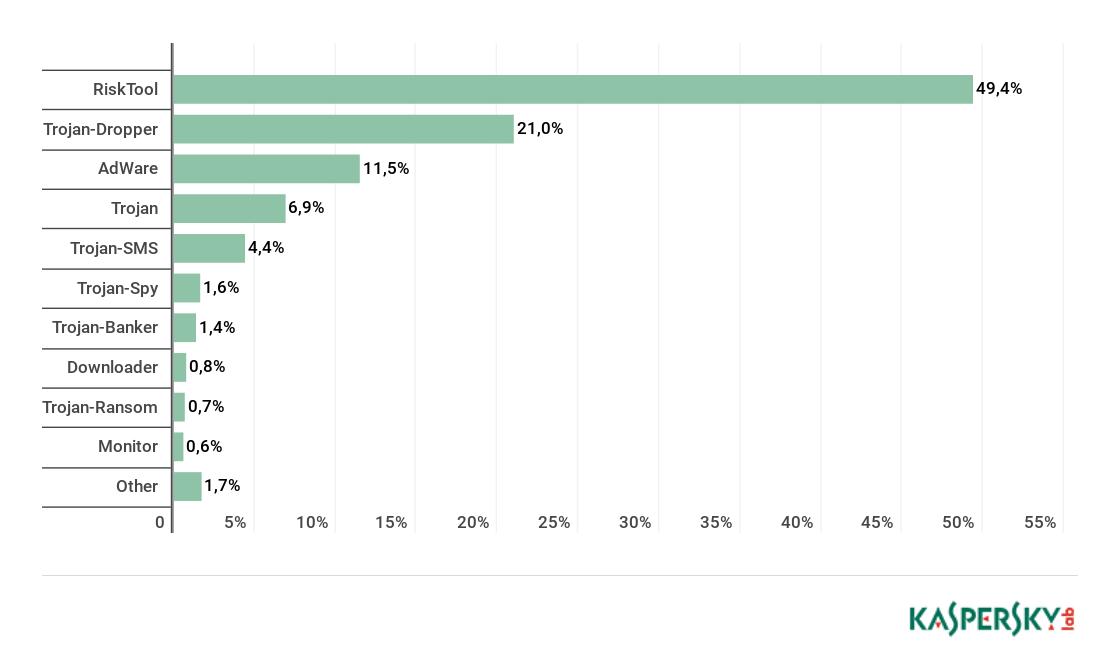
Distribution of newly detected mobile apps by type, Q2 2018
Among all the threats detected in Q2 2018, the lion’s share belonged to potentially unwanted RiskTool apps (55.3%); compared to the previous quarter, their share rose by 6 p.p. Members of the RiskTool.AndroidOS.SMSreg family contributed most to this indicator.
Second place was taken by Trojan-Dropper threats (13%), whose share fell by 7 p.p. Most detected files of this type came from the families Trojan-Dropper.AndroidOS.Piom and Trojan-Dropper.AndroidOS.Hqwar.
The share of advertising apps continued to decreased by 8%, accounting for 9% (against 11%) of all detected threats.
A remarkable development during the reporting period was that SMS Trojans doubled their share up to 8.5% in Q2 from 4.5% in Q1.
TOP 20 mobile malware
Note that this malware rating does not include potentially dangerous or unwanted programs such as RiskTool or Adware.
| Verdict | %* | |
| 1 | DangerousObject.Multi.Generic | 70.04 |
| 2 | Trojan.AndroidOS.Boogr.gsh | 12.17 |
| 3 | Trojan-Dropper.AndroidOS.Lezok.p | 4.41 |
| 4 | Trojan.AndroidOS.Agent.rx | 4.11 |
| 5 | Trojan.AndroidOS.Piom.toe | 3.44 |
| 6 | Trojan.AndroidOS.Triada.dl | 3.15 |
| 7 | Trojan.AndroidOS.Piom.tmi | 2.71 |
| 8 | Trojan.AndroidOS.Piom.sme | 2.69 |
| 9 | Trojan-Dropper.AndroidOS.Hqwar.i | 2.54 |
| 10 | Trojan-Downloader.AndroidOS.Agent.ga | 2.42 |
| 11 | Trojan-Dropper.AndroidOS.Agent.ii | 2.25 |
| 12 | Trojan-Dropper.AndroidOS.Hqwar.ba | 1.80 |
| 13 | Trojan.AndroidOS.Agent.pac | 1.73 |
| 14 | Trojan.AndroidOS.Dvmap.a | 1.64 |
| 15 | Trojan-Dropper.AndroidOS.Lezok.b | 1.55 |
| 16 | Trojan-Dropper.AndroidOS.Tiny.d | 1.37 |
| 17 | Trojan.AndroidOS.Agent.rt | 1.29 |
| 18 | Trojan.AndroidOS.Hiddapp.bn | 1.26 |
| 19 | Trojan.AndroidOS.Piom.rfw | 1.20 |
| 20 | Trojan-Dropper.AndroidOS.Lezok.t | 1.19 |
* Unique users attacked by the relevant malware as a percentage of all users of Kaspersky Lab’s mobile antivirus that were attacked.
As before, first place in our TOP 20 went to DangerousObject.Multi.Generic (70.04%), the verdict we use for malware detected using cloud technologies. In second place was Trojan.AndroidOS.Boogr.gsh (12.17%). This verdict is given to files recognized as malicious by our system based on machine learning. Third was Dropper.AndroidOS.Lezok.p (4.41%), followed by a close 0.3 p.p. margin by Trojan.AndroidOS.Agent.rx (4.11%), which was in the third position in Q1.
Geography of mobile threats

Map of attempted infections using mobile malware, Q2 2018
TOP 10 countries by share of users attacked by mobile malware:
| Country* | %** | |
| 1 | Bangladesh | 31.17 |
| 2 | China | 31.07 |
| 3 | Iran | 30.87 |
| 4 | Nepal | 30.74 |
| 5 | Nigeria | 25.66 |
| 6 | India | 25.04 |
| 7 | Indonesia | 24.05 |
| 8 | Ivory Coast | 23.67 |
| 9 | Pakistan | 23.49 |
| 10 | Tanzania | 22.38 |
* Excluded from the rating are countries with relatively few users of Kaspersky Lab’s mobile antivirus (under 10,000).
** Unique users attacked in the country as a percentage of all users of Kaspersky Lab’s mobile antivirus in the country.
In Q2 2018, Bangladesh (31.17%) topped the list by share of mobile users attacked. China (31.07%) came second with a narrow margin. Third and fourth places were claimed respectively by Iran (30.87%) and Nepal (30.74%).
Russia (8.34%) this quarter was down in 38th spot, behind Taiwan (8.48%) and Singapore (8.46%).
Mobile banking Trojans
In the reporting period, we detected 61,045 installation packages for mobile banking Trojans, which is 3.2 times more than in Q1 2018. The largest contribution was made by Trojan-Banker.AndroidOS.Hqwar.jck – this verdict was given to nearly half of detected new banking Trojans. Second came Trojan-Banker.AndroidOS.Agent.dq, accounting for about 5,000 installation packages.
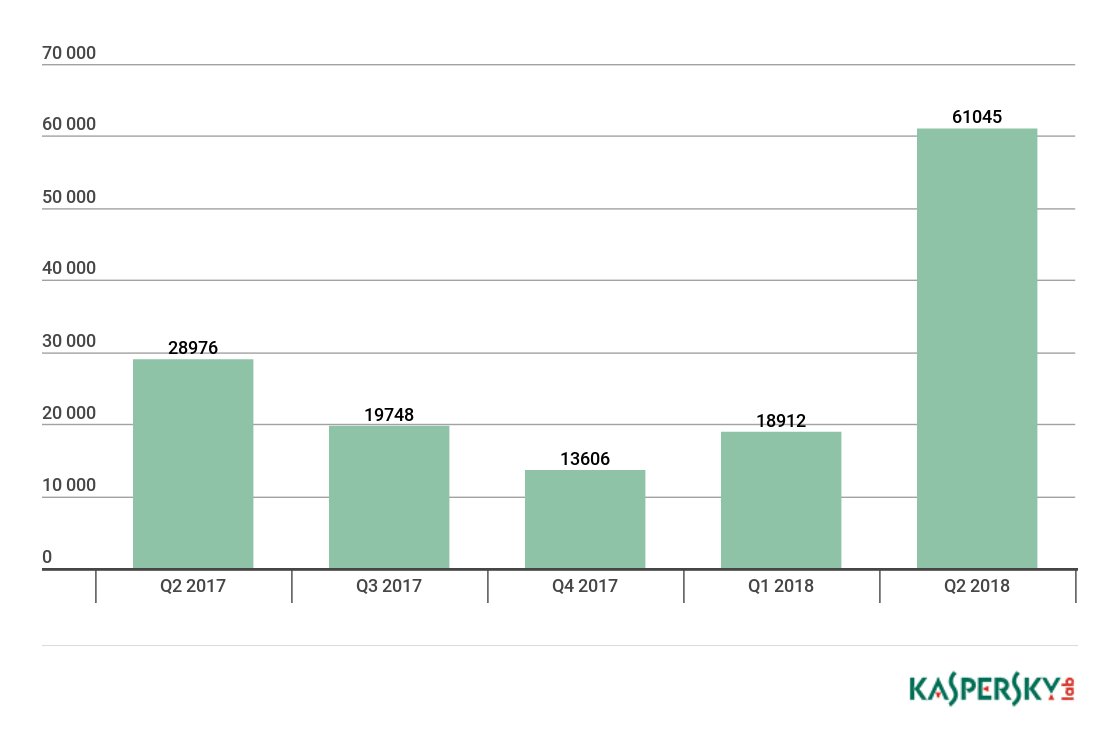
Number of installation packages for mobile banking Trojans detected by Kaspersky Lab, Q2 2017 – Q2 2018
TOP 10 mobile bankers
| Verdict | %* | |
| 1 | Trojan-Banker.AndroidOS.Agent.dq | 17.74 |
| 2 | Trojan-Banker.AndroidOS.Svpeng.aj | 13.22 |
| 3 | Trojan-Banker.AndroidOS.Svpeng.q | 8.56 |
| 4 | Trojan-Banker.AndroidOS.Asacub.e | 5.70 |
| 5 | Trojan-Banker.AndroidOS.Agent.di | 5.06 |
| 6 | Trojan-Banker.AndroidOS.Asacub.bo | 4.65 |
| 7 | Trojan-Banker.AndroidOS.Faketoken.z | 3.66 |
| 8 | Trojan-Banker.AndroidOS.Asacub.bj | 3.03 |
| 9 | Trojan-Banker.AndroidOS.Hqwar.t | 2.83 |
| 10 | Trojan-Banker.AndroidOS.Asacub.ar | 2.77 |
* Unique users attacked by the relevant malware as a percentage of all users of Kaspersky Lab’s mobile antivirus that were attacked by banking threats.
The most popular mobile banking Trojan in Q2 was Trojan-Banker.AndroidOS.Agent.dq (17.74%), closely followed by Trojan-Banker.AndroidOS.Svpeng.aj (13.22%). These two Trojans use phishing windows to steal information about user’s banking cards and online banking credentials. Besides, they steal money through abuse of SMS services, including mobile banking. The popular banking malware Trojan-Banker.AndroidOS.Svpeng.q (8.56%) took third place in the rating, moving one notch down from its second place in Q2.
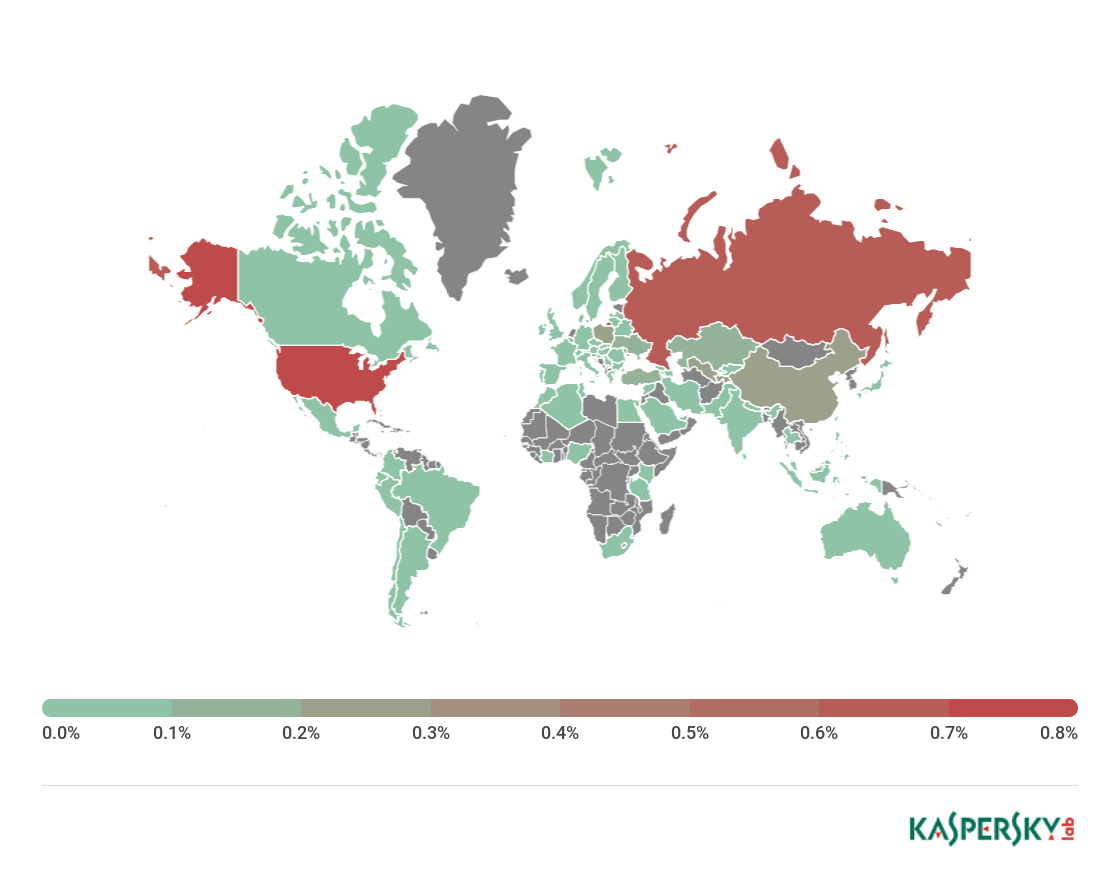
Geography of mobile banking threats, Q2 2018
TOP 10 countries by share of users attacked by mobile banking Trojans
| Country* | %** | |
| 1 | USA | 0.79 |
| 2 | Russia | 0.70 |
| 3 | Poland | 0.28 |
| 4 | China | 0.28 |
| 5 | Tajikistan | 0.27 |
| 6 | Uzbekistan | 0.23 |
| 7 | Ukraine | 0.18 |
| 8 | Singapore | 0.16 |
| 9 | Moldova | 0.14 |
| 10 | Kazakhstan | 0.13 |
* Excluded from the rating are countries with relatively few users of Kaspersky Lab’s mobile antivirus (under 10,000).
** Unique users attacked by mobile banking Trojans in the country as a percentage of all users of Kaspersky Lab’s mobile antivirus in this country.
Overall, the rating did not see much change from Q1: Russia (0.70%) and USA (0.79%) swapped places, both remaining in TOP 3.
Poland (0.28%) rose from ninth to third place thanks to activation propagation of two Trojans: Trojan-Banker.AndroidOS.Agent.cw and Trojan-Banker.AndroidOS.Marcher.w. The latter was first detected in November 2017 and uses a toolset typical of banking malware: SMS interception, phishing windows and Device Administrator privileges to ensure its persistence in the system.
Mobile ransomware Trojans
In Q2 2018, we detected 14,119 installation packages for mobile ransomware Trojans, which is larger by half than in Q1.

Number of installation packages for mobile ransomware Trojans detected by Kaspersky Lab, Q2 2017 – Q2 2018
| Verdict | %* | |
| 1 | Trojan-Ransom.AndroidOS.Zebt.a | 26.71 |
| 2 | Trojan-Ransom.AndroidOS.Svpeng.ag | 19.15 |
| 3 | Trojan-Ransom.AndroidOS.Fusob.h | 15.48 |
| 4 | Trojan-Ransom.AndroidOS.Svpeng.ae | 5.99 |
| 5 | Trojan-Ransom.AndroidOS.Egat.d | 4.83 |
| 6 | Trojan-Ransom.AndroidOS.Svpeng.snt | 4.73 |
| 7 | Trojan-Ransom.AndroidOS.Svpeng.ab | 4.29 |
| 8 | Trojan-Ransom.AndroidOS.Small.cm | 3.32 |
| 9 | Trojan-Ransom.AndroidOS.Small.as | 2.61 |
| 10 | Trojan-Ransom.AndroidOS.Small.cj | 1.80 |
* Unique users attacked by this malware as a percentage of all users of Kaspersky Lab’s mobile antivirus attacked by ransomware Trojans.
The most popular mobile ransomware is Q2 was Trojan-Ransom.AndroidOS.Zebt.a (26.71%), encountered by more than a quarter of all users who got attacked by this type of malware. Second came Trojan-Ransom.AndroidOS.Svpeng.ag (19.15%), nudging ahead of once-popular Trojan-Ransom.AndroidOS.Fusob.h (15.48%).

Geography of mobile ransomware Trojans, Q2 2018
TOP 10 countries by share of users attacked by mobile ransomware Trojans
| Country* | %** | |
| 1 | USA | 0.49 |
| 2 | Italy | 0.28 |
| 3 | Kazakhstan | 0.26 |
| 4 | Belgium | 0.22 |
| 5 | Poland | 0.20 |
| 6 | Romania | 0.18 |
| 7 | China | 0.17 |
| 8 | Ireland | 0.15 |
| 9 | Mexico | 0.11 |
| 10 | Austria | 0.09 |
* Excluded from the rating are countries where the number of users of Kaspersky Lab’s mobile antivirus is relatively small (fewer than 10,000)
** Unique users in the country attacked by mobile ransomware Trojans as a percentage of all users of Kaspersky Lab’s mobile antivirus in the country.
First place in the TOP 10 went to the United States (0.49%); the most active family in this country was Trojan-Ransom.AndroidOS.Svpeng:
| Verdict | %* | |
| 1 | Trojan-Ransom.AndroidOS.Svpeng.ag | 53.53% |
| 2 | Trojan-Ransom.AndroidOS.Svpeng.ae | 16.37% |
| 3 | Trojan-Ransom.AndroidOS.Svpeng.snt | 11.49% |
| 4 | Trojan-Ransom.AndroidOS.Svpeng.ab | 10.84% |
| 5 | Trojan-Ransom.AndroidOS.Fusob.h | 5.62% |
| 6 | Trojan-Ransom.AndroidOS.Svpeng.z | 4.57% |
| 7 | Trojan-Ransom.AndroidOS.Svpeng.san | 4.29% |
| 8 | Trojan-Ransom.AndroidOS.Svpeng.ac | 2.45% |
| 9 | Trojan-Ransom.AndroidOS.Svpeng.h | 0.43% |
| 10 | Trojan-Ransom.AndroidOS.Zebt.a | 0.37% |
* Unique users in USA attacked by this malware as a percentage of all users of Kaspersky Lab’s mobile antivirus in this country who were attacked by ransomware Trojans.
Italy (0.28%) came second among countries whose residents were attacked by mobile ransomware. In this country, most attacks were the work of Trojan-Ransom.AndroidOS.Zebt.a. Third place was claimed by Kazakhstan (0.63%), where Trojan-Ransom.AndroidOS.Small.cm was the most popular mobile ransomware.
Attacks on IoT devices
Judging by the data from our honeypots, brute forcing Telnet passwords is the most popular method of IoT malware self-propagation. However, recently there has been an increase in the number of attacks against other services, such as control ports. These ports are assigned services for remote control over routers – this feature is in demand e.g. with internet service providers. We have observed attempts to launch attacks on IoT devices via port 8291, which is used by Mikrotik RouterOS control service, and via port 7547 (TR-069), which was used, among other purposes, for managing devices in the Deutsche Telekom network.
In both cases the nature of attacks was much more sophisticated than plain brute force; in particular, they involved exploits. We are inclined to think that the number of such attacks will only grow in the future on the back of the following two factors:
- Brute forcing a Telnet password is a low-efficiency strategy, as there is a strong competition between threat actors. Each few seconds, there are brute force attempts; once successful, the threat actor blocks such the access to Telnet for all other attackers.
- After each restart of the device, the attackers have to re-infect it, thus losing part of the botnet and having to reclaim it in a competitive environment.
On the other hand, the first attacker to exploit a vulnerability will gain access to a large number of device, having spent minimum time.

Distribution of attacked services’ popularity by number of unique attacking devices, Q2 2018
Telnet attacks
The scheme of attack is as follows: the attackers find a victim device, check if Telnet port is open on it, and launch the password brute forcing routine. As many manufacturers of IoT devices neglect security (for instance, they reserve service passwords on devices and do not leave a possibility for the user to change them routinely), such attacks become successful and may affect entire lines of devices. The infected devices start scanning new segments of networks and infect new, similar devices or workstations in them.

Geography of IoT devices infected in Telnet attacks, Q2 2018
TOP 10 countries by shares of IoT devices infected via Telnet
| Country | %* | |
| 1 | Brazil | 23.38 |
| 2 | China | 17.22 |
| 3 | Japan | 8.64 |
| 4 | Russia | 7.22 |
| 5 | USA | 4.55 |
| 6 | Mexico | 3.78 |
| 7 | Greece | 3.51 |
| 8 | South Korea | 3.32 |
| 9 | Turkey | 2.61 |
| 10 | India | 1.71 |
* Infected devices in each specific country as a percentage of all IoT devices that attack via Telnet.
In Q2, Brazil (23.38%) took the lead in the number of infected devices and, consequently, in the number of Telnet attacks. Next came China (17.22%) by a small margin, and third came Japan (8.64%).
In these attacks, the threat actors most often downloaded Backdoor.Linux.Mirai.c (15.97%) to the infected devices.
TOP 10 malware downloaded to infected IoT devices in successful Telnet attacks
| Verdict | %* | |
| 1 | Backdoor.Linux.Mirai.c | 15.97 |
| 2 | Trojan-Downloader.Linux.Hajime.a | 5.89 |
| 3 | Trojan-Downloader.Linux.NyaDrop.b | 3.34 |
| 4 | Backdoor.Linux.Mirai.b | 2.72 |
| 5 | Backdoor.Linux.Mirai.ba | 1.94 |
| 6 | Trojan-Downloader.Shell.Agent.p | 0.38 |
| 7 | Trojan-Downloader.Shell.Agent.as | 0.27 |
| 8 | Backdoor.Linux.Mirai.n | 0.27 |
| 9 | Backdoor.Linux.Gafgyt.ba | 0.24 |
| 10 | Backdoor.Linux.Gafgyt.af | 0.20 |
*Proportion of downloads of each specific malware program to IoT devices in successful Telnet attacks as a percentage of all malware downloads in such attacks
SSH attacks
Such attacks are launched similarly to Telnet attacks, the only difference being that they require to bots to have an SSH client installed on them to brute force credentials. The SSH protocol is cryptographically protected, so brute forcing passwords require large computational resources. Therefore, self-propagation from IoT devices is inefficient, and full-fledged servers are used to launch attacks. The success of an SSH attack hinges on the device owner or manufacturers’ faults; in other words, these are again weak passwords or preset passwords assigned by the manufacturer to an entire line of devices.
China took the lead in terms of infected devices attacking via SSH. Also, China was second in terms of infected devices attacking via Telnet.

Geography of IoT devices infected in SSH attacks, Q2 2018
TOP 10 countries by shares of IoT devices attacked via SSH
| Country | %* | |
| 1 | China | 15.77% |
| 2 | Vietnam | 11.38% |
| 3 | USA | 9.78% |
| 4 | France | 5.45% |
| 5 | Russia | 4.53% |
| 6 | Brazil | 4.22% |
| 7 | Germany | 4.01% |
| 8 | South Korea | 3.39% |
| 9 | India | 2.86% |
| 10 | Romania | 2.23% |
*The proportion of infected devices in each country as a percentage of all infected IoT devices attacking via SSH
Online threats in the financial sector
Q2 events
New banking Trojan DanaBot
The Trojan DanaBot was detected in May. It has a modular structure and is capable of loading extra modules with which to intercept traffic, steal passwords and crypto wallets – generally, a standard feature set for this type of a threat. The Trojan spread via spam messages containing a malicious office document, which subsequently loaded the Trojans’ main body. DanaBot initially targeted Australian users and financial organizations, however in early April we noticed that it had become active against the financial organizations in Poland.
The peculiar BackSwap technique
The banking Trojan BackSwap turned out much more interesting. A majority of similar threats including Zeus, Cridex and Dyreza intercept the user’s traffic either to inject malicious scripts into the banking pages visited by the victim or to redirect it to phishing sites. By contrast, BackSwap uses an innovative technique for injecting malicious scripts: using WinAPI, it emulates keystrokes to open the developer console in the browser, and then it uses this console to inject malicious scripts into web pages. In a later version of BackSwap, malicious scripts are injected via the address bar, using JavaScript protocol URLs.
Carbanak gang leader detained
On March 26, Europol announced the arrest of a leader of the cybercrime gang behind Carbanak and Cobalt Goblin. This came as a result of a joint operation between Spain’s national police, Europol and FBI, as well as Romanian, Moldovan, Belorussian and Taiwanese authorities and private infosecurity companies. It was expected that the leader’s arrest would reduce the group’s activity, however recent data show that no appreciable decline has taken place. In May and June, we detected several waves of targeted phishing against banks and processing companies in Eastern Europe. The email writers from Carbanak masquerades as support lines of reputable anti-malware vendors, European Central Bank and other organizations. Such emails contained attached weaponized documents exploiting vulnerabilities CVE-2017-11882 and CVE-2017-8570.
Ransomware Trojan uses Doppelgänging technique
Kaspersky Lab experts detected a case of the ransomware Trojan SynAck using the Process Doppelgänging technique. Malware writers use this complex technique to make it stealthier and complicate its detection by security solutions. This was the first case when it was used in a ransomware Trojan.
Another remarkable event was the Purga (aka Globe) cryptoware propagation campaign, during which this cryptoware, alongside with other malware including a banking Trojan, was loaded to computers infected with the Trojan Dimnie.
General statistics on financial threats
These statistics are based on detection verdicts of Kaspersky Lab products received from users who consented to provide statistical data.
In Q2 2018, Kaspersky Lab solutions blocked attempts to launch one or more malicious programs designed to steal money from bank accounts on the computers of 215,762 users.
Number of unique users attacked by financial malware, Q2 2018
Geography of attacks
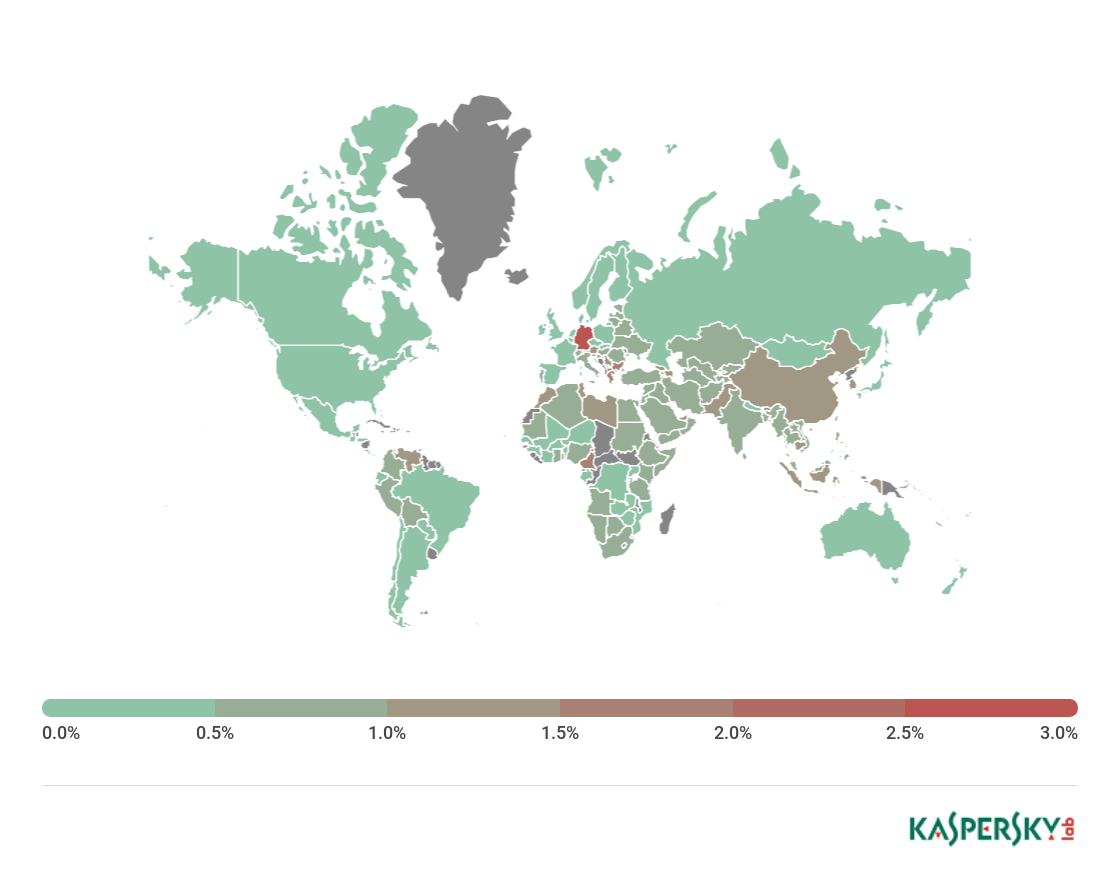
Geography of banking malware attacks, Q2 2018
TOP 10 countries by percentage of attacked users
| Country* | % of users attacked** | |
| 1 | Germany | 2.7% |
| 2 | Cameroon | 1.8% |
| 3 | Bulgaria | 1.7% |
| 4 | Greece | 1.6% |
| 5 | United Arab Emirates | 1.4% |
| 6 | China | 1.3% |
| 7 | Indonesia | 1.3% |
| 8 | Libya | 1.3% |
| 9 | Togo | 1.3% |
| 10 | Lebanon | 1.2% |
These statistics are based on Anti-Virus detection verdicts received from users of Kaspersky Lab products who consented to provide statistical data.
*Excluded are countries with relatively few Kaspersky Lab’ product users (under 10,000).
** Unique Kaspersky Lab users whose computers were targeted by banking Trojans or ATM/PoS malware as a percentage of all unique users of Kaspersky Lab products in the country.
TOP 10 banking malware families
| Name | Verdicts* | % of attacked users** | ||
| 1 | Nymaim | Trojan.Win32. Nymaim | 27.0% | |
| 2 | Zbot | Trojan.Win32. Zbot | 26.1% | |
| 3 | SpyEye | Backdoor.Win32. SpyEye | 15.5% | |
| 4 | Emotet | Backdoor.Win32. Emotet | 5.3% | |
| 5 | Caphaw | Backdoor.Win32. Caphaw | 4.7% | |
| 6 | Neurevt | Trojan.Win32. Neurevt | 4.7% | |
| 7 | NeutrinoPOS | Trojan-Banker.Win32.NeutrinoPOS | 3.3% | |
| 8 | Gozi | Trojan.Win32. Gozi | 2.0% | |
| 9 | Shiz | Backdoor.Win32. Shiz | 1.5% | |
| 10 | ZAccess | Backdoor.Win32. ZAccess | 1.3% |
* Detection verdicts of Kaspersky Lab products. The information was provided by Kaspersky Lab product users who consented to provide statistical data.
** Unique users attacked by this malware as a percentage of all users attacked by financial malware.
In Q2 2018, the general makeup of TOP 10 stayed the same, however there were some changes in the ranking. Trojan.Win32.Zbot (26.1%) and Trojan.Win32.Nymaim (27%) remain in the lead after swapping positions. The banking Trojan Emotet ramped up its activity and, accordingly, its share of attacked users from 2.4% to 5.3%. Conversely, Caphaw dramatically downsized its activity to only 4.7% from 15.2% in Q1, taking fifth position in the rating.
Cryptoware programs
Number of new modifications
In Q2, we detected 7,620 new cryptoware modifications. This is higher than in Q1, but still well below last year’s numbers.

Number of new cryptoware modifications, Q2 2017 – Q2 2018
Number of users attacked by Trojan cryptors
In Q2 2018, Kaspersky Lab products blocked cryptoware attacks on the computers of 158,921 unique users. Our statistics show that cybercriminals’ activity declined both against Q1 and on a month-on-month basis during Q2.

Number of unique users attacked by cryptors, Q2 2018
Geography of attacks

TOP 10 countries attacked by Trojan cryptors
| Country* | % of users attacked by cryptors** | |
| 1 | Ethiopia | 2.49 |
| 2 | Uzbekistan | 1.24 |
| 3 | Vietnam | 1.21 |
| 4 | Pakistan | 1.14 |
| 5 | Indonesia | 1.09 |
| 6 | China | 1.04 |
| 7 | Venezuela | 0.72 |
| 8 | Azerbaijan | 0.71 |
| 9 | Bangladesh | 0.70 |
| 10 | Mongolia | 0.64 |
* Excluded are countries with relatively few Kaspersky Lab users (under 50,000).
** Unique users whose computers were attacked by Trojan cryptors as a percentage of all unique users of Kaspersky Lab products in the country.
The list of TOP 10 countries in Q2 is practically identical to that in Q1. However, some place trading occurred in TOP 10: Ethiopia (2.49%) pushed Uzbekistan (1.24%) down from first to second place, while Pakistan (1.14%) rose to fourth place. Vietnam (1.21%) remained in third position, and Indonesia (1.09%) remained fifth.
TOP 10 most widespread cryptor families
| Name | Verdicts* | % of attacked users** | |||
| 1 | WannaCry | Trojan-Ransom.Win32.Wanna | 53.92 | ||
| 2 | GandCrab | Trojan-Ransom.Win32.GandCrypt | 4.92 | ||
| 3 | PolyRansom/VirLock | Virus.Win32.PolyRansom | 3.81 | ||
| 4 | Shade | Trojan-Ransom.Win32.Shade | 2.40 | ||
| 5 | Crysis | Trojan-Ransom.Win32.Crusis | 2.13 | ||
| 6 | Cerber | Trojan-Ransom.Win32.Zerber | 2.09 | ||
| 7 | (generic verdict) | Trojan-Ransom.Win32.Gen | 2.02 | ||
| 8 | Locky | Trojan-Ransom.Win32.Locky | 1.49 | ||
| 9 | Purgen/GlobeImposter | Trojan-Ransom.Win32.Purgen | 1.36 | ||
| 10 | Cryakl | Trojan-Ransom.Win32.Cryakl | 1.04 | ||
* Statistics are based on detection verdicts of Kaspersky Lab products. The information was provided by Kaspersky Lab product users who consented to provide statistical data.
** Unique Kaspersky Lab users attacked by a particular family of Trojan cryptors as a percentage of all users attacked by Trojan cryptors.
WannaCry further extends lead over other cryptor families, its share rising to 53.92% from 38.33% in Q1. Meanwhile, the cybercriminals behind GandCrab (4.92%, emerged only in Q1 2018) put so much effort into its distribution that it rose all the way up to second place in this TOP 10, displacing the polymorphic worm PolyRansom (3.81%). The remaining positions, just like in Q1, are occupied by the long-familiar cryptors Shade, Crysis, Purgen, Cryakl etc.
Cryptominers
As we already reported in Ransomware and malicious cryptominers in 2016-2018, ransomware is shrinking progressively, and cryptocurrency miners is starting to take its place. Therefore, this year we decided to begin to publish quarterly reports on the situation around type of threats. Simultaneously, we began to use a broader range of verdicts as a basis for collecting statistics on miners, so the Q2 statistics may not be consistent with the data from our earlier publications. It includes both stealth miners which we detect as Trojans, and those which are issued the verdict ‘Riskware not-a-virus’.
Number of new modifications
In Q2 2018, Kaspersky Lab solutions detected 13,948 new modifications of miners.

Number of new miner modifications, Q2 2018
Number of users attacked by cryptominers
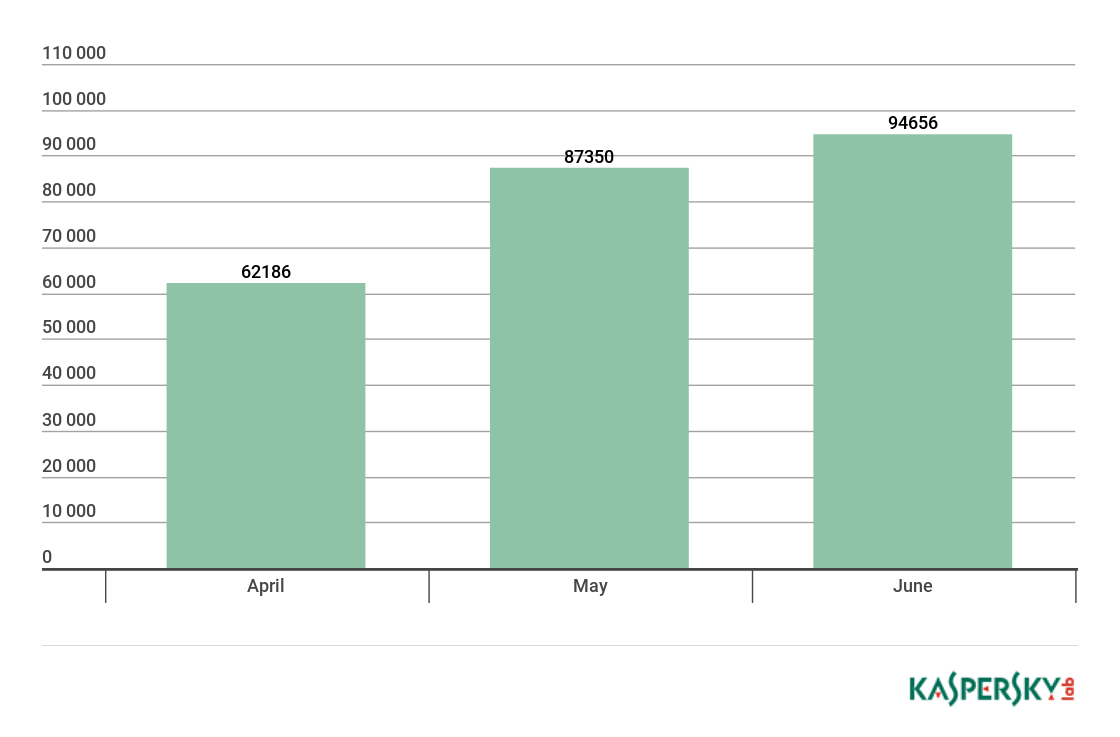
In Q2, we detected attacks involving mining programs on the computers of 2,243,581 Kaspersky Lab users around the world.

Number of unique users attacked by cryptominers, Q2 2018
In April and May, the number of attacked users stayed roughly equal, and in June there was a modest decrease in cryptominers’ activity.
Geography of attacks

Geography of cryptominer attacks, Q2 2018
TOP 10 countries by percentage of attacked users
| Country* | % of attacked users** | |
| 1 | Ethiopia | 17.84 |
| 2 | Afghanistan | 16.21 |
| 3 | Uzbekistan | 14.18 |
| 4 | Kazakhstan | 11.40 |
| 5 | Belarus | 10.47 |
| 6 | Indonesia | 10.33 |
| 7 | Mozambique | 9.92 |
| 8 | Vietnam | 9.13 |
| 9 | Mongolia | 9.01 |
| 10 | Ukraine | 8.58 |
*Excluded are countries with relatively few Kaspersky Lab’ product users (under 50,000).
** Unique Kaspersky Lab users whose computers were targeted by miners as a percentage of all unique users of Kaspersky Lab products in the country.
Vulnerable apps used by cybercriminals
In Q2 2018, we again observed some major changes in the distribution of platforms most often targeted by exploits. The share of Microsoft Office exploits (67%) doubled compared to Q1 (and quadrupled compared with the average for 2017). Such a sharp growth was driven primarily by massive spam messages distributing documents containing an exploit to the vulnerability CVE-2017-11882. This stack overflow-type vulnerability in the old, deprecated Equation Editor component existed in all versions of Microsoft Office released over the last 18 years. The exploit still works stably in all possible combinations of the Microsoft Office package and Microsoft Windows. On the other hand, it allows the use of various obfuscations for bypassing the protection. These two factors made this vulnerability the most popular tool in cybercriminals’ hands in Q2. The shares of other Microsoft Office vulnerabilities did no undergo much change since Q1.
Q2 KSN statistics also showed a growing number of Adobe Flash exploits exploited via Microsoft Office. Despite Adobe and Microsoft’s efforts to obstruct exploitation of Flash Player, a new 0-day exploit CVE-2018-5002 was discovered in Q2. It propagated in an XLSX file and used a little-known technique allowing the exploit to be downloaded from a remote source rather than carried in the document body. Shockwave Flash (SWF) files, like many other file formats, are rendered in Microsoft Office documents in the OLE (Object Linking and Embedding) format. In the case of a SWF file, the OLE object contains the actual file and a list of various properties, one of which points to the path to the SWF file. The OLE object in the discovered exploit did not contain an SWF file in it, but only carried a list of properties including a web link to the SWF file, which forced Microsoft Office to download the missing file from the provided link.

Distribution of exploits used in cybercriminals’ attacks by types of attacked applications, Q2 2018
In late March 2018, a PDF document was detected at VirusTotal that contained two 0-day vulnerabilities: CVE-2018-4990 and CVE-2018-8120. The former allowed for execution of shellcode from JavaScript via exploitation of a software error in JPEG2000 format image processor in Acrobat Reader. The latter existed in the win32k function SetImeInfoEx and was used for further privilege escalation up to SYSTEM level and enabled the PDF viewer to escape the sandbox. Ana analysis of the document and our statistics show that at the moment of uploading to VirusTotal, this exploit was at the development stage and was not used for in-the-wild attacks.
In late April, Kaspersky Lab experts using an in-house sandbox have found the 0-day vulnerability CVE-2018-8174 in Internet Explorer and reported it to Microsoft. An exploit to this vulnerability used a technique associated with CVE-2017-0199 (launching an HTA script from a remote source via a specially crafted OLE object) to exploit a vulnerable Internet Explorer component with the help of Microsoft Office. We are observing that exploit pack creators have already taken this vulnerability on board and actively distribute exploits to it both via web sites and emails containing malicious documents.
Also in Q2, we observed a growing number of network attacks. There is a growing share of attempts to exploit the vulnerabilities patched with the security update MS17-010; these make up a majority a of the detected network attacks.
Attacks via web resources
The statistics in this chapter are based on Web Anti-Virus, which protects users when malicious objects are downloaded from malicious/infected web pages. Malicious websites are specially created by cybercriminals; web resources with user-created content (for example, forums), as well as hacked legitimate resources, can be infected.
Top 10 countries where online resources are seeded with malware
The following statistics are based on the physical location of the online resources used in attacks and blocked by our antivirus components (web pages containing redirects to exploits, sites containing exploits and other malware, botnet command centers, etc.). Any unique host could be the source of one or more web attacks. In order to determine the geographical source of web-based attacks, domain names are matched against their actual domain IP addresses, and then the geographical location of a specific IP address (GEOIP) is established.
In the second quarter of 2018, Kaspersky Lab solutions blocked 962,947,023 attacks launched from web resources located in 187 countries around the world. 351,913,075 unique URLs were recognized as malicious by web antivirus components.
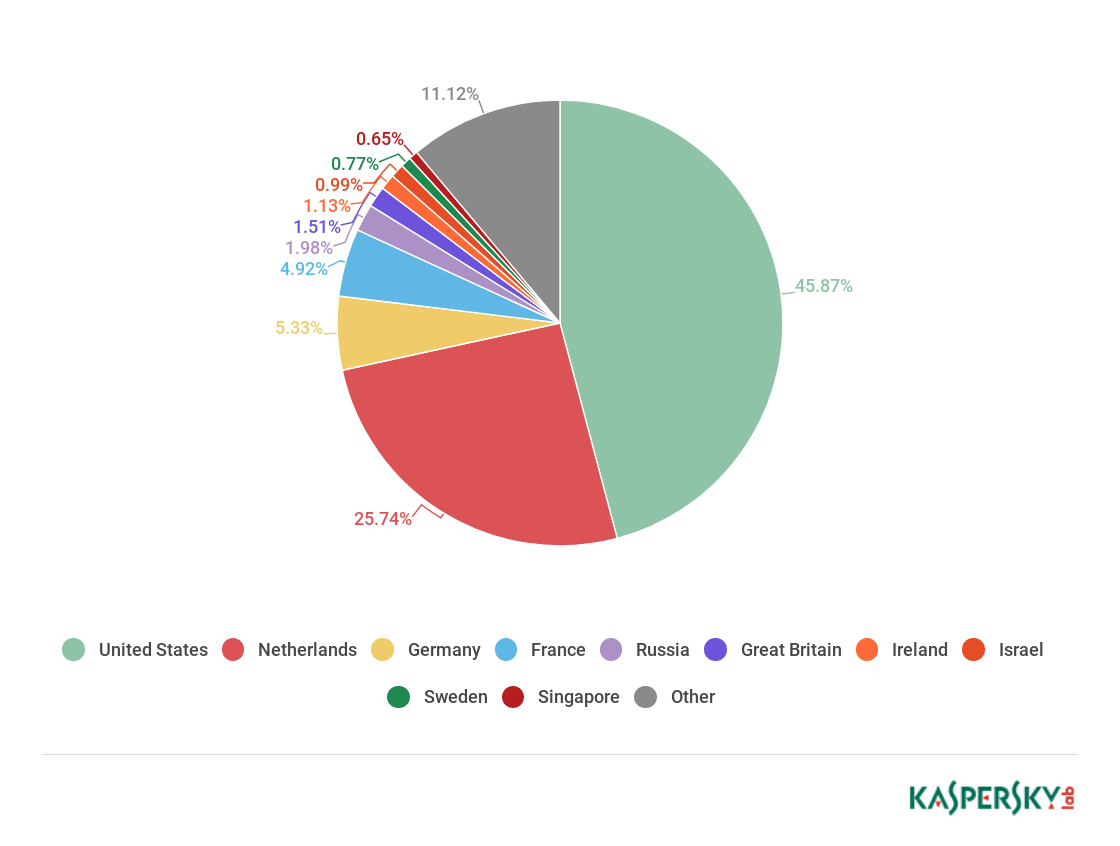
Distribution of web attack sources by country, Q2 2018
In Q2, the TOP 4 of web attack source countries remain unchanged. The US (45.87%) was home to most sources of web attacks. The Netherlands (25.74%) came second by a large margin, Germany (5.33%) was third. There was a change in the fifth position: Russia (1.98%) has displaced the UK, although its share has decreased by 0.55 p.p.
Countries where users faced the greatest risk of online infection
To assess the risk of online infection faced by users in different countries, for each country we calculated the percentage of Kaspersky Lab users on whose computers Web Anti-Virus was triggered during the quarter. The resulting data provides an indication of the aggressiveness of the environment in which computers operate in different countries.
This rating only includes attacks by malicious programs that fall under the Malware class; it does not include Web Anti-Virus detections of potentially dangerous or unwanted programs such as RiskTool or adware.
| Country* | % of attacked users** | |
| 1 | Belarus | 33.49 |
| 2 | Albania | 30.27 |
| 3 | Algeria | 30.08 |
| 4 | Armenia | 29.98 |
| 5 | Ukraine | 29.68 |
| 6 | Moldova | 29.49 |
| 7 | Venezuela | 29.12 |
| 8 | Greece | 29.11 |
| 9 | Kyrgyzstan | 27.25 |
| 10 | Kazakhstan | 26.97 |
| 11 | Russia | 26.93 |
| 12 | Uzbekistan | 26.30 |
| 13 | Azerbaijan | 26.12 |
| 14 | Serbia | 25.23 |
| 15 | Qatar | 24.51 |
| 16 | Latvia | 24.40 |
| 17 | Vietnam | 24.03 |
| 18 | Georgia | 23.87 |
| 19 | Philippines | 23.85 |
| 20 | Romania | 23.55 |
These statistics are based on detection verdicts returned by the Web Anti-Virus module that were received from users of Kaspersky Lab products who consented to provide statistical data.
Excluded are countries with relatively few Kaspersky Lab users (under 10,000).
** Unique users targeted by Malware-class attacks as a percentage of all unique users of Kaspersky Lab products in the country.

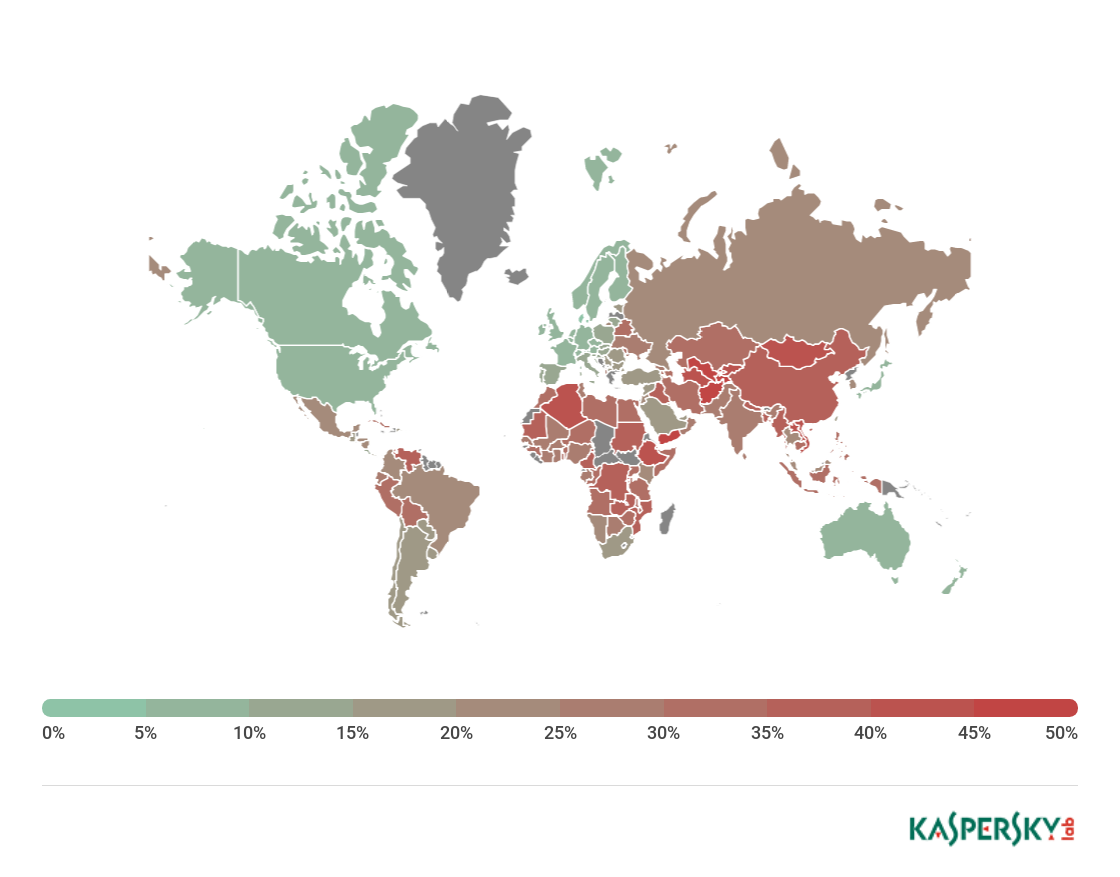
Geography of malicious web attacks in Q2 2018 (percentage of attacked users)
On average, 19.59% of Internet user computers worldwide experienced at least one Malware-class web attack.
Local threats
Local infection statistics for user computers are an important indicator: they reflect threats that have penetrated computer systems by infecting files or removable media, or initially got on the computer in an encrypted format (for example, programs integrated in complex installers, encrypted files, etc.).
Data in this section is based on analyzing statistics produced by Anti-Virus scans of files on the hard drive at the moment they were created or accessed, and the results of scanning removable storage media.
In Q2 2018, our File Anti-Virus detected 192,053,604 malicious and potentially unwanted objects.
Countries where users faced the highest risk of local infection
For each country, we calculated the percentage of Kaspersky Lab product users on whose computers File Anti-Virus was triggered during the reporting period. These statistics reflect the level of personal computer infection in different countries.
The rating includes only Malware-class attacks. It does not include File Anti-Virus detections of potentially dangerous or unwanted programs such as RiskTool or adware.
| Country* | % of attacked users** | |
| 1 | Uzbekistan | 51.01 |
| 2 | Afghanistan | 49.57 |
| 3 | Tajikistan | 46.21 |
| 4 | Yemen | 45.52 |
| 5 | Ethiopia | 43.64 |
| 6 | Turkmenistan | 43.52 |
| 7 | Vietnam | 42.56 |
| 8 | Kyrgyzstan | 41.34 |
| 9 | Rwanda | 40.88 |
| 10 | Mongolia | 40.71 |
| 11 | Algeria | 40.25 |
| 12 | Laos | 40.18 |
| 13 | Syria | 39.82 |
| 14 | Cameroon | 38.83 |
| 15 | Mozambique | 38.24 |
| 16 | Bangladesh | 37.57 |
| 17 | Sudan | 37.31 |
| 18 | Nepal | 37.02 |
| 19 | Zambia | 36.60 |
| 20 | Djibouti | 36.35 |
These statistics are based on detection verdicts returned by OAS and ODS Anti-Virus modules received from users of Kaspersky Lab products who consented to provide statistical data. The data include detections of malicious programs located on user computers or removable media connected to computers, such as flash drives, camera and phone memory cards, or external hard drives.
Excluded are countries with relatively few Kaspersky Lab users (under 10,000).
** Unique users on whose computers Malware-class local threats were blocked, as a percentage of all unique users of Kaspersky Lab products in the country.
Geography of malicious web attacks in Q2 2018 (ranked by percentage of users attacked)
On average, 19.58% of computers globally faced at least one Malware-class local threat in Q2.
Table of Contents
- Q2 figures
- Mobile threats
- Attacks on IoT devices
- Telnet attacks
- TOP 10 countries by shares of IoT devices infected via Telnet
- TOP 10 malware downloaded to infected IoT devices in successful Telnet attacks
- SSH attacks
- Online threats in the financial sector
- Q2 events
- New banking Trojan DanaBot
- The peculiar BackSwap technique
- Carbanak gang leader detained
- Ransomware Trojan uses Doppelgänging technique
- General statistics on financial threats
- Cryptoware programs
- Number of new modifications
- Number of users attacked by Trojan cryptors
- Geography of attacks
- TOP 10 countries attacked by Trojan cryptors
- TOP 10 most widespread cryptor families
- Cryptominers
- Vulnerable apps used by cybercriminals
- Attacks via web resources
- Top 10 countries where online resources are seeded with malware
- Countries where users faced the greatest risk of online infection
- Local threats
From the same authors


In the same category


IT threat evolution Q2 2018. Statistics