

Authors
Getting started with Ghidra
For about two decades, being a reverse engineer meant that you had to master the ultimate disassembly tool, IDA Pro. Over the years, many other tools were created to complement or directly replace it, but only a few succeeded. Then came the era of decompilation, adding even more to the cost and raising the barrier to entry into the RE field.
Then, in 2019, Ghidra was published: a completely open-source and free tool, with a powerful disassembler and a built-in decompiler for each supported platform. However, the first release did not look even close to what us reverse engineers were used to, so many of us tried and then abandoned it.
It may sound anecdotal, but the most popular answer to, “Have you used Ghidra?” I usually hear is, “Yeah, tried it, but I’m used to IDA”, or “I don’t have the time to check it out; maybe later”. I was like that, too: tried to reverse something, failed miserably, went back to familiar tools. I would still download a newer version every once and then, and try to do some work or play CTF. One day, after making a few improvements to the setup and adding the missing databases, I would not go back.
So, here is my brief introduction to setting up Ghidra, and then configuring it with a familiar UI and shortcuts, so that you would not need to re-learn all the key sequences you have got used to over the years.
Disclaimer
Ghidra is a complex collection of source code with many third-party dependencies that are known to contain security vulnerabilities. There are no guarantees that the current code base is free from those or that it does not contain any backdoors. Proceed with caution, handle with care.
Building Ghidra
Of course, the easiest way to obtain Ghidra is to download the current release published on Github. The current code is months behind the master branch, and will most likely be missing all the latest features. So, although this is not the officially recommended approach, I suggest getting the bleeding-edge code from the master branch and building the binaries yourself. In the meantime, we are going to prepare our own build of the master branch and make it available for download.
So, let us begin. First, you need the following prerequisites:
All OSs:
- JDK 17 64-bit, Adoptium Temurin is recommended
- Gradle 7.3+; Ghidra works well with 7.3.3
Additionally, you need the platform-specific compiler for building the native binaries:
- Windows: Microsoft Visual Studio (2017 or later; 2022 Community edition works well)
- Linux: modern GNU Compiler Collection (9 and 12 work well)
- macOS: Xcode build tools
Then, download the latest source code in a ZIP archive and extract it, or clone the official Git repository.
Windows build
Open the command line prompt (CMD.EXE). Set the directory containing the source code as the current one:
cd %directory_of_ghidra_source_code%
Run “bin\gradle.bat” from the Gradle directory to initialize the source tree and download all the dependecies:
gradle.bat -I .\gradle\support\fetchDependencies.gradle init
You need an active Internet connection, and it may take 5–10 minutes to download the dependencies.

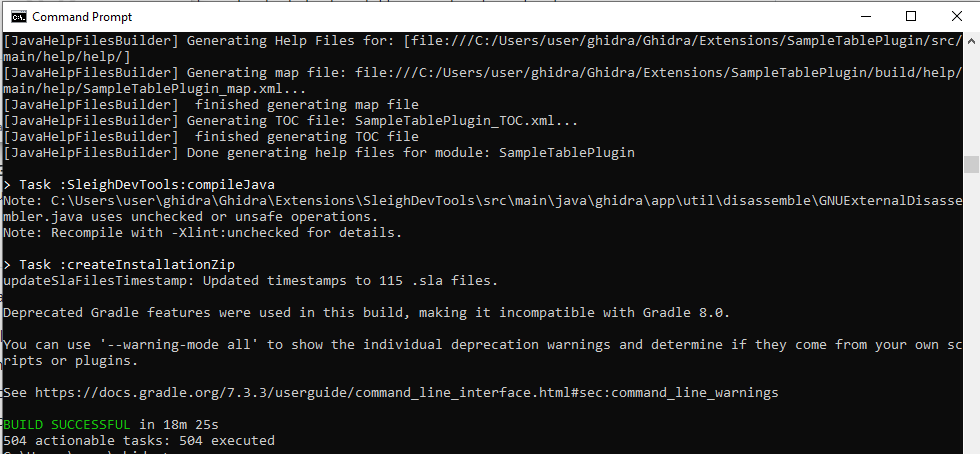
In the end, the output should state, “BUILD SUCCESSFUL” and also print clearly that Visual Studio was located (required for further building).

If there were problems, check your Internet connection—provided that you have Visual Studio, JDK and Gradle properly installed. Once the build succeeds, issue the final command:
gradle.bat buildGhidra
It will take more time, you may see lots of warnings printed out, but the final verdict still should be, “BUILD SUCCEESFUL”.
The complete Ghidra package is written as a ZIP archive to the “build\dist” directory. To run Ghidra, extract the ZIP archive and start “ghidraRun.bat”.

At the time of writing this, Ghidra 10.3-DEV used the “Windows” UI configuration as the default one, so there was no need to reconfigure the “look and feel” option.

Linux build
Use an existing terminal window or open a new one.
Set the directory containing the source code as the current one:
cd %directory_of_ghidra_source_code%
Run “bin\gradle” from the Gradle directory to initialize the source tree and download all the dependencies:
gradle -I ./gradle/support/fetchDependencies.gradle init
You need an active Internet connection, and it may take 5–10 minutes to download the dependencies. Please note that the task may fail if your locale is different from “en_US” and GCC uses translated messages:
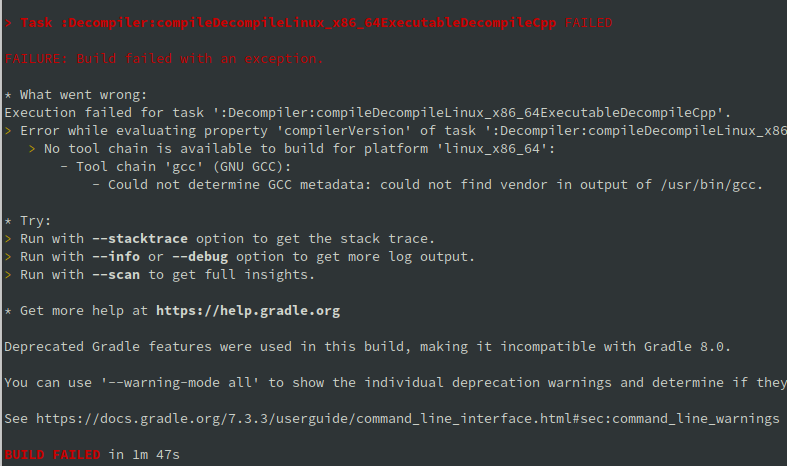
This may happen, for example, with the Russian locale, because the version string for GCC is translated:

As a mitigation, run gradle prefixed with “LANG=C”:
LANG=C gradle -I ./gradle/support/fetchDependencies.gradle init
In the end, the output should state, “BUILD SUCCESSFUL”.

Then, build Ghidra and all the dependencies:
Gradle buildGhidra
Once the build succeeds, a ZIP archive can be located in the build/dist directory. Extract it from there.

To start Ghidra, use the “ghidraRun” shell script in the root directory of the extracted archive:

At the time of writing this, version 10.3-DEV used the “Nimbus” look and feel as the default:

To use a more familiar look and feel, switch to “Native” or “GTK+” using the “Edit -> Tool Options -> Tool” menu, and choose the relevant item from the “Swing Look And Feel” dropdown list. This is what the “Native” theme looks on Gnome 3:

macOS build
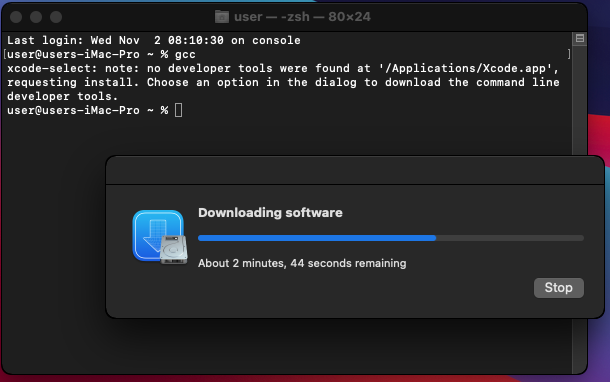
For macOS, you need to have the Xcode command-line tools installed, and that includes a substitute for GCC and make. This can simply be done by opening a Terminal window and running gcc. If the tools are not installed, an installation dialog will appear. Just confirm the installation and wait for the tools to download.
Once the tools are installed, the build process is identical to that in Linux.
Set the directory containing the source code as the current one:
cd %directory_of_ghidra_source_code%
Run “bin\gradle” from the Gradle directory to initialize the source tree and download all the dependencies:
gradle -I ./gradle/support/fetchDependencies.gradle init
Then, start the main build process:
gradle buildGhidra

Unzip the resulting Ghidra package from the build/dist directory and start the “ghidraRun” shell script:

The default look and feel for macOS is native by default:

Setting up the UI
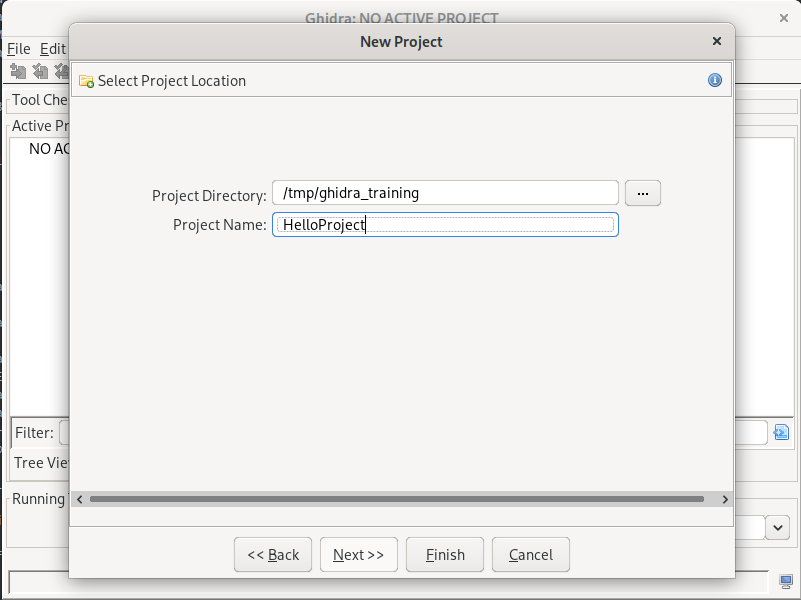
To configure Ghidra, let us first create a temporary project. A project used for storing all the results of the analysis, like an IDB, but for several files (samples) and folders, can also hold type databases that can be shared between different files. It can even be linked to a remote database for collaborative work, but that is far beyond our scope of just setting up.
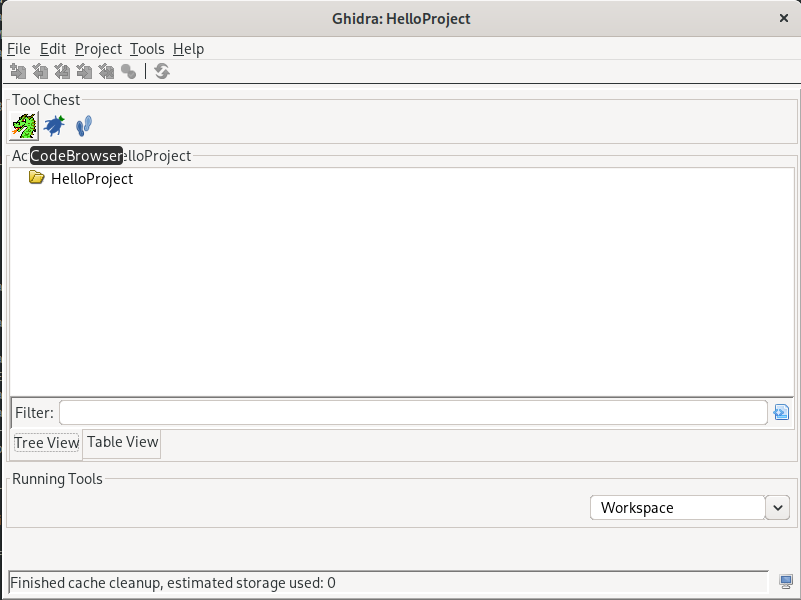
So, let us use the “File -> New Project…” menu, type in a project name and filesystem location, and continue:

Now, we have an empty project. Let us start the CodeBrowser tool that is the main UI for working with the binaries:
This will open an empty listing window, with a few subwindows inside:
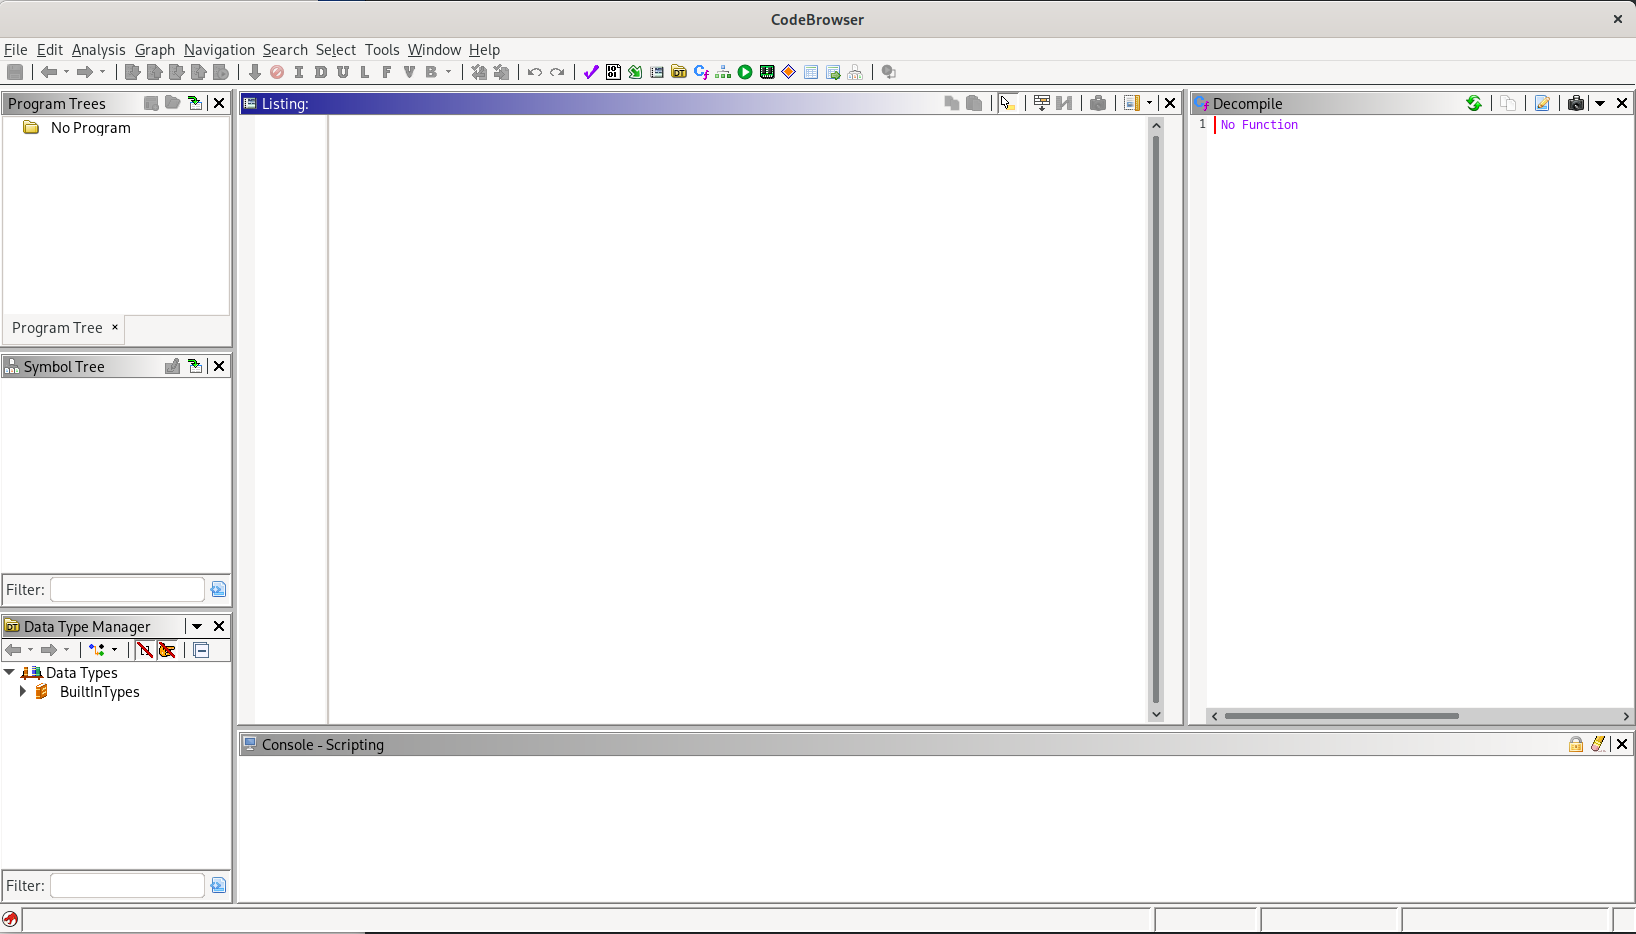
This is going to be the primary workspace in Ghidra, so let us reconfigure it to behave and look a bit closer to what we are used to.
Navigation bar
It is vertical and located on the right side of the listing by the scrollbar. To turn it on, use the “overview” button:

The rest of the options are set in the “Options” window by using the “Edit -> Tool Options…” menu.
Hex editor font
Select the following on the “Options -> ByteViewer” tab:

Hexadecimal offsets in structures
Set the following on the “Options -> Structure Editor” tab:

Shortcuts!
Default shortcuts, or “key bindings”, may be very confusing even for a seasoned reverse engineer and seem to be based on the ones used by Eclipse. You can search for shortcuts of interest and set or change them using a filter. To make the transition easier, we have prepared a prebuilt configuration with familiar shortcuts (C for code, D for data, X for xrefs, Esc for going back, etc.), which you can download from here and import:

Disassembly listing font
Choose the color and font on the “Options -> Listing Display” tab:

Compact listing of array items:
These are called “elements per line” on the “Listing Fields -> Array Options” tab. Also, you may want to change the “Array Index Format” to “hex” to prevent any confusion in the listing.

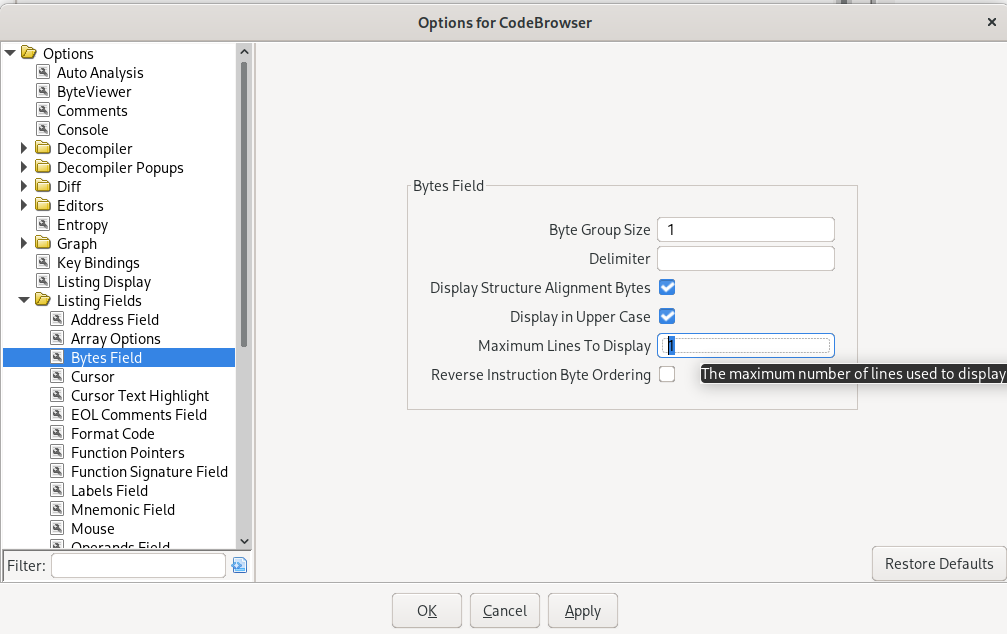
One line per instruction
To achieve that, set the “maximum lines to display” to “1” in the “Options -> Listing Fields -> Bytes Field” menu. It also makes sense to check “Display in Upper Case”.
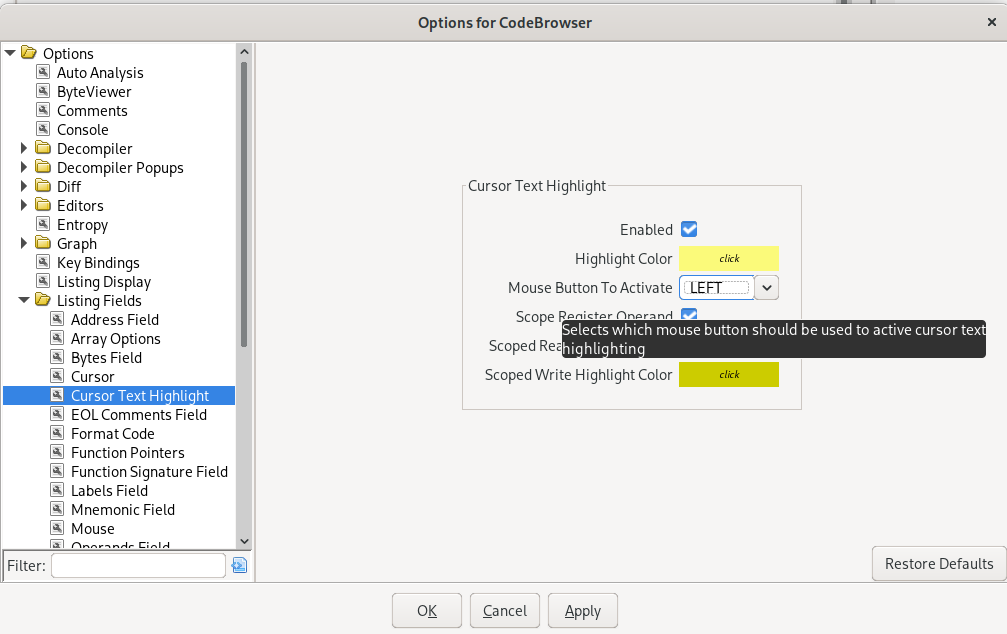
Highlight by Left Mouse Click
This is probably the most searched-for option, with the most frustrating defaults. To get values, registers, labels, and anything else highlighted with a left mouse click, set the option “Options -> Listing Fields -> Cursor Text Highlight”, “Mouse Button To Activate” to “LEFT” (the default is “MIDDLE”).
Function headers and footers
Tick the options “Flag Function Entry” and “Flag Function Exits” on the “Options -> Listing Fields -> Format Code” tab.

At the same time, uncheck the “Display Function Label” option on the “Options -> Listing Fields -> Labels Field” tab to remove an unnecessary line for each function header.

Turn off horizontal scrolling
Uncheck this option on the “Options -> Listing Fields -> Mouse” tab:

Show “normal” register names, long arrays, and strings
By default, Ghidra will display local variable names instead of registers. In some cases, this may be useful, but may also cause frustration when trying to read plain assembly.
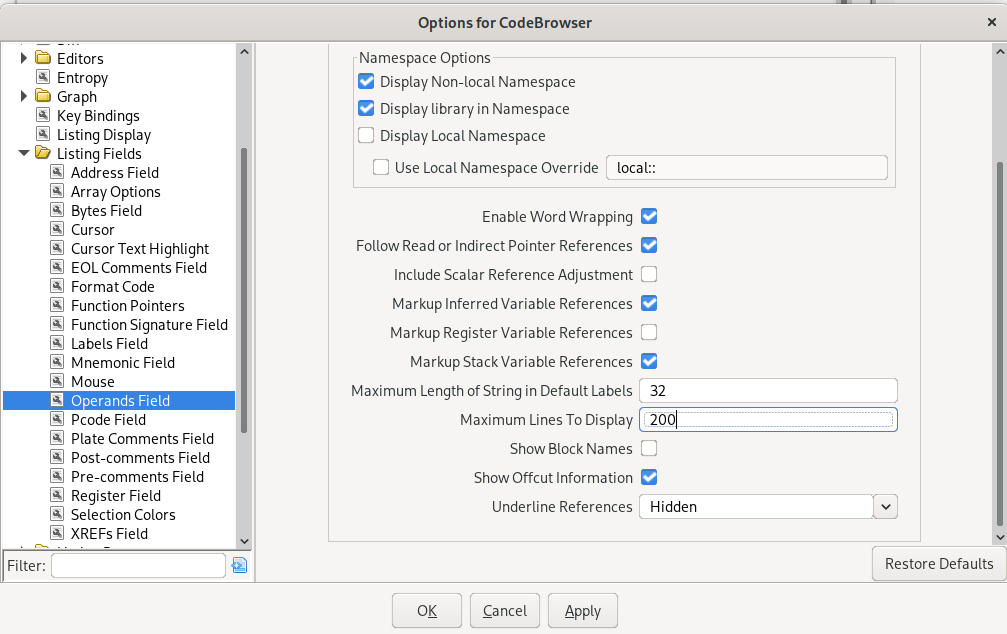
To force Ghidra to show plain register names, uncheck the “Markup register variable references” option on the “Options -> Listing Fields -> Operands Field” tab.
It may also help to increase the “Maximum Lines to Display” to 200, and to check the “Enable word wrapping” option to make arrays and strings in the listing easier to read.
Increase the number of cross-references to display
This option can be configured on the “Options -> Listing Fields -> XREFs Field” tab:

Change the width of the address, bytes, and opcodes columns
Ghidra uses the concept of “fields” that can be moved around and reformatted via the UI. This UI feature can be activated with the button named “Edit the Listing fields” in the main listing window.

When this is activated, you can move the columns around and change their width. The configuration is saved if you choose “save the tool” when exiting CodeBrowser.
Opening a file for analysis
Now that we have set up the UI, let us start our first analysis. To analyze a file, you need to import it first. This includes copying the data into the database, so that the original file can be deleted from the file system and the imported file can be saved back to disk.
To import a file, use the “File -> Import File…” menu in the Ghidra project window. You will be presented with an import dialog.

To prevent any confusion, treat the “language” as the Ghidra name for a combination of the processor name, byte endianness, and compiler variety. You may need to choose it manually if the file format is not recognized or if there is no format at all.
After the file is imported, it will appear in the project window. From there, you can open it in the CodeBrowser tool to open the main listing window:

For the new files, you will need to start manual analysis tasks or allow the autoanalysis process to do all the usual routine tasks of identifying code, data, functions, etc.:

The default configuration of the “analyzers”, which are separate analysis tasks, should be sufficient in most cases:

The analysis will start, and you will be presented with a CodeBrowser window gradually updating all the information:
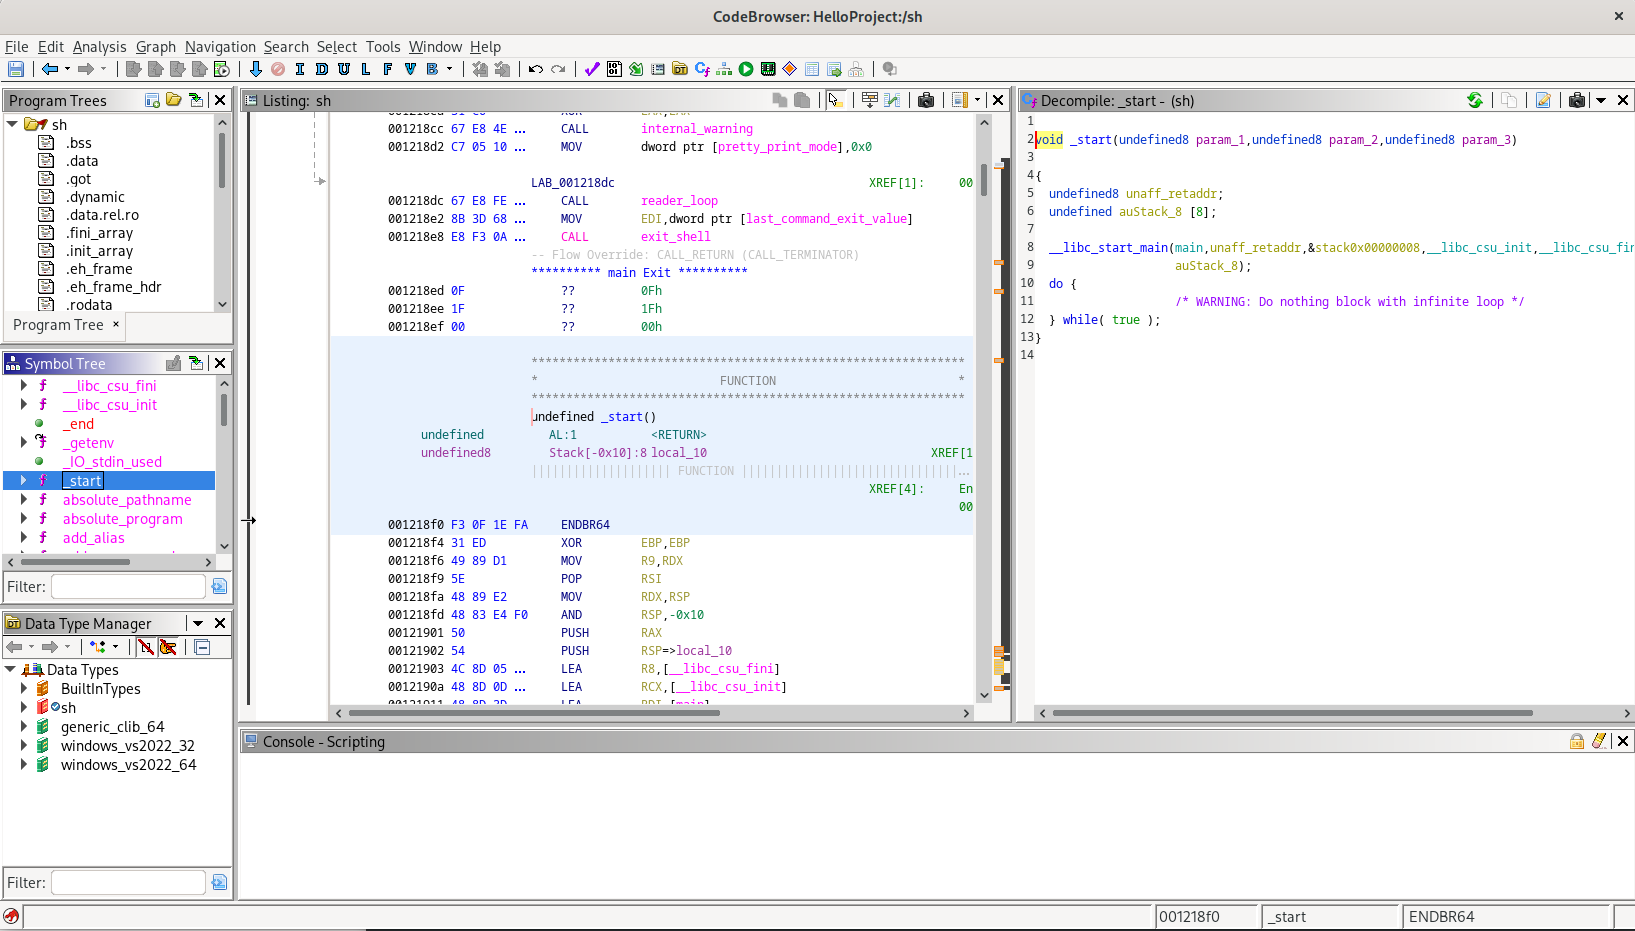
Here are a few tips on working with CodeBrowser:
- The “Symbol Tree” can be used to find all functions, exports including the entrypoint, and imports. Use it to find the starting points of your analysis.
- The “Data Type Manager” contains all the types, structures, typedefs, pointers, and enums. External type libraries are loaded here, in the “arrow” menu.
- Use the “Window” menu to discover most of the CodeBrowser functionality.
- File segments are displayed in the “Memory Map” window. Open it with a button or via the “Window” menu.
Going further
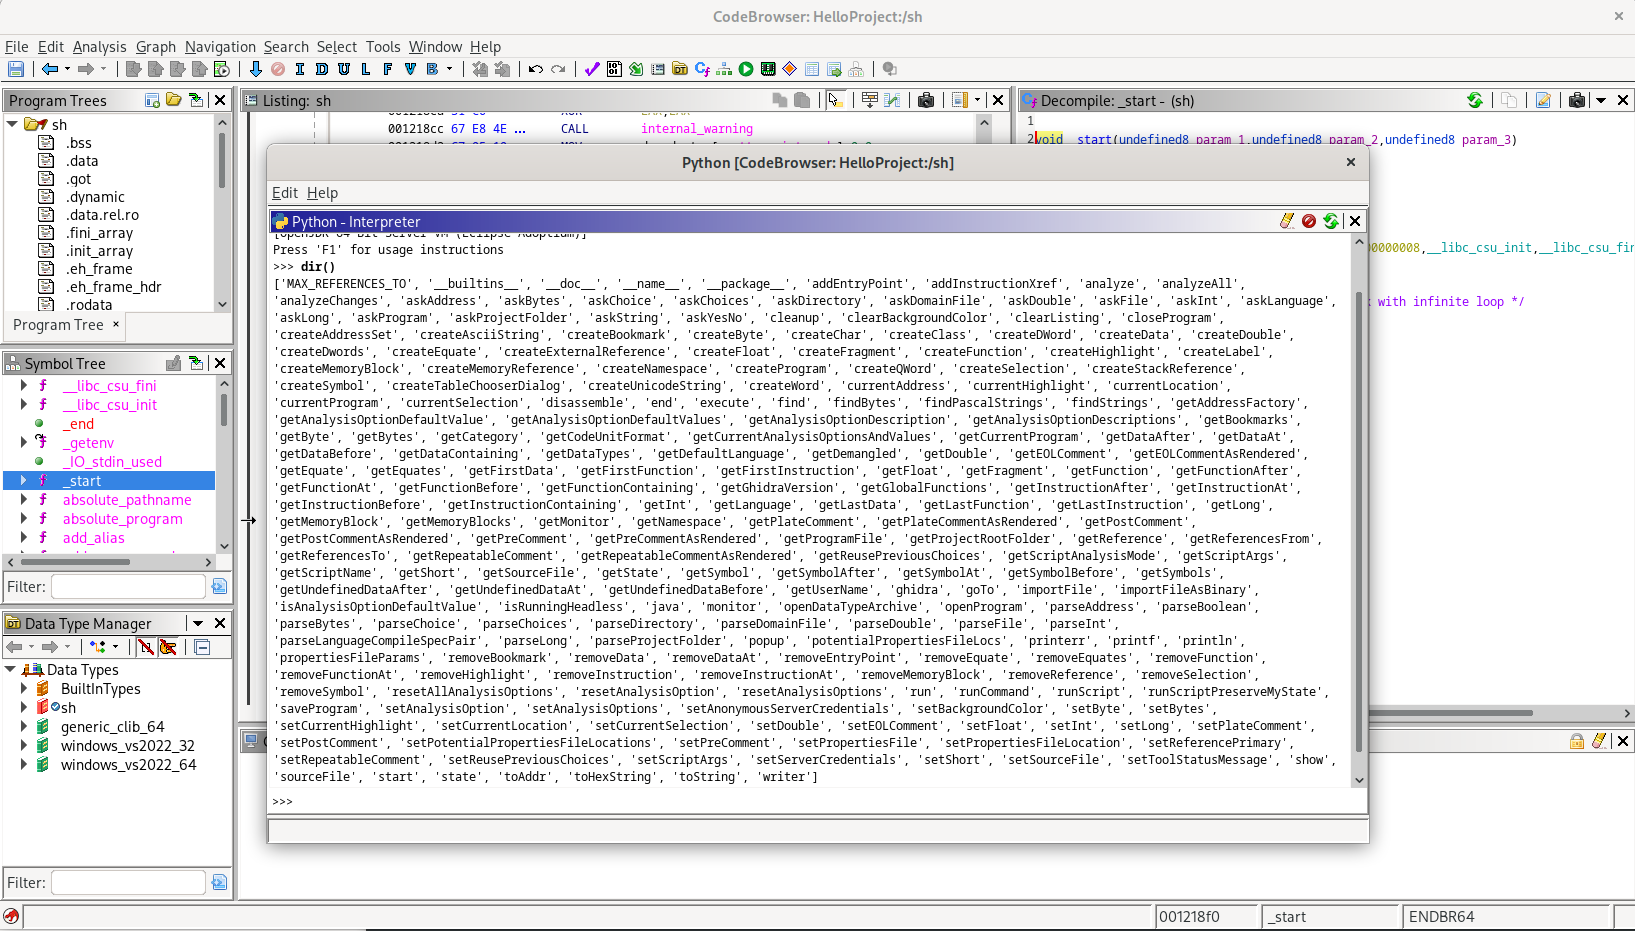
Ghidra comes with a collection of helper scripts in Java and Python that can be located by using the “Script Manager”: use the button or open via the “Window” menu. Also, it has a built-in Python 2—actually, Jython—interactive console. Use the “Window -> Python” menu and discover the flat API using “dir()”:
A few more things
Currently, the vanilla Ghidra build is missing lots of Windows datatypes that are required for typical malware analysis tasks. We have prepared an extended type information database for Windows, and added FIDBs (runtime function signatures) for VS2013 and Delphi. These can be downloaded from here.
This is just the beginning
We hope that this manual will help with reconfiguring Ghidra into a more convenient and easier-to-use tool. With additional type and signature databases, it may become powerful enough for a primary RE tool, while being free and open source. Remember to come back for updates!
From the same authors


In the same category


How to train your Ghidra