

Authors
Statistics on botnet attacks on clients of organizations
Due to the wide media coverage of incidents involving Mirai and other specialized botnets, their activities have become largely associated with DDoS attacks. Yet this is merely the tip of the iceberg, and botnets are used widely not only to carry out DDoS attacks, but to steal various user information, including financial data. The attack scenario usually looks as follows:
- An attempt is made to infect a device with malware (if the botmaster’s aim is financial, a Trojan banker is deployed). If successful, the malware-infected device becomes part of the botnet under the control of a C&C center.
- The malware on the infected device receives a command from C&C containing the target mask (for example, the URL of an online banking service) and other data required for the attack.
- Having received the command, the malware monitors the actions of the user of the infected device and carries out the attack when that user visits a resource that matches the target mask.
Main types of botnet-assisted attacks are:
- Web injection
- URL spoofing
- DNS spoofing
- Data collection on specific resources (visitor statistics, data from visited pages, screenshots)
Unlike DDoS attacks, which affect the web resources of the victim organization, the attacks investigated in this report target the clients of the organization. The result of a successful attack can be:
- Interception of user credentials
- Interception of bank card data
- Substitution of the transaction addressee (for example, the recipient of a banking transaction)
- Another operation performed without the user’s knowledge, but in their name
Such scenarios are valid not only for the user’s bank accounts, but for other services too, as we shall see later.
Methodology
Kaspersky Lab tracks botnet actions using the Botnet Monitoring technology, which emulates infected computers (bots) to obtain real-time data on the actions of botnet operators.
This analysis includes unique attacks registered by Botnet Monitoring in 2017 and 2018 and revealed by analysis of intercepted bots’ configurational files and C&C command.
The attack target is the URL mask, extracted from the bot configuration file or the intercepted command (for example, the URL mask of an online banking site).
The ‘malware family’ in this report refers to publicly known names of malware, for example, ZeuS, TrickBot (Trickster), Cridex (Dridex, Feodo, Geodo, etc.), Ramnit (Nimnul).
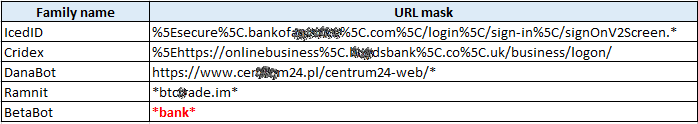
Examples of target masks contained in registered commands
A unique attack in this analysis is taken as the unique combination of the target mask and the malware family (or its modification) that received the attack command. The rest of the data (injected scripts, rules for cryptowallets or URLs substitution, traffic redirection rules, patterns for credentials interception, etc.) were not taken into account when determining the uniqueness of an attack.
Excluded from the analysis are attacks related to company resources engaged in developing anti-malware solutions, since such attacks are security measures undertaken by malware to prevent treatment of an infected device (to prevent downloading of a security solution). Besides, we excluded attacks in which could not uniquely identify the target, i.e. it was impossible to obtain additional information about the target from the target mask (for example, the “* bank *” target of the BetaBot is not included in the analysis).
Only the number of unique attacks is taken into account, and not the total number of attacks of each particular family, because different families may receive commands with different frequencies.
The results are based on an analysis of commands from more than 60,000 different C&C centers linked to 150 malware families and their modifications.
Statistics
The total number of unique attacks on clients of organizations registered by Botnet Monitoring technology in 2018 fell by 23.46% against the previous year (from 20 009 attacks in 2017 to 15 314 in 2018).
At the same time, 39.35% of the attacks we observed in 2018 were new, that is, the combination of the target mask and the family that received the attack command was not encountered in 2017. This is linked to both the emergence of new bankers (Danabot, BackSwap) and the desire of malware creators to change their target scope.
The geography of attacks’ targets in 2017 covered 111 countries; in 2018, attempts were made to attack clients of organizations in 101 countries.
Cybercriminals’ targets
To start with, we will examine the clients of which organizations are cybercriminals’ preferred targets.
In 2017, the largest share of attack targets belonged to the Financial Services category (77.44%). This includes online banking services, multibanking services, online stores, and other resources related to financial transactions (not including cryptocurrencies). This result is to be expected due to the greatest potential gains for the cybercriminals, who in the event of a successful attack gain direct access to the victim’s finances.
In second place by number of unique attacks is the Global Portals and Social Networks category (6.15%), which includes search engines, email services, and social networks. Search engines are placed in this group, because typically the main page of such systems provides a mailbox login form through which intruders try to steal credentials using the types of attacks described above.
Third place in our ranking goes to resources that provide various products and services (5.08%), but are not online stores. For example, hosting providers. In this case, as in the first category, the target is victims’ payment details. These resources are assigned to a separate group, since they offer a specific product or service, which indicates how precise the cybercriminals’ targeting can be.

Distribution of the number of unique attacks by attack target, 2017
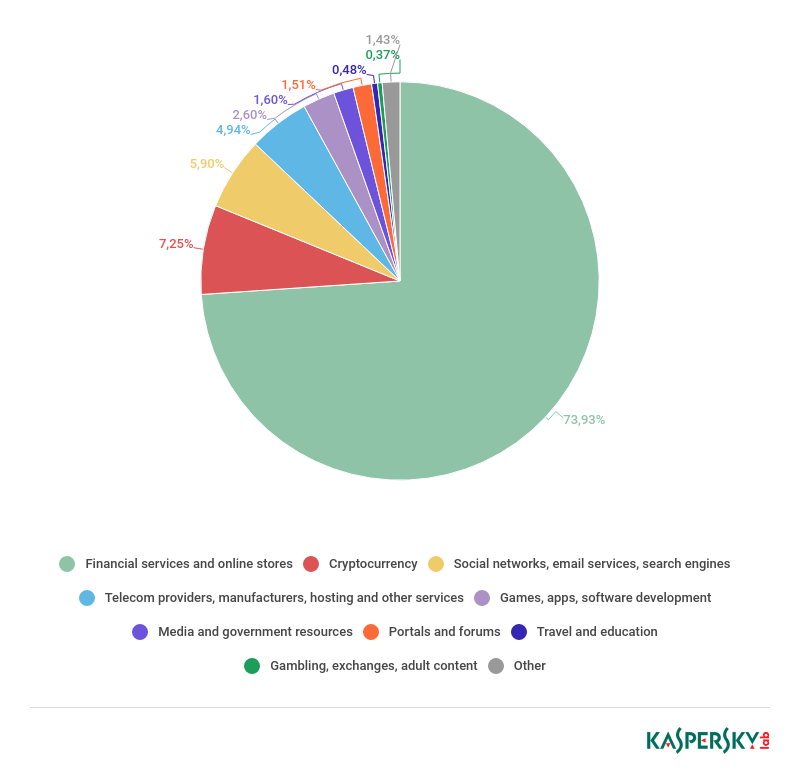
Distribution of the number of unique attacks by attack target, 2018
In 2018, there were minor changes in the Top 3 targets of attacks on clients of various organizations. Interestingly, the share of unique attacks on financial services dropped by 3.51 p.p. to 73.93%.
The target mask received by the bot nearly always contains a domain or part of one. After analyzing the domains of masks pertaining to financial organizations (banks, investment, credit, pension institutions, etc.), we compiled a map of organizations whose clients were attacked by bots in 2018. The map indicates the numbers of financial organization domains observed in commands sent to bots.
It should be noted that one organization can own several domains, for example, divided according to a country’s territories.
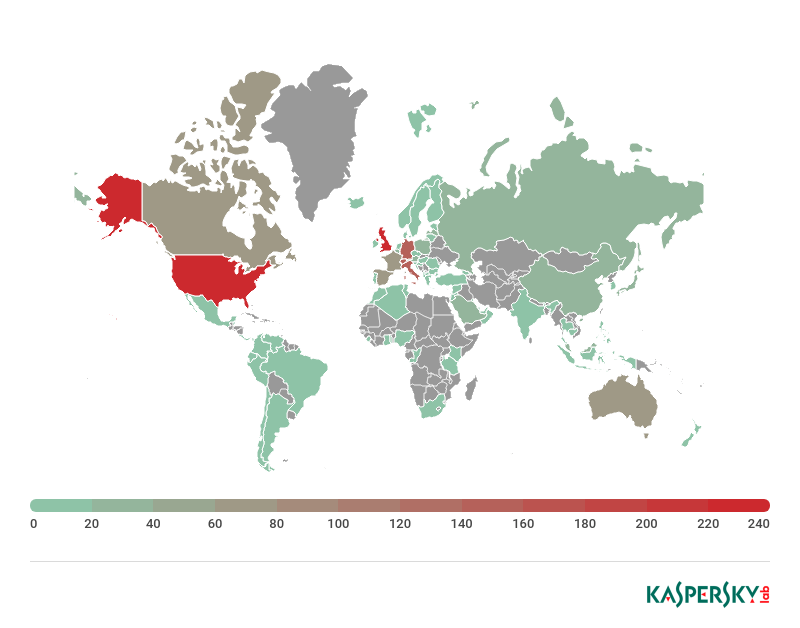
Domain map of financial organizations observed in target masks, 2018
2018 saw a rise in botmasters’ interest in cryptocurrencies: The number of unique attacks on users linked to cryptocurrency services (exchanges, cryptocurrency wallets, etc.) increased, with their share more than tripling (up 4.95 p.p.) to 7.25%.
Cybercriminals actively tried to monetize interest in cryptocurrencies and obtain data from victims to steal funds. The majority of attacks that we detected on users of cryptocurrency services featured Ramnit Banker (53%). In addition, the Chthonic and Panda bankers, both modifications of the notorious ZeuS banker, dramatically increased the number of unique masks linked to cryptocurrency wallets and exchanges. The CapCoiner Trojan, which specifically targets such resources, also displayed major activity in this area.
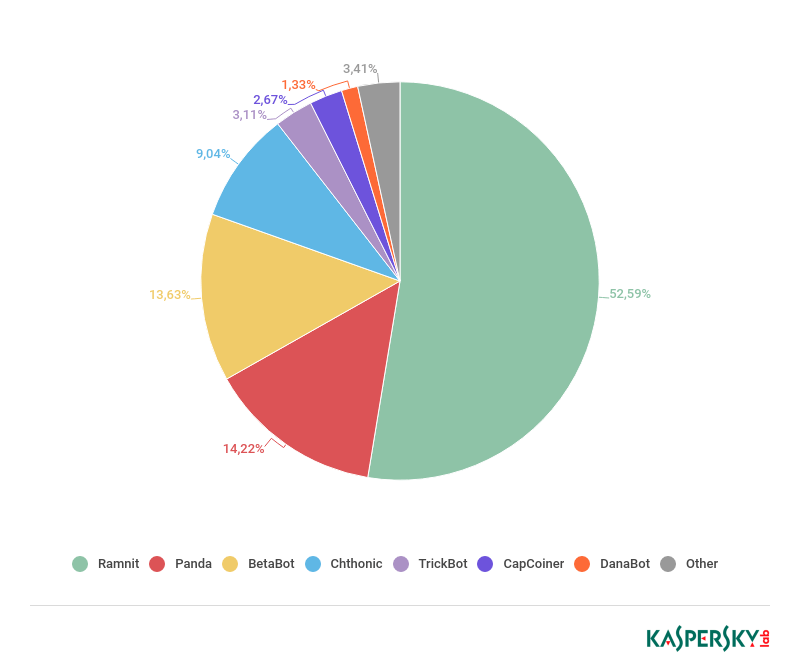
Distribution of Trojans families by share of attacks on users of cryptocurrency services, 2018
Geography of attack targets
Note: If the target mask contains a TLD (top-level domain) that can be used to determine the country, this country is entered in the statistics. If the country cannot be determined from the TLD (for example, .com), the country where the organization’s headquarters are located is entered in the statistics.
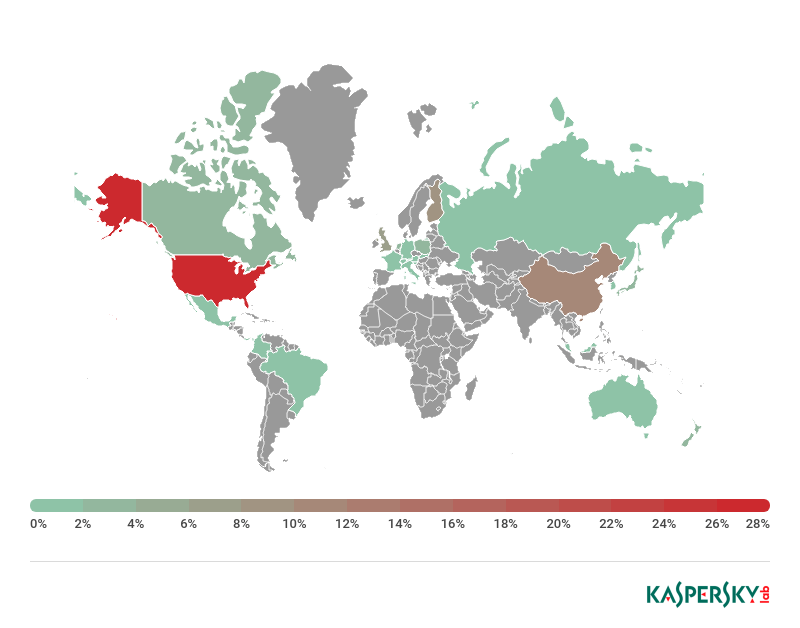
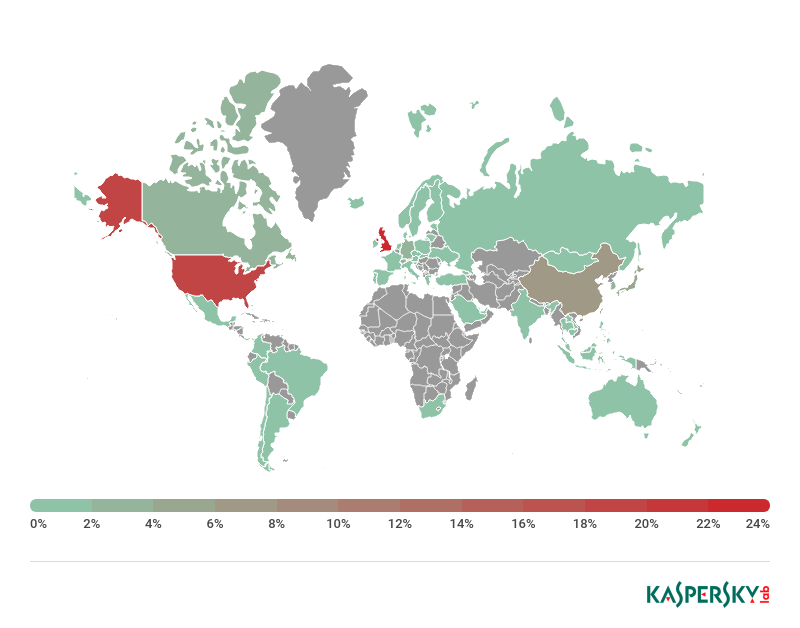
In 2018, the ranking of Top 10 countries by number of unique target masks changed order, but not composition. As in the previous year, clients of organizations in the US were the most frequent targets of attacks in 2018.
| 2017 | 2018 | |||
| 1 | United States | 31.29% | United States | 34.84% |
| 2 | Germany | 11.15% | Britain | 9.97% |
| 3 | Britain | 9.20% | Italy | 7.46% |
| 4 | Italy | 7.52% | Canada | 6.16% |
| 5 | Canada | 6.96% | Germany | 3.88% |
| 6 | Australia | 4.67% | Spain | 3.14% |
| 7 | France | 4.57% | Switzerland | 3.04% |
| 8 | Spain | 2.87% | France | 3.02% |
| 9 | China | 2.50% | Australia | 2.29% |
| 10 | Switzerland | 2.17% | China | 2.11% |
In 2018, the share of unique attacks on clients of organizations located in Germany fell significantly. This is because in 2017 most of these attacks were carried out by BetaBot (almost 75% of all registered unique attacks), while in 2018 its share barely exceeded 1.5%. Even with Danabot attacks registered in 2018 on clients of German banks, Germany still couldn’t retain second place in our ranking.

Geography of attack targets, 2017
Among the other changes observed was a decline in the share of attacked clients of Australian organizations from 4.67% to 2.29%. Almost all bots reduced the number of unique masks focused on Australia. For instance, among the Gozi banker attacks we observed in 2018, there were practically none against clients of financial organizations in Australia, whereas in 2017 they accounted for more than 90% of registered attacks by this malware.

Geography of attack targets, 2018
But it’s not all good news. Many varieties of malware expanded their geography: In 2018, the Trickster (TrickBot) banker added no fewer than 11 countries to its target list, while the SpyEye Trojan and the IcedID banker picked up 9 and 5 more countries, respectively.
Unsurprisingly, the most frequently attacked users of cryptocurrency services were located in the US, Luxembourg, and China, since many cryptocurrency services are registered in these countries. In addition, the number of attacks in 2018 on users of services registered in Britain, Singapore, Estonia, South Korea, and Switzerland climbed significantly.
Geography of cryptocurrency services whose users were attacked, 2017

Geography of cryptocurrency services whose users were attacked, 2018
Geography of C&C centers
This section gives statistics on the geography of botnet C&C centers that sent commands to launch an attack.
In 2017, the largest slice of C&C centers was located in Ukraine (24.25%), with almost 60% of them made up of C&C servers for the abovementioned Gozi banker.

Geography of C&C centers in 2017
In 2018, Russia (29.61%) was top of the leaderboard by number of C&C centers directing attacks against clients of various organizations. More than half (54%) of these C&C centers were used by the Panda banker.

Geography of C&C centers, 2018
Most active families
BetaBot
Trojan Banker BetaBot accounted for 13.25% of all unique attacks in 2018.

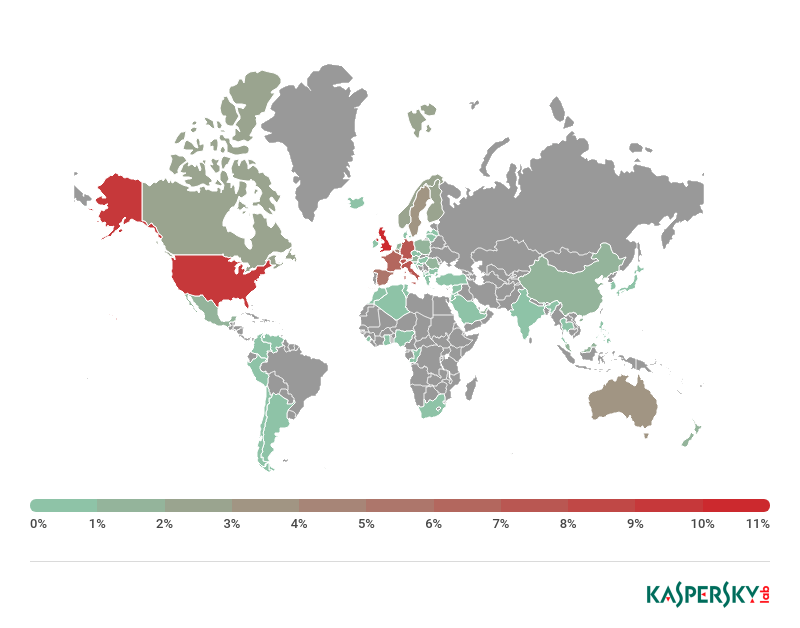
Geography of BetaBot targets, 2018
Key features (shares relative to the number of unique BetaBot attacks):
- Geography of targets: 42 countries
- Most attacked countries: US (73.60%), China (6.35%), Britain (6.11%)
- Most attacked categories of organizations: Financial Services (37.43%), Global Portals and Social Networks (18.16%)
Trickster (TrickBot)
The TrickBot banker accounted for 12.85% of all unique attacks in 2018.
Geography of TrickBot targets, 2018
Key features (shares relative to the number of unique TrickBot attacks):
- Geography of targets: 65 countries
- Most attacked countries: Britain (11.02%), US (9.34%), Germany (7.99%)
- Most attacked categories of organizations: Financial Services (96.97%), Cryptocurrency Services (1.72%)
Panda
The Panda banker accounted for 9.84% of all unique attacks in 2018.

Geography of Panda targets, 2018
Key features (shares relative to the number of unique Panda attacks):
- Geography of targets: 33 countries
- Most attacked countries: Canada (24.89%), US (22.93%), Italy (17.90%)
- Most attacked categories of organizations: Financial Services (80.88%), Cryptocurrency Services (10.26%)
SpyEye
SpyEye accounted for 8.05% of all unique attacks in 2018.

Geography of SpyEye targets, 2018
Key features (shares relative to the number of unique SpyEye attacks):
- Geography of targets: 32 countries
- Most attacked countries: US (35.01%), Britain (14.38%), Germany (13.57%)
- Most attacked categories of organizations: Financial Services (98.04%)
Ramnit
Ramnit accounted for 7.97% of all unique attacks in 2018 registered by Botnet Monitoring. Ramnit’s impressive geography covers 66 countries.
Geography of Ramnit targets, 2018
Key features (shares relative to the number of unique Ramnit attacks):
- Geography of targets: 66 countries
- Most attacked countries: Britain (25.70%), US (20.12%), China (7.78%)
- Most attacked categories of organizations: Financial Services (47.76%), Cryptocurrency Services (46.83%)
Conclusion
Our analysis of commands issued to attack clients of organizations in 2018 identified the following main trends:
- The reduction in the total number of registered unique attacks may indicate cybercriminals’ preference to create target masks that cover a large number of resources of one organization and stay relevant for a prolonged period.
- Absolute majority of attacks still targets financial organizations and their clients.
- The number of attacks on clients of cryptocurrency services increased significantly (compared to 2017). The number of such attacks is not expected to fall; on the contrary, it may rise given that more and more bots are deploying web injections against such resources.
- New target masks are proliferating. Cybercriminals are adding new, previously unencountered targets as well as modifying old masks to cover more websites where user data or money can be stolen.
From the same authors


In the same category


Bots and botnets in 2018