

Authors
Last year, we visited The MITRE Corporation and took part in the MITRE ATT&CK Evaluation Round 2. During this very in-depth 3-day assessment, our and other vendors technologies were tested against emulated attack techniques of the APT29 threat group.
The MITRE ATT&CK Evaluation is a unique exercise in many ways. One of its distinguishing features is the absence of any scores or ratings to enable the direct comparison of participants (as happens in anti-malware tests). The result of the Evaluation is a complex table of assessments of all detections that a given security solution has produced, for different stages of the attacks of a specific adversary. We’ve already published some of our initial findings, based on the ‘matrix’ representation of our test results.
But other ways to access the Evaluation results are also available. Alongside the ATT&CK framework, MITRE offers Joystick, a data analysis tool to let users explore the results in graphic form. This article contains some observations based on MITRE visualizations of the Evaluation Round 2, as well as data analysis using other statistic instruments. We’ll look at exploring the Evaluation results in three important directions:
- coverage of the attack’s operational flow, in terms of missed steps
- coverage of individual techniques, in terms of high-quality detections
- numbers of detections in individual categories
Let’s start with the Joystick diagrams that MITRE uses to display test results on its official webpage. The diagram for every vendor shows a timeline of steps, rather than a matrix of tactics/techniques. We’re looking here at the operational flow, and the number of detections in each category at each step in that flow – a step being a group of actual test runs at one stage of the Evaluation. Because they represent the actual attack implementation flow, these steps don’t follow the same order as the tactics and techniques in the ATT&CK matrix. The test attack itself comprised 20 steps, but MITRE has chosen to omit Step 19 from the evaluation results.

Figure 1. Major step breakdown for Kaspersky
The detection categories in the Joystick diagram (see Figure 1) are color-coded. ‘None’ and ‘Telemetry’ are the ‘lowest’ outcomes, represented in two shades of blue. ‘None’ means that the product didn’t notice the suspicious action at all, while ‘Telemetry’ means that some data was collected, but no detection logic was applied, and the event was not labelled (as malicious or otherwise). So, basically, ‘Telemetry’ is not a true detect – just an event log. True detections are represented by the other four categories in shades of yellow and green: ‘MSSP’, ‘General’, ‘Tactic’ and ‘Technique’.
Where only ‘None’ or ‘Telemetry’ blues are shown on the diagram for a step, and there are no yellows or greens, we may call it a missed step – a stage of the attack where no true detections were made. Here, for example, is the results diagram for one vendor’s evaluation (not Kaspersky). Several missed steps can be seen – look at columns 2, 8, 10, 12, 13, and 17:
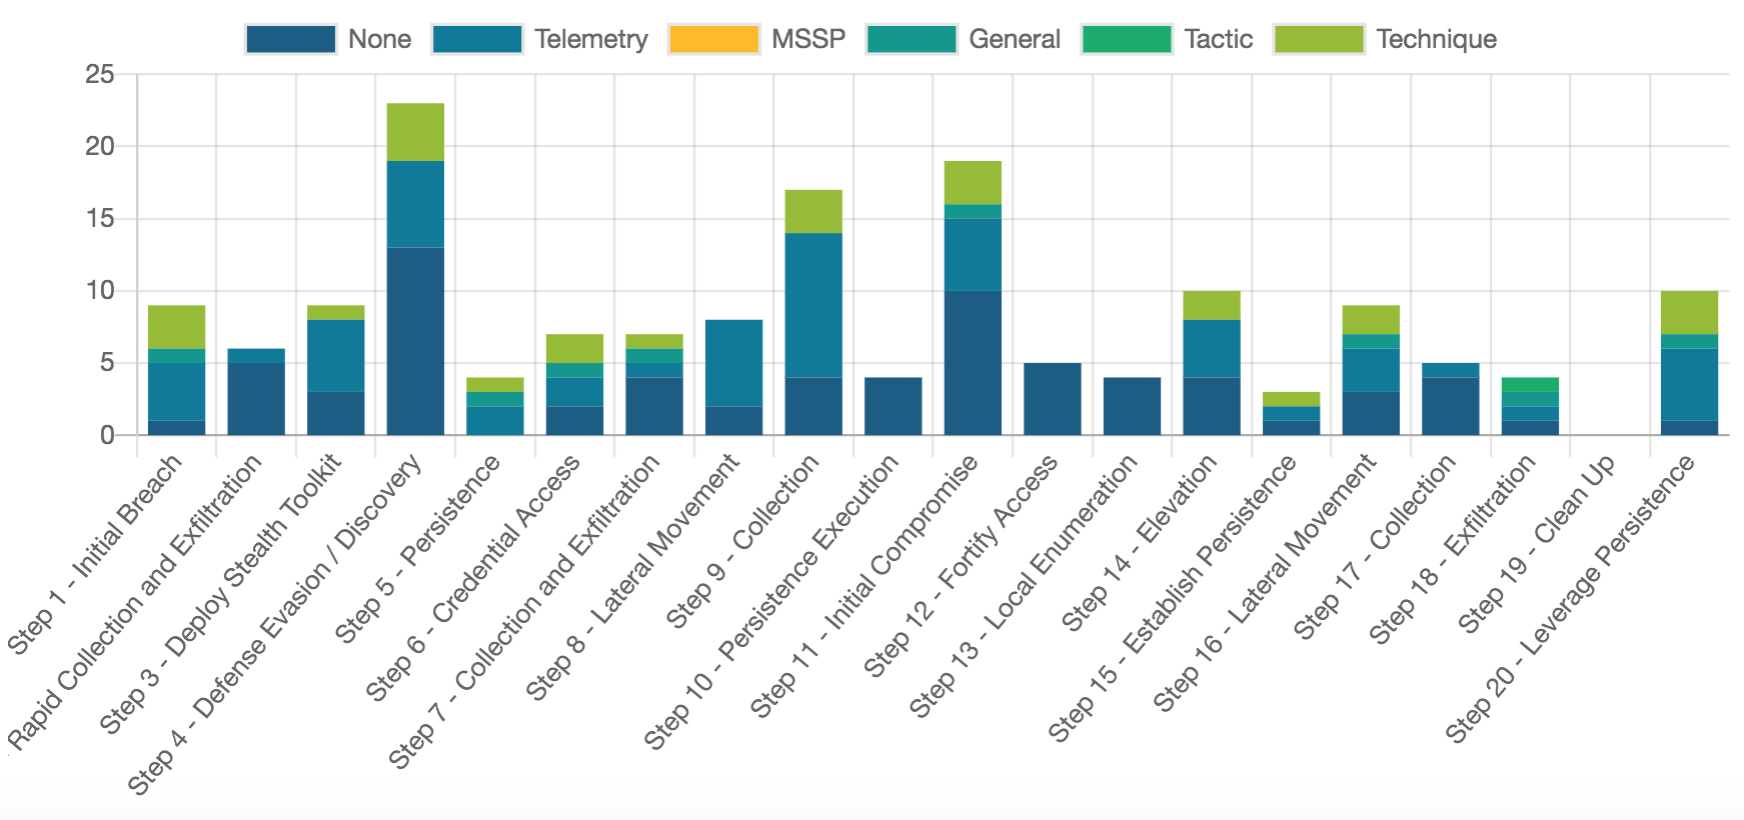
Figure 2. Major step breakdown for a vendor from ATT&CK Evaluation Round 2.
Is it a failing for a security solution to miss so many attack stages? Well, decide for yourself. We think it would be better to minimize such missed steps. Here’s the number of missed steps for each of the vendors evaluated:

Figure 3. Number of missed steps for each vendor.
An interesting question: which ‘missed steps’ matter most? It depends, of course, on the particular case and the ultimate goal of the specific attack. But remember one crucial limitation of the ATT&CK Evaluation: the security product is not allowed to take any preventative/remediation actions at any stage of the attack during testing. This fails to reflect real-life conditions, where prevention modules should stop any attack at the earliest stage possible. So we can say that, in the real world where there’s a progressively greater chance of any attack having already been detected at an early stage – the later the missed step, the less risk it represents.
For example, you’ll see that a large group of vendors missed only one step in the Evaluation. Of these, Microsoft, Symantec, F-Secure, FireEye, Secureworks and GoSecure all missed step 10 (Persistence Execution), while TrendMicro and Palo Alto missed step 13 (Local Enumeration). These steps occur somewhere near the middle of the attack’s operational flow.

Figure 4. Major step breakdown for Microsoft
For Kaspersky, the only step without good detects was step 18 (Exfiltration), the last but one in the attack chain. In a real-world situation, the security solution would have detected the attack long before this step was reached.

Figure 5. Major step breakdown for Kaspersky
It should be noted that a broad-brush comparison of Evaluation results is not always that useful – after all, your organization will probably never come up against some of the attack techniques emulated in the MITRE test. For this reason, the MITRE Joystick data analysis tool allows you to select your own parameters and explore the Evaluation results this way.
You may also want to use your own statistical instruments to further explore evaluation data most relevant to your organization’s particular needs and resources. For example, you could choose a particular technique from the Evaluation Round 2 scope – and see how it was covered by high-quality detections, such as ‘Technique’ or ‘MSSP’.
We’ve previously listed Round 2 techniques where Kaspersky’s solution achieved 100% visibility: all the test runs for each of these techniques resulted in high-quality detections. The diagram below shows the total number of Round 2 techniques for which each vendor achieved 100% coverage with high-quality detection categories (‘Technique’ or ‘MSSP’).

Figure 6. Number of techniques with 100% high-quality detections per vendor.
On the other hand, you may want to explore the detections in one particular category. The next diagram shows the total number of MSSP detections made by different vendors:
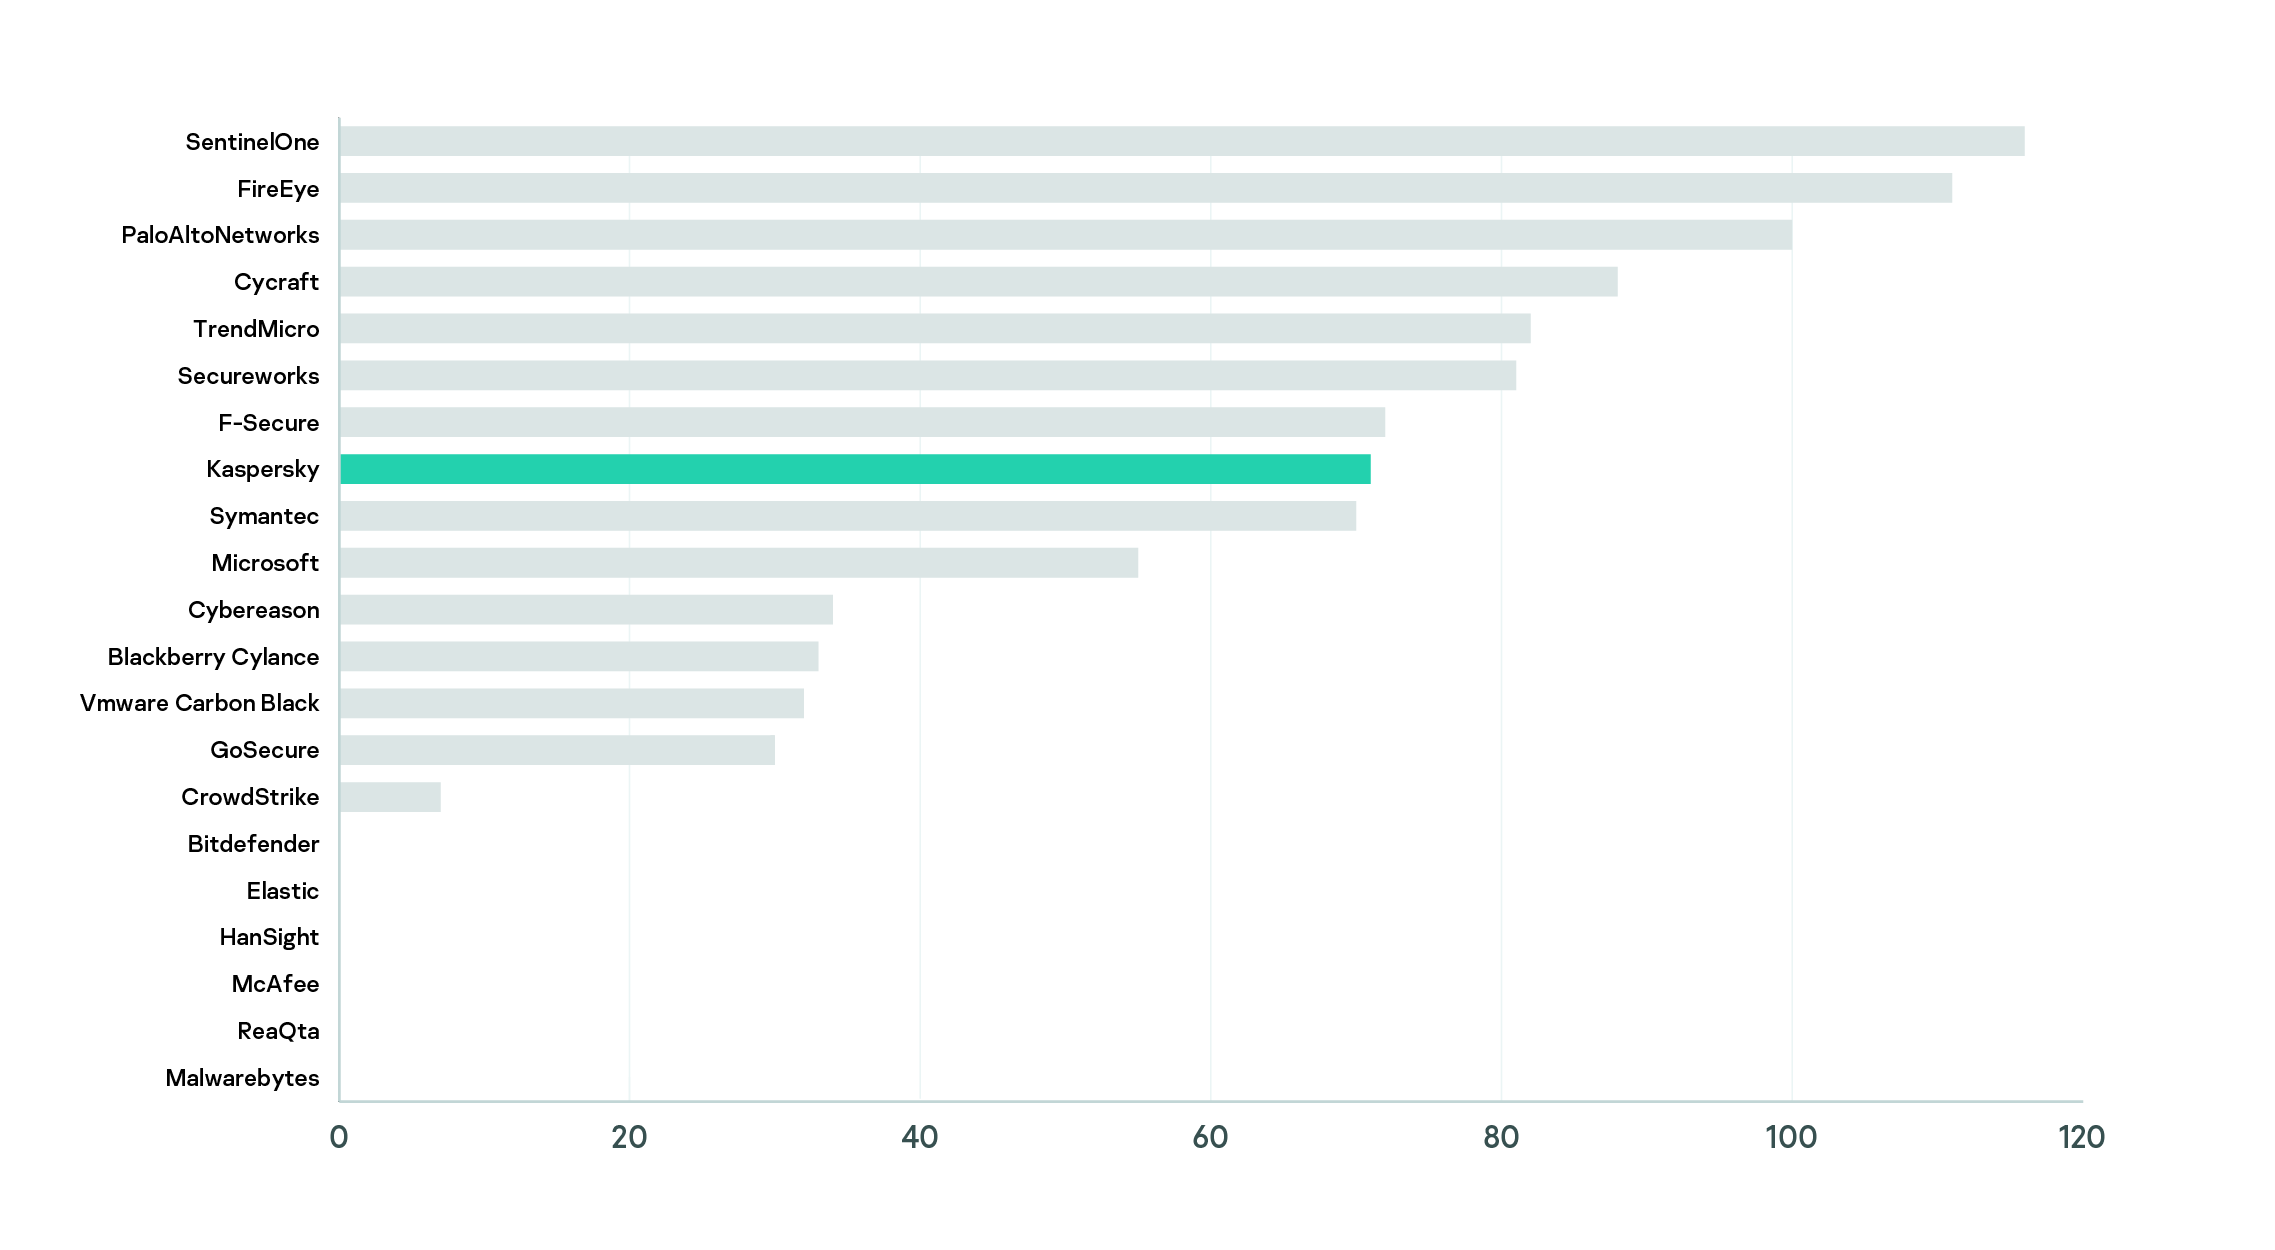
Figure 7. Total MSSP detections gained by participants in the ATT&CK Evaluation Round 2
You can see that six of the vendors evaluated didn’t support their EDR performance with any MSSP services at all. At Kaspersky, we believe that while many attack methods can be detected automatically, there are also those that require human expertise to uncover (in this test, for example, no vendor was good enough with fully automatic detections on steps 4 and 11). That’s why we feel that a comprehensive solution should combine a fully automated security product with a threat hunting service. During our Evaluation, the latter element was successfully handled by Kaspersky Managed Protection service which benefits from both automatic and manual detection.
In conclusion, the ATT&CK Evaluation results should be viewed from the perspective of your own security goals and infrastructure features. Having said this, a good security solution should demonstrate the widest possible coverage of attack techniques and attack stages (steps, tactics) – and the ATT&CK Evaluation is an effective way of visually assessing this.
More materials about ATT&CK Evaluation and how ATT&CK is used in Kaspersky products can be found here – Kaspersky.com/MITRE
From the same authors


In the same category


ATT&CK Evaluation results: visual perspective