

Q2 in figures
- According to KSN data, Kaspersky Lab solutions detected and repelled a total of 379,972,834 malicious attacks from online resources located all over the world.
- Kaspersky Lab’s web antivirus detected 26,084,253 unique malicious objects: scripts, exploits, executable files, etc.
- 65,034,577 unique URLs were recognized as malicious by web antivirus components.
- 51% of web attacks neutralized by Kaspersky Lab products were carried out using malicious web resources located in Russia.
- There were 5,903,377 registered notifications about attempted malware infections aiming at stealing money via online access to bank accounts.
- Kaspersky Lab’s file antivirus detected a total of 110,731,713 unique malicious and potentially unwanted objects.
- Kaspersky Lab mobile security products detected
- 1,048,129 installation packages;
- 291,887 new malicious mobile programs;
- 630 mobile banker Trojans.
Overview
Targeted attacks and malware campaigns
Monkey business
Recently we published our analysis of CozyDuke, yet another cyber-espionage APT from the ‘Duke’ family – which also includes MiniDuke, CosmicDuke and OnionDuke. CozyDuke (also known as ‘CozyBear’, ‘CozyCar’ and ‘Office Monkeys’) targets government organisations and businesses in the US, Germany, South Korea and Uzbekistan.

The attack implements a number of sophisticated techniques, including encryption, anti-detection capabilities and a well-developed set of components that are structurally similar to earlier threats within the ‘Duke’ family.
However, one of CozyDuke’s most notable features is its use of social engineering to get an initial foothold in targeted organisations. Some of the attackers’ spear-phishing emails contain a link to hacked web sites – including high-profile, legitimate sites – that host a ZIP archive. This archive contains a RAR SFX that installs the malware while showing an empty PDF as a decoy. Another approach is to send out fake flash videos as email attachments. A notable example (which also gives the malware one of its names) is ‘OfficeMonkeys LOL Video.zip’. When run, this drops a CozyDuke executable on to the computer, while playing a ‘fun’ decoy video showing monkeys working in an office. This encourages victims to pass the video around the office, increasing the number of compromised computers.
It is necessary to make staff education a core component of any business security strategy #KLReport
Tweet
The successful use of social engineering to trick staff into doing something that jeopardises corporate security – by CozyDuke and many other targeted attackers – underlines the need to make staff education a core component of any business security strategy.
Naikon: gathering geo-political intelligence
In May we published our report on the Naikon APT. Naikon is used in campaigns against sensitive targets in South-eastern Asia and around the South China Sea. The attackers seem to be Chinese-speaking and have been active for at least five years, focusing their attention on top-level government agencies and civil and military organizations in countries such as the Philippines, Malaysia, Cambodia, Indonesia, Vietnam, Myanmar, Singapore, Nepal, Thailand, Laos and China.

As with so many campaigns of this kind, the attackers use spear-phishing emails to trick unsuspecting staff into loading the malware. Emails include an attached file containing information likely to be of interest to the victim. The file seems to be a standard Word document, but it is really an executable with a double extension, or an executable that uses the RTLO (right to left override) mechanism to mask the real extension of the file. If the victim clicks on the file, it installs spyware on the computer while displaying a decoy document to avoid arousing suspicion.
The attackers use spear-phishing emails to trick staff into loading malware #KLReport
Tweet
Naikon’s main module is a remote administration tool: this module supports 48 commands to exercise control over infected computers. These include commands to take a complete inventory, download and upload data, and install add-on modules. In addition, Naikon sometimes uses keyloggers to obtain employees’ credentials.
Each target country is assigned its own operator, who is able to take advantage of local cultural features – for example, the tendency to use personal email accounts for work. They also made use of a specific proxy server within a country’s borders, to manage connections to infected computers and transfer data to the attackers’ Command-and-Control (C2) servers.
You can find our main report and follow-up report on our web site.
Spying on the spies
While researching Naikon, we uncovered the activities of the Hellsing APT group. This group focused mainly on government and diplomatic organisations in Asia – most victims are located in Malaysia and the Philippines, although we have also seen victims in India, Indonesia and the US.

In itself, Hellsing is a small and technically unremarkable cyber-espionage group (around 20 organisations have been targeted by Hellsing). What makes it interesting is that the group found itself on the receiving end of a spear-phishing attack by the Naikon APT group – and decided to strike back! The target of the email questioned the authenticity of the email with the sender. They subsequently received a response from the attacker, but didn’t open the attachment. Instead, shortly afterwards they sent an email back to the attackers that contained their own malware. It’s clear that, having detected that they were being targeted, the Hellsing group was intent on identifying the attackers and gathering intelligence on their activities.
Hellsing found itself on under a spear-phishing attack by the Naikon APT group – and struck back #KLReport
Tweet
In the past, we’ve seen APT groups accidentally treading on each other’s toes – for example, stealing address books from victims and then mass-mailing everyone on each of the lists. But an ATP-on-APT attack is unusual.
Grabit and run
Many targeted attack campaigns focus on large enterprises, government agencies and other high-profile organisations. So it’s easy to read the headlines and imagine that such organisations are the only ones on the radar of the attackers. However, one of the campaigns we reported last quarter showed clearly that it’s not only ‘big fish’ that attackers are interested in. Every business is a potential target – for its own assets, or as a way of infiltrating another organisation.
The Grabit cyber-espionage campaign is designed to steal data from small- and medium-sized organisations – mainly based in Thailand, Vietnam and India, although we have also seen victims in the US, UAE, Turkey, Russia, China, Germany and elsewhere. The targeted sectors include chemicals, nanotechnology, education, agriculture, media and construction. We estimate that the group behind the attacks has been able to steal around 10,000 files.
The malware is delivered in the form of a Word document attached to an email. The document contains a malicious macro named ‘AutoOpen’. This macro opens a socket over TCP and sends an HTTP request to a remote server that was hacked by the group to serve as a malware hub. Then the program used to carry out the spying operation is downloaded from this server. In some cases, the macro is password protected (the attackers seem to have forgotten that a DOC file is actually an archive; and when it’s opened in an editor, macro strings are shown in clear-text). The attackers control compromised computers using a commercial spying tool called HawkEye (from HawkEyeProducts). In addition, they use a number of Remote Administration Tools (RATs).
The attackers have implemented some techniques designed to make Grabit hard to analyze,, including variable code sizes, code obfuscation and encryption. On the other hand, they fail to cover their tracks in the system. The result is a ‘weak knight in heavy armor’, suggesting that the attackers didn’t write all the code themselves.
The return of Duqu
In spring 2015, during a security sweep, Kaspersky Lab detected a cyber-intrusion affecting several internal systems. The full-scale investigation that followed uncovered the development of a new malware platform from one of the most skilled, mysterious and powerful groups in the APT world – Duqu, sometimes referred to as the step-brother of Stuxnet. We named this new platform ‘Duqu 2.0’.
The malware platform was designed to survive almost exclusively in the memory of infected systems. #KLReport
Tweet
In the case of Kaspersky Lab, the attack took advantage of a zero-day vulnerability in the Windows kernel (patched by Microsoft on 9 June 2015) and possibly up to two others (now patched) that were also zero-day vulnerabilities at the time. The main goal of the attackers was to spy on Kaspersky Lab technologies, ongoing research and internal processes.
However, Kaspersky Lab was not the only target. Some Duqu 2.0 infections were linked to the P5+1 events related to negotiations with Iran about a nuclear deal. The attackers appear to have launched attacks at the venues for some of these high-level talks. In addition, the group launched a similar attack related to the 70th anniversary event of the liberation of Auschwitz-Birkenau.
One of Duqu 2.0’s most notable features was its lack of persistence, leaving almost no traces in the system. The malware made no changes to the disk or system settings: the malware platform was designed in such a way that it survives almost exclusively in the memory of infected systems. This suggests that he attackers were confident that they could maintain their presence in the system even if an individual victim’s computer was re-booted and the malware was cleared from memory.
The Duqu 2.0 technical paper and analysis of the persistence module can be found on our web site.
Malware stories
Simda’s hide-and-seek malware business
In April, Kaspersky Lab was involved in the take-down of the Simda botnet, co-ordinated by the Interpol Global Complex for Innovation. The investigation was started by Microsoft and expanded to other participants, including Trend Micro, the Cyber Defense Institute, officers from the Dutch National High Tech Crime Unit (NHTCU), the FBI, the Police Grand-Ducale Section Nouvelles Technologies in Luxembourg, and the Russian Ministry of the Interior’s Cybercrime Department “K” supported by the INTERPOL National Central Bureau in Moscow.
As a result of the operation, 14 servers in the Netherlands, the US, Luxembourg, Poland and Russia were taken down. Preliminary analysis of some of the sink-holed server logs revealed 190 countries that had been affected by the botnet.
Preliminary analysis revealed 190 countries that had been affected by the Simda botnet. #KLReport
Tweet
The bots are distributed via a series of infected web sites that re-direct visitors to exploit kits. The bots download and run additional components from their own update servers and are able to modify the hosts file on the infected computer: in this way, once-infected computers can keep sending out HTTP requests to the malicious servers, indicating that they are still vulnerable to re-infection using the same exploit kits.
Although the Simda botnet is relatively large, with an estimated 770,000 infected computers, the authors went to great lengths to try and make it ‘fly under the radar’ of anti-malware systems. The malware is able to detect emulation, security tools and virtual machines; it uses a number of methods to detect research sandbox environments with a view to tricking researchers by consuming all CPU resources or notifying the botnet owner about the external IP address of the research network; and it implements server-side polymorphism.
Simda also de-activates itself after a short time. This is closely related to the purpose of this particular botnet: it’s a delivery mechanism, designed to disseminate potentially unwanted and malicious software. The distributors wanted to guarantee that only their client’s malware would be installed on infected computers.
Kaspersky Lab products currently detect hundreds of thousands of modifications of Simda, together with many different third-party malicious programs distributed using the Simda botnet. You can use our free Simda bot IP scanner to check if your IP has connected to a Simda C2 server in the past.
Phishing, but not as we know it
Early in 2014 a serious vulnerability in the OAuth and OpenID protocols was discovered by Wang Jing, a PHD student at the Nanyang Technological University in Singapore. He found what he named the ‘covert redirect’ vulnerability, which could allow an attacker to steal data following authentication (a summary of the problem, including a link to Jing’s blog, can be found on Threatpost).
Recently, we discovered a phishing campaign that takes advantage of the OAuth vulnerability. OAuth lets customers of online services give third parties limited access to their protected resources without sharing their credentials. It is commonly used by applications for social networks – for example, to obtain access to someone’s contact lists or other data.
The Kaspersky Lab customer who reported the attack received an email saying that someone had used their Windows Live ID and asking them to follow a link to the Windows Live site and follow the security requirements outlined there.
Do not allow untrusted applications to access your data #KLReport
Tweet
On the face of it, it seems like a standard phishing technique – one that would result in the victim being re-directed to a fake site. But in this case, the link led to the legitimate site. The victim’s login credentials aren’t stolen and they are logged in to the legitimate site. However, after authorization, the victim receives a request for a range of permissions from an unknown application. This can include automatic login, access to profile information, contact list and email addresses. If the victims hands over these rights, it offers the cybercriminals access to their personal information – information that they can use to distribute spam, phishing links or for other fraudulent purposes.
We would recommend the following to safeguard your personal data.
- Do not click on links you receive by email or in messages on social networks.
- Do not allow untrusted applications to access your data.
- Before you agree to such requests, carefully read the description of the access rights being requested by an application
- Read reviews and feedback on the application on the Internet.
- Review the rights of currently installed applications and modify the settings if you need to.
Smart cities but not-so-smart security
The use of CCTV systems by governments and law enforcement agencies for surveilling public places has grown enormously in recent years. Most of us accept them as a reasonable trade-off between privacy and security. However, this rather assumes that the data gathered using this technology will be handled securely and responsibly, to ensure that the benefits aren’t outweighed by any potential dangers.
Many CCTV cameras have a wireless connection to the Internet, enabling police to monitor them remotely. However, this is not necessarily secure: it’s possible for cybercriminals to passively monitor security camera feeds, to inject code into the network – thereby replacing a camera feed with fake footage – or to take systems offline. Two security researchers (Vasilios Hioureas from Kaspersky Lab and Thomas Kinsey from Exigent Systems) recently conducted research into the potential security weaknesses in CCTV systems in one city. You can read Vasilios’s report on our web site).
Aspects of life are being made digital & security should be considered as part of the design stage #KLReport
Tweet
The researchers started by looking at the surveillance equipment in locations across the city. Unfortunately, there had been no attempt to mask the branding of the cameras, so it was easy to determine the makes and models of the cameras, examine the relevant specs and create their own scale model in the lab. The equipment being used provided effective security controls, but these controls were not being implemented. Data packets passing across the mesh network were not being encrypted, so that an attacker would be able to create their own version of the software and manipulate data travelling across it.
It’s important to note that they did not attempt to hack into the real network, but analyzed the hardware and communication protocols and built a scale model. The network topology of the surveillance camera network is unlike a standard home wireless network. On a home network, all devices connect to the Internet and one another through a router. Any device connected to that router could potentially trick the other devices into thinking it’s the router and monitor or change data by performing a Man-in-the-Middle attack.


The surveillance camera network is more complicated, because of the distances the data needs to travel. The data must travel from any given camera through a series of nodes eventually leading back to a hub (in a real world implementation, this might be a police station). The traffic follows the path of least resistance where each node has the ability to communicate with several others and selects the easiest path back to the hub.
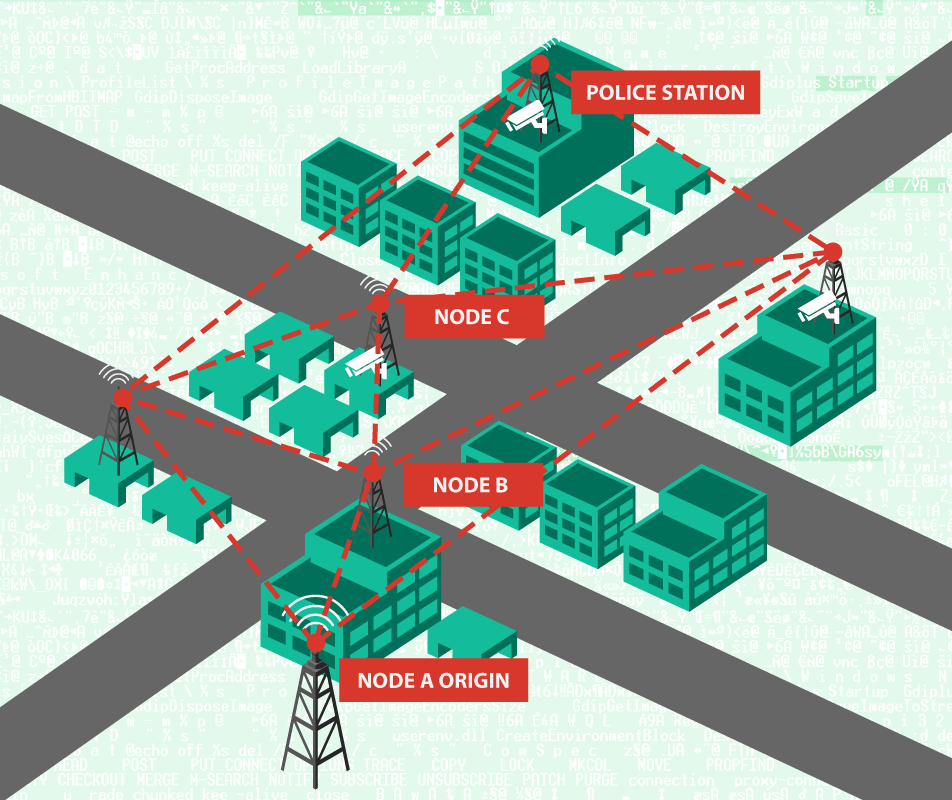
Hioureas and Kinsey built a series of fake nodes that purported to offer a direct line of communication to a simulated police station. Since they knew all the protocols used on the network, they were able to create a Man-in-the-Middle node that seemed to offer the path of least resistance, causing the real nodes to relay their traffic through their malicious node.
One potential use for attackers would be to spoof footage sent to a police station. This could make it appear as if there was an incident in one location, thereby distracting police from a real attack occurring elsewhere in the city.
The researchers reported these issues to the authorities responsible for the city surveillance systems concerned and they are in the process of fixing the security problems. In general, it’s important that WPA encryption, protected by a strong password, is implemented in these networks; that labelling is removed from hardware, to make it harder for would-be attackers to find out how the equipment operates; and that footage is encrypted as it travels through the network.
The wider issue here is that more and more aspects of everyday life are being made digital: if security isn’t considered as part of the design stage, the potential dangers could be far-reaching – and retro-fitting security might not be straightforward. The Securing Smart Cities initiative, supported by Kaspersky Lab, is designed to help those responsible for developing smart cities to do so with cyber-security in mind.
Statistics
All the statistics used in this report were obtained using the Kaspersky Security Network (KSN), a distributed antivirus network that works with various anti-malware protection components. The data was collected from KSN users who agreed to provide it. Millions of Kaspersky Lab product users from 213 countries and territories worldwide participate in this global exchange of information about malicious activity.
Mobile threats
Mobile banker Trojans still remain among the top mobile threats. In our Q1 2015 report, we mentioned Trojan-SMS.AndroidOS.OpFake.cc, which could attack at least 29 banking and financial applications. The latest version of this Trojan can now attack 114 banking and financial applications. Its main goal is to steal the user’s online credentials. Serving the same purpose, it also attacks several popular email applications.
Trojan-Spy.AndroidOS.SmsThief.fc also deserves a mention. Cybercriminals managed to add their code into the original banking application without affecting its operation, making this Trojan more difficult to detect.
The latest version of Trojan-SMS.AndroidOS.Opfake.cc can now attack 114 banking and financial applications. #KLReport
Tweet
A new iOS Trojan, Trojan.IphoneOS.FakeTimer.a, emerged in Q2. It is interesting in that it is an iOS version of a malicious Android app which emerged several years ago. FakeTimer.a attacks even non-jailbroken devices. Its payload is rather primitive: it is a regular phishing application created to steal money from Japanese users.
In Q2, Trojans which can use root privileges to display advertisements to users or install advertising applications became especially visible. A total of six such malicious programs landed in the Q2 TOP 20 of malicious malware.
The number of new mobile threats
In Q2 2015, Kaspersky Lab mobile security products detected 291,887 new malicious mobile programs, a 2.8-fold increase on Q1 2015.
Kaspersky Lab mobile security products detected 291,887 new malicious mobile programs #KLReport
Tweet
The number of installation packages detected was 1,048,129 – this is seven times as many as in the previous quarter.

Number of malicious installation packages and new malicious mobile programs detected (Q4 2014 – Q2 2015)
Distribution of mobile malware by type
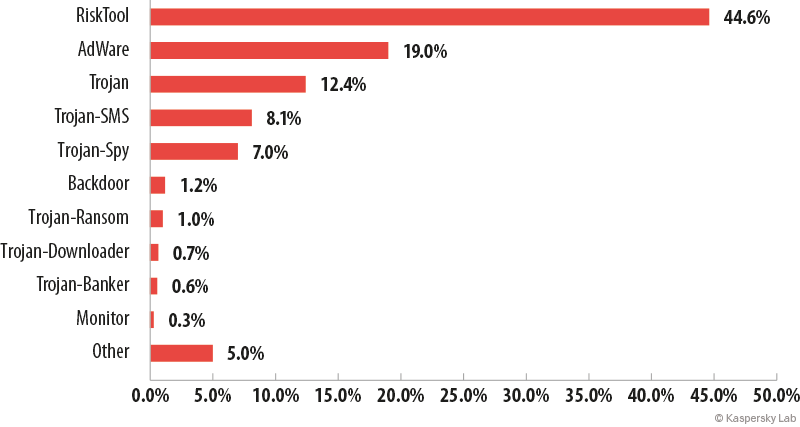
Distribution of new mobile malware by type, Q2 2015
The ranking of malware objects for mobile devices for the second quarter of 2015 was headed by RiskTool (44.6%). These are legitimate applications that are potentially dangerous for users – if used carelessly or manipulated by a cybercriminal, they could lead to financial losses.
Potentially unwanted advertising apps came second with 19%.
SMS Trojans have previously led this ranking, but in Q2 they were only in the fourth place with 8.1% – this is 12.9% lower than in Q1. The lower share taken by these malicious programs is in part accounted for by the fact that those who were previously active distributing SMS Trojans have started using ‘cleaner’ monetization techniques (as testified by the increased RiskTool shares), or prefer to use other types of malware. Thus the Trojan share increased from 9.8% in Q1 to 12.4% in Q2.
Top 20 malicious mobile programs
Please note that, starting from this quarterly report, we are publishing the ranking of malicious programs, which does not include potentially dangerous or unwanted programs such as RiskTool or adware.
| Name | % of attacked users* | |
| 1 | DangerousObject.Multi.Generic | 17.5% |
| 2 | Trojan-SMS.AndroidOS.Podec.a | 9.7% |
| 3 | Trojan-SMS.AndroidOS.Opfake.a | 8.0% |
| 4 | Backdoor.AndroidOS.Obad.f | 7.3% |
| 5 | Trojan-Downloader.AndroidOS.Leech.a | 7.2% |
| 6 | Exploit.AndroidOS.Lotoor.be | 5.7% |
| 7 | Trojan-Spy.AndroidOS.Agent.el | 5.5% |
| 8 | Trojan.AndroidOS.Ztorg.a | 3.1% |
| 9 | Trojan.AndroidOS.Rootnik.a | 3.0% |
| 10 | Trojan-Dropper.AndroidOS.Gorpo.a | 2.9% |
| 11 | Trojan.AndroidOS.Fadeb.a | 2.7% |
| 12 | Trojan-SMS.AndroidOS.Gudex.e | 2.5% |
| 13 | Trojan-SMS.AndroidOS.Stealer.a | 2.5% |
| 14 | Exploit.AndroidOS.Lotoor.a | 2.1% |
| 15 | Trojan-SMS.AndroidOS.Opfake.bo | 1.6% |
| 16 | Trojan.AndroidOS.Ztorg.b | 1.6% |
| 17 | Trojan.AndroidOS.Mobtes.b | 1.6% |
| 18 | Trojan-SMS.AndroidOS.FakeInst.fz | 1.6% |
| 19 | Trojan.AndroidOS.Ztorg.pac | 1.5% |
| 20 | Trojan-SMS.AndroidOS.FakeInst.hb | 1.4% |
* Percentage of users attacked by the malware in question, relative to all users attacked
The top position in the rankings was occupied by DangerousObject.Multi.Generic (17.5%). This is how new malicious applications are detected by the KSN cloud technologies, which help our products to significantly shorten the response time to new and unknown threats.
Trojan-SMS.AndroidOS.Podec.a (9.7%) has been among the Top Three malicious mobile programs for three quarters in a row due to its active dissemination.
Trojan-SMS.AndroidOS.Opfake.a (8.0%) has been quickly rising to the top lines of the ranking. While in Q3 2014 it was in the 11th place only,it is now in the TOP 3 of mobile malware. Obfake.bo, another representative of this malware family, is in 15th place.
It is also worth mentioning the appearance of Backdoor.AndroidOS.Obad in the TOP 20 ranking – in fact, it jumped to fourth place all at once. This is a multi-functional Trojan, capable of sending SMS to premium-rate numbers; downloading other malware programs, installing them on the infected device and/or sending them further via Bluetooth; and remotely performing commands in the console. We wrote about it two years ago, and its capabilities have remained virtually unchanged ever since.
Another interesting thing is that although this ranking does not include adware programs, six of the TOP 20 malicious mobile programs use advertisements as the main vehicle of monetization. Unlike regular advertisement modules, Trojan.AndroidOS.Rootnik.a, three programs of the Trojan.AndroidOS.Ztorg family, Trojan-Downloader.AndroidOS.Leech.a and Trojan.AndroidOS.Fadeb.a do not carry any productive payload with them. Their goal is to deliver to the user as much advertising as possible in various ways, including installation of new adware programs. These Trojans can use root privileges to conceal themselves in the system folder – this makes it very difficult to delete them.
Mobile banker Trojans
In Q2 2015, we detected 630 mobile banker Trojans. It should be noted that the number of new malware programs belonging to this category is now growing at a much slower rate.

Number of mobile banker Trojans detected by Kaspersky Lab’s solutions (Q3 2014 – Q2 2015)

Geography of mobile banking threats in Q2 2015
(number of users attacked)
The number of attacked users depends on the overall number of users within each individual country. To assess the risk of a mobile banker Trojan infection in each country, and to compare it across countries, we made a country ranking according to the percentage of users attacked by mobile banker Trojans.
Top 10 counties attacked by mobile banker Trojans (ranked by percentage of users attacked):
| Country* | % of users attacked by mobile bankers** | |
| 1 | Republic of Korea | 2.37% |
| 2 | Russia | 0.87% |
| 3 | Uzbekistan | 0.36% |
| 4 | Belarus | 0.30% |
| 5 | Ukraine | 0.29% |
| 6 | China | 0.25% |
| 7 | Kazakhstan | 0.17% |
| 8 | Australia | 0.14% |
| 9 | Sweden | 0.13% |
| 10 | Austria | 0.12% |
* We eliminated countries from this ranking where the number of users of Kaspersky Lab’s mobile security product is lower than 10,000
** Percentage of unique users in each country attacked by mobile banker Trojans, relative to all users of Kaspersky Lab’s mobile security product in the country
Mobile bankers proliferate most actively in Korea. Cybercriminals are also historically active in Russia and other post-Soviet countries. It is some of these countries that occupy four out of five positions in the ranking.
An indication of how popular mobile banker Trojans are with cybercriminals in each country, may be provided by the percentage of users who were attacked at least once by mobile banker Trojans during the reported three month period, relative to all users in the same country whose mobile security product was activated at least once in the reporting period. This ranking is different from the one above:
TOP 10 countries by the percentage of users attacked by mobile bankers relative to all attacked users
| Country * | % of users attacked by mobile bankers, relative to all attacked users * | |
| 1 | Republic of Korea | 31.72% |
| 2 | Russia | 10.35% |
| 3 | Australia | 6.62% |
| 4 | Austria | 6.03% |
| 5 | Japan | 4.73% |
| 6 | Uzbekistan | 4.17% |
| 7 | Belarus | 3.72% |
| 8 | Ecuador | 3.50% |
| 9 | Ukraine | 3.46% |
| 10 | Switzerland | 3.09% |
* We eliminated countries from this ranking where the number of users of Kaspersky Lab’s mobile security product is lower than 10,000
** Percentage of unique users in each country attacked by mobile banker Trojans, relative to all unique users attacked by mobile malware in the country
In Korea, almost one third of all users attacked by mobile malware were attacked by mobile bankers in particular. In Russia, every tenth attacked user came under a mobile banker attack. In other countries, this percentage is lower. Interestingly, there are four countries in this TOP 10 which are also in the TOP 5 of most secure counties with the lowest probability of mobile malware infection – these are Australia, Austria, Japan and Switzerland.
The geography of mobile threats

The geography of mobile malware infection attempts in Q2 2015
(percentage of all users attacked)
Top 10 countries attacked by mobile malware:
| Country* | % of users attacked** | |
| 1 | China | 16.34% |
| 2 | Malaysia | 12.65% |
| 3 | Nigeria | 11.48% |
| 4 | Bangladesh | 10.89% |
| 5 | Tanzania | 9.66% |
| 6 | Algeria | 9.33% |
| 7 | Uzbekistan | 8.56% |
| 8 | Russia | 8.51% |
| 9 | Ukraine | 8.39% |
| 10 | Belarus | 8.05% |
* We eliminated countries from this ranking where the number of users of Kaspersky Lab’s mobile security product is lower than 10,000
** Percentage of unique users attacked in each country relative to all users of Kaspersky Lab’s mobile security product in the country
This ranking is led by China, where 16.34% of all users of Kaspersky Lab’s product were attacked at least once during the three month period. Malaysia is in second place with 12.65%. Russia (8.51%), Ukraine (8.39%) and Belarus (8.05%) close the TOP 10 ranking, below some Asian and African countries.
Korea took 11th place in this ranking with 7.46%. Let us remind the reader that mobile banker Trojans are very popular with the Korean cybercriminals: 31.72% of all users attacked by mobile malware were the victim of a mobile banking Trojan attack.
The most secure countries in this respect are:
| Country | % of users attacked | |
| 1 | Japan | 1.06% |
| 2 | Canada | 1.82% |
| 3 | Austria | 1.96% |
| 4 | Australia | 2.16% |
| 5 | Switzerland | 2.19% |
Vulnerable applications used by fraudsters
The ranking of vulnerable applications below is based on information about the exploits blocked by our products. These exploits were used by cybercriminals in Internet attacks and in attempts to compromise local applications, including those installed on mobile devices.
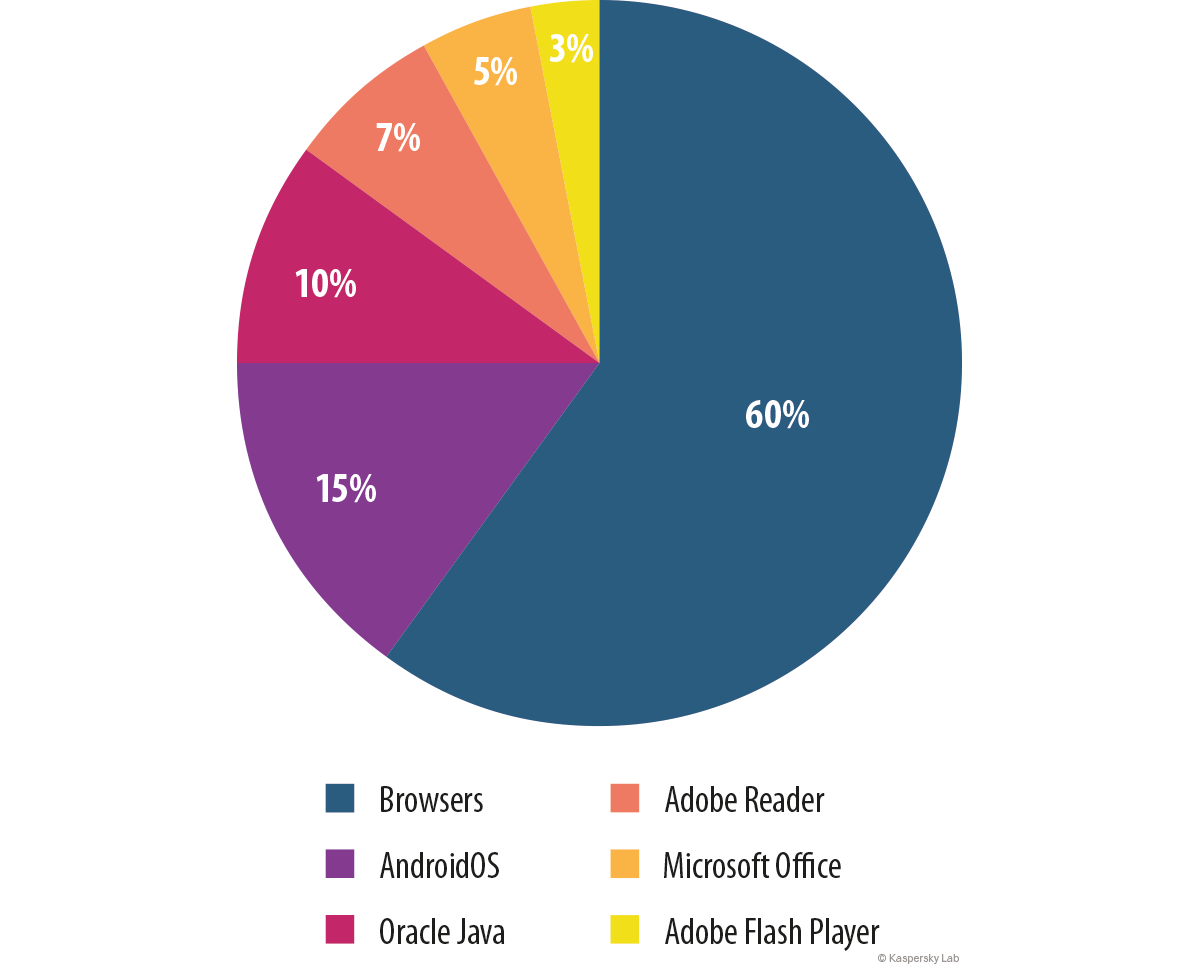
Distribution of exploits used in attacks by type of application attacked, Q2 2015
The rating of exploits has seen little change from the first quarter. The Browsers category (60%) maintained its top position in the Q2 2015. Currently most exploit packs contain a pack of exploits for Adobe Flash Player and Internet Explorer. It is worth mentioning the growing number of exploits for Adobe Flash Player (up by six percentage points) which is caused by the large number of spam mass mailings containing malicious PDF documents.
The number of exploits for Java continues to decrease (down four percentage points): in Q2 we did not see any new exploits for Java.
In the second quarter of 2015 we registered the use of four new vulnerabilities in Adobe Flash Player:
- CVE-2015-3113
- CVE-2015-3104
- CVE-2015-3105
- CVE-2015-3090
Although the share of exploits for Adobe Flash Player in our rating is only 3%, there are many more of them in the “wild”. When considering these statistics, we should take into account that Kaspersky Lab technologies detect exploits at various stages. The Browsers category also includes detection of landing pages that “distribute” exploits. According to our observations, they are most often exploits for Adobe Flash Player
Online threats (Web-based attacks)
The statistics in this section were derived from web antivirus components that protect users from attempts to download malicious objects from a malicious/infected website. Malicious websites are created deliberately by malicious users; infected sites include those with user-contributed content (such as forums), as well as compromised legitimate resources.
Online threats in the banking sector
In the second quarter of 2015, Kaspersky Lab solutions blocked attempts to launch malware capable of stealing money via online banking on the computers of 755,642 users. This figure represents an 18.7% decrease compared to the previous quarter (735,428).
There were 5,903,377 registered notifications about attempted financial malware infections #KLReport
Tweet
A total of 5,903,377 notifications of malicious activity by programs designed to steal money via online access to bank accounts were registered by Kaspersky Lab security solutions in Q2 2015.

Number of attacks by financial malware, Q2 2015
Geography of attacks
In the second quarter of 2015, we changed the methodology used to create the rating of countries affected by the malicious activity of banking Trojans. In our previous reports, the Top 10 was made using the number of users attacked. Although this aspect is very important, it depends on the number Kaspersky Lab product users in the countries.
To evaluate and compare the degree of risk of being infected by banking Trojans which user computers are exposed to worldwide, we calculate the percentage of Kaspersky Lab product users who encountered this threat during the reporting period in the country, of all users of our products in this county.

Geography of banking malware attacks in Q2 2015 (the percentage of users attacked)
Top 10 countries by the percentage of users attacked
| Country* | % of users attacked ** | |
| 1 | Singapore | 5.28% |
| 2 | Switzerland | 4.16% |
| 3 | Brazil | 4.07% |
| 4 | Australia | 3.95% |
| 5 | Hong Kong | 3.66% |
| 6 | Turkey | 3.64% |
| 7 | New Zealand | 3.28% |
| 8 | South Africa | 3.13% |
| 9 | Lebanon | 3.10% |
| 10 | UAE | 3.04% |
* We excluded those countries in which the number of Kaspersky Lab product users is relatively small (less than 10,000)
** Unique users whose computers have been targeted by web attacks as a percentage of all unique users of Kaspersky Lab products in the country
In Q2 2015, Singapore took the lead in the percentage of Kaspersky Lab users attacked by banking Trojans. Noticeably, most countries in the TOP 10 have a high level of technological and banking system development, which draws the attention of cybercriminals.
In Russia, 0.75% users encountered banking Trojans at least once during the quarter, in the US – 0.89%, in Spain – 2.02%, in the UK – 1.58%, in Italy – 1.57% , in Germany – 1.16%.
The TOP 10 banking malware families
The table below shows the Top 10 malicious programs most commonly used in Q2 of 2015 to attack online banking users, based on the number of users attacked:
| Name | Number of notifications | Number of users attacked | |
| 1 | Trojan-Downloader.Win32.Upatre | 3888061 | 419940 |
| 2 | Trojan-Spy.Win32.Zbot | 889737 | 177665 |
| 3 | Trojan-Banker.Win32.ChePro | 264534 | 68467 |
| 4 | Backdoor.Win32.Caphaw | 72128 | 25923 |
| 5 | Trojan-Banker.Win32.Banbra | 56755 | 24964 |
| 6 | Trojan.Win32.Tinba | 175729 | 22942 |
| 7 | Trojan-Banker.AndroidOS.Marcher | 60819 | 19782 |
| 8 | Trojan-Banker.AndroidOS.Faketoken | 43848 | 13446 |
| 9 | Trojan-Banker.Win32.Banker | 23225 | 9209 |
| 10 | Trojan-Banker.Win32.Agent | 28658 | 8713 |
The majority of the Top 10 malicious programs work by injecting random HTML code in the web page displayed by the browser and intercepting any payment data entered by the user in the original or inserted web forms.
The Top 3 banking malicious programs remain unchanged from the previous quarter. Trojan-Downloader.Win32.Upatre kept its leading position in the rating. Malicious programs in this family are relatively simple and no larger than 3.5 KB. They usually download a Trojan-Banker belonging to a family known as Dyre/Dyzap/Dyreza. The list of financial institutions attacked by the banker Trojan depends on the configuration file that is downloaded from the Command-and-Control center.
In Q2 2015, the new banking Trojans entered the rating – Backdoor.Win32.Caphaw, Trojan-Banker.AndroidOS.Marcher and Trojan-Banker.AndroidOS.Faketoken.
Backdoor.Win32.Caphaw was first detected in 2011. It utilizes the Man-in-the-Browser technique to steal online banking credentials of the customers.
Trojan-Banker.AndroidOS.Faketoken and Trojan-Banker.AndroidOS.Marcher attack Android-based mobile devices. Faketoken works in partnership with computer Trojans. To distribute this malware, cybercriminals use social engineering techniques. When a user visits his online banking account, the Trojan modifies the page, asking him to download an Android application which is allegedly required to securely confirm the transaction. In fact the link leads to the Faketoken application.
Once Faketoken is on the user’s smartphone, the cybercriminals gain access to the user’s banking account via the computer infected with a banking Trojan and the compromised mobile device allows them to intercept the one-time confirmation code (mTAN). The second mobile Trojan is Trojan-Banker.AndroidOS.Marcher. After infecting a device, the malware tracks the launch of just two apps – the mobile banking customer of one of the European banks and Google Play. If the user starts Google Play, Marcher displays a false window requesting credit card data which then go to the fraudsters. The same method is used by the Trojan if the user starts the banking application.
Financial threats
Financial threats are not limited to banker malware that attacks online banking customers.

Financial malware: distribution by malware type
In Q2 2015, the proportion of banking malware increased from 71% to 83% compared with the previous quarter. The second most widespread financial threat was Bitcoin miners – malicious software that uses computing resources of the victim’s computer to generate bitcoins. In the previous quarter, this category of malware was in third place. Of note is the fact that some legitimate software developers secretly integrate Bitcoin-miners in their applications.
Top 20 malicious objects detected online
In the second quarter of 2015, Kaspersky Lab’s web antivirus detected 26,084,253 unique malicious objects: scripts, exploits, executable files, etc.
Kaspersky Lab detected and repelled a total of 379,972,834 malicious attacks from online resources #KLReport
Tweet
We identified the 20 most active malicious objects involved in online attacks against users’ computers. These 20 accounted for 96.5% of all attacks on the Internet.
Top 20 malicious objects detected online
| Name* | % of all attacks** | |
| 1 | AdWare.JS.Agent.bg | 47.66% |
| 2 | Malicious URL | 32.11% |
| 3 | Trojan.Script.Generic | 4.34% |
| 4 | AdWare.Script.Generic | 4.12% |
| 5 | Trojan.Script.Iframer | 3.99% |
| 6 | AdWare.JS.Agent.bt | 0.74% |
| 7 | Exploit.Script.Blocker | 0.56% |
| 8 | Trojan.Win32.Generic | 0.49% |
| 9 | AdWare.AndroidOS.Xynyin.a | 0.49% |
| 10 | Trojan-Downloader.Win32.Generic | 0.37% |
| 11 | Trojan-Ransom.JS.Blocker.a | 0.34% |
| 12 | Trojan-Clicker.JS.Agent.pq | 0.23% |
| 13 | AdWare.JS.Agent.an | 0.20% |
| 14 | AdWare.JS.Agent.by | 0.19% |
| 15 | Trojan.Win32.Invader | 0.12% |
| 16 | Trojan-Downloader.Win32.Genome.qhcr | 0.11% |
| 17 | AdWare.Win32.Amonetize.ague | 0.11% |
| 18 | AdWare.Win32.MultiPlug.nnnn | 0.10% |
| 19 | AdWare.NSIS.Agent.cv | 0.09% |
| 20 | Trojan-Downloader.Script.Generic | 0.09% |
* These statistics represent the detection verdicts of the web antivirus module. Information was provided by users of Kaspersky Lab products who consented to share their local statistical data.
** The percentage of all web attacks recorded on the computers of unique users.
The Top 20 is largely made up of verdicts assigned to objects used in drive-by attacks, as well as adware programs.
Aggressive distribution of advertising programs affected the rating: 10 out of 20 positions were occupied by advert-related objects. In first place is the script AdWare.JS.Agent.bg which is implemented by inserting adware in arbitrary web pages. It could even push down Malicious URL, the verdict we use for the links from the black list which are ranked second in Q2 2015.
Of interest is the appearance of the AdWare.AndroidOS.Xynyin.a verdict – it’s unusual to see a verdict for Android malware in the rankings for malware on users’ computers. The program corresponding to this verdict is an advertising module for Android which is embedded in different applications (for example, in programs “accelerating” the work of the phone). One such application was popular in March and April of this year when it was actively downloaded by users. Since Google Play does not provide such applications these applications were downloaded from the Internet mostly via the victims’ computers.
The Trojan-Ransom.JS.Blocker.a verdict is a script which tries to block the browser using a periodic page update and displays the message asking the victim to pay a “fine” to the specified e-wallet for viewing inappropriate material. The script is mostly encountered on porn sites.
Top 10 countries where online resources are seeded with malware
The following stats are based on the physical location of the online resources that were used in attacks and blocked by our antivirus components (web pages containing redirects to exploits, sites containing exploits and other malware, botnet command centers, etc.). Any unique host could be the source of one or more web attacks.
In order to determine the geographical source of web-based attacks, domain names are matched up against their actual domain IP addresses, and then the geographical location of a specific IP address (GEOIP) is established.
In Q2 2015, Kaspersky Lab solutions blocked 379,972,834 attacks launched from web resources located in various countries around the world. 89% of notifications on blocked web attacks were triggered by attacks coming from web resources located in 10 countries.
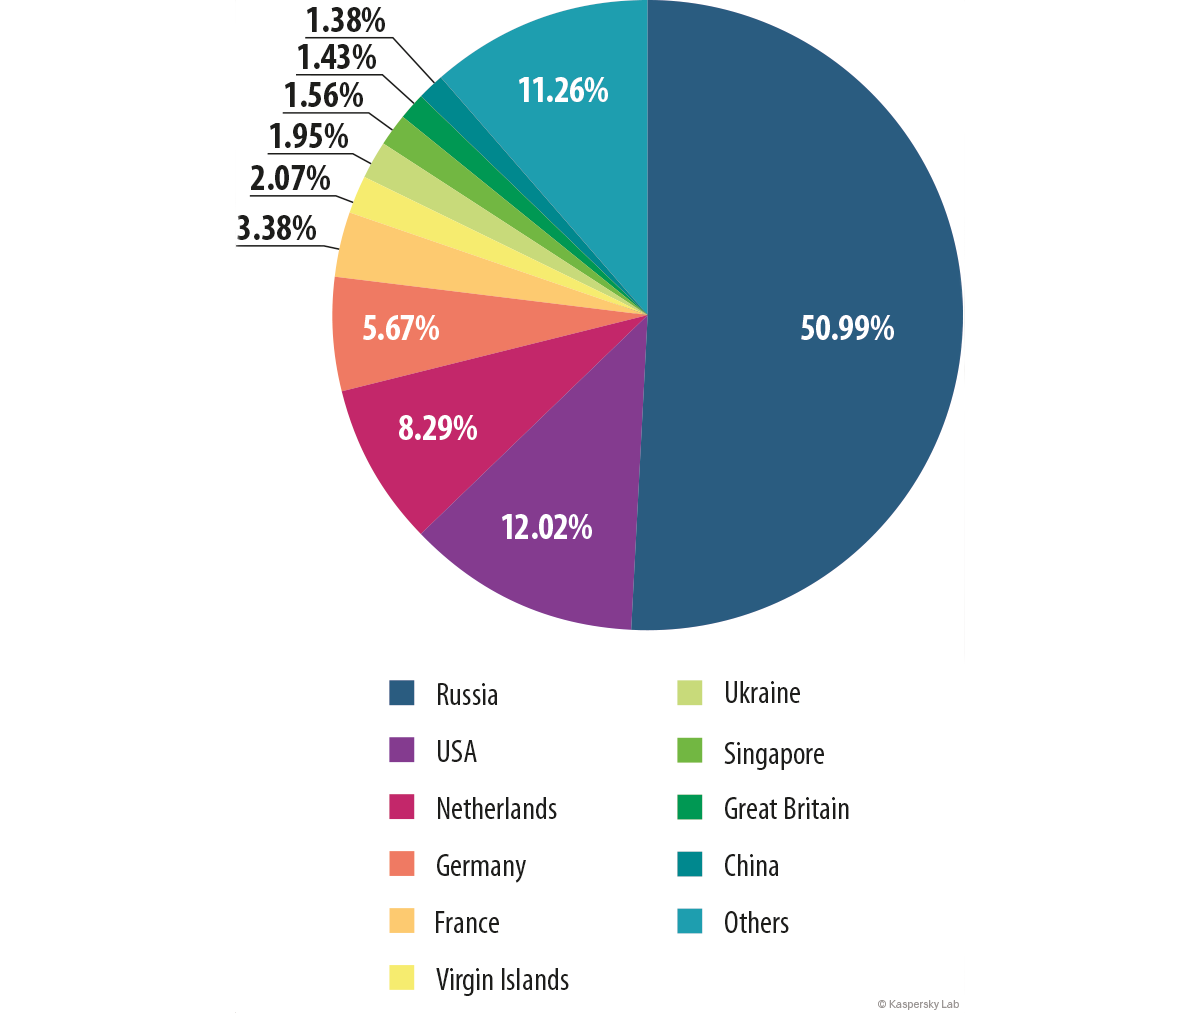
Distribution of web attack sources by country, Q2 2015
Russia (51%) maintained its leadership: this country’s share increased by 11.27%. Switzerland left the Top 10. Singapore came eighth in the ranking with 1.56% of all web attacks.
Countries where users faced the greatest risk of online infection
In order to assess the risk of online infection faced by users in different countries, we calculate the percentage of Kaspersky Lab users in each country who encounter detection verdicts on their machines during the quarter. The resulting data provide an indication of the aggressiveness of the environment in which computers work in different countries.
| Country* | % unique users attacked** | |
| 1 | Russia | 38.98% |
| 2 | Kazakhstan | 37.70% |
| 3 | Ukraine | 35.75% |
| 4 | Syria | 34.36% |
| 5 | Belarus | 33.02% |
| 6 | Azerbaijan | 32.16% |
| 7 | Thailand | 31.56% |
| 8 | Georgia | 31.44% |
| 9 | Moldova | 31.09% |
| 10 | Vietnam | 30.83% |
| 11 | Armenia | 30.19% |
| 12 | Kyrgyzstan | 29.32% |
| 13 | Croatia | 29.16% |
| 14 | Algeria | 28.85% |
| 15 | Qatar | 28.47% |
| 16 | China | 27.70% |
| 17 | Mongolia | 27.27% |
| 18 | Makedonia | 26.67% |
| 19 | Bosnia and Herzegovina | 25.86% |
| 20 | Greece | 25.78% |
These statistics are based on the detection verdicts returned by the web antivirus module, received from users of Kaspersky Lab products who have consented to provide their statistical data.
* These calculations exclude countries where the number of Kaspersky Lab users is relatively small (fewer than 10,000 users).
** Unique users whose computers have been targeted by web attacks as a percentage of all unique users of Kaspersky Lab products in the country.
In Q2 2015, Russia, which was second in the first quarter, regained its top position in the ranking. Since the previous quarter, UAE, Latvia, Tajikistan, Tunisia and Bulgaria have left the Top 20. The newcomers to the rankings were Syria, which rocketed to fourth place (34.36%); Thailand, which was in seventh place (31.56%); Vietnam, in tenth place (30.83%); China (27.70%) and Macedonia (26.67%), which occupied 16th and 18th places respectively.
23.9% of computers connected to the Internet globally were subjected to at least 1 web attack in Q2 #KLReport
Tweet
The countries with the safest online surfing environments included Argentina (13.2%), the Netherlands (12.5%), Korea (12.4%), Sweden (11.8%), Paraguay (10.2%) and Denmark (10.1%).

On average, 23.9% of computers connected to the Internet globally were subjected to at least one web attack during the three months.
Local threats
Local infection statistics for users computers are a very important indicator: they reflect threats that have penetrated computer systems using means other than the Internet, email, or network ports.
Data in this section is based on analyzing statistics produced by antivirus scans of files on the hard drive at the moment they were created or accessed, and the results of scanning removable storage media.
In Q2 2015, Kaspersky Lab’s file antivirus modules detected 110,731,713 unique malicious and potentially unwanted objects.
Top 20 malicious objects detected on users computers
| Name* | % unique users attacked** | |
| 1 | DangerousObject.Multi.Generic | 22.64% |
| 2 | Trojan.Win32.Generic | 15.05% |
| 3 | Trojan.WinLNK.StartPage.gena | 8.28% |
| 4 | AdWare.Script.Generic | 7.41% |
| 5 | Adware.NSIS.ConvertAd.heur | 5.57% |
| 6 | WebToolbar.Win32.Agent.azm | 4.48% |
| 7 | WebToolbar.JS.Condonit.a | 4.42% |
| 8 | Trojan-Downloader.Win32.Generic | 3.65% |
| 9 | Downloader.Win32.MediaGet.elo | 3.39% |
| 10 | Trojan.Win32.AutoRun.gen | 3.29% |
| 11 | Downloader.Win32.Agent.bxib | 3.26% |
| 12 | WebToolbar.JS.CroRi.b | 3.09% |
| 13 | RiskTool.Win32.BackupMyPC.a | 3.07% |
| 14 | Virus.Win32.Sality.gen | 2.86% |
| 15 | Worm.VBS.Dinihou.r | 2.84% |
| 16 | WebToolbar.Win32.MyWebSearch.si | 2.83% |
| 17 | DangerousPattern.Multi.Generic | 2.75% |
| 18 | AdWare.NSIS.Zaitu.heur | 2.70% |
| 19 | AdWare.BAT.Clicker.af | 2.67% |
| 20 | AdWare.Win32.MultiPlug.heur | 2.54% |
* These statistics are compiled from malware detection verdicts generated by the on-access and on-demand scanner modules on the computers of those users running Kaspersky Lab products who have consented to submit their statistical data.
** The proportion of individual users on whose computers the antivirus module detected these objects as a percentage of all individual users of Kaspersky Lab products on whose computers a file antivirus detection was triggered.
In line with the established practice, this ranking represents the verdicts assigned to adware programs or their components (such as AdWare.BAT.Clicker.af), and to worms distributed on removable drives.
The only virus in the rankings – Virus.Win32.Sality.gen – continues to lose ground. The proportion of user machines infected by this virus has been diminishing for a long time. In Q2 2015, Sality was in 14th place with 2.86%, a 0.32% decrease compared to the previous quarter.
Countries where users faced the highest risk of local infection
For each of the countries, we calculated the percentage of Kaspersky Lab product users on whose computers the file antivirus was triggered during the quarter. These statistics reflect the level of personal computer infection in different countries.
Top 20 countries with the highest levels of computer infection
| Country* | % unique users** | |
| 1 | Bangladesh | 60.53% |
| 2 | Vietnam | 59.77% |
| 3 | Pakistan | 58.79% |
| 4 | Mongolia | 58.59% |
| 5 | Georgia | 57.86% |
| 6 | Somali | 57.22% |
| 7 | Nepal | 55.90% |
| 8 | Afghanistan | 55.62% |
| 9 | Algeria | 55.44% |
| 10 | Armenia | 55.39% |
| 11 | Russia | 54.94% |
| 12 | Laos | 54.77% |
| 13 | Iraq | 54.64% |
| 14 | Kazakhstan | 54.23% |
| 15 | Syria | 53.00% |
| 16 | Tunisia | 53.75% |
| 17 | Ethiopia | 53.44% |
| 18 | Ruanda | 53.17% |
| 19 | Ukraine | 53.01% |
| 20 | Cambodia | 52.88% |
These statistics are based on the detection verdicts returned by on-access and on-demand antivirus modules, received from users of Kaspersky Lab products who have consented to provide their statistical data. The data include detections of malicious programs located on users’ computers or on removable media connected to the computers, such as flash drives, camera and phone memory cards, or external hard drives.
* These calculations exclude countries where the number of Kaspersky Lab users is relatively small (fewer than 10,000 users).
** The percentage of unique users in the country with computers that blocked local threats as a percentage of all unique users of Kaspersky Lab products.
In Q2 2015, Bangladesh (60.53%) took the lead as the country with the highest level of computer infection, pushing down Vietnam which has headed the rating for almost two years. Pakistan (58.79%) rocketed from 13th position in the previous quarter to 3rd place in Q2.
The newcomers in the rankings were Georgia (5th position with 57.8%), Russia (11th position with 55%), Tunisia (16th position with 53.7%) and Ukraine (19th position with 53%).
An average of 40% of computers globally faced at least 1 local threat during Q2 2015 #KLReport
Tweet
The safest countries in terms of local infection risks were Sweden (19.7%), Denmark (18.4%) and Japan (15.5%).

An average of 40% of computers globally faced at least one local threat during Q2 2015, which is 0.2% percentage points more than in Q1 2015.
Table of Contents
- Q2 in figures
- Overview
- Targeted attacks and malware campaigns
- Monkey business
- Naikon: gathering geo-political intelligence
- Spying on the spies
- Grabit and run
- The return of Duqu
- Malware stories
- Statistics
- Mobile threats
- The number of new mobile threats
- Distribution of mobile malware by type
- Top 20 malicious mobile programs
- Mobile banker Trojans
- The geography of mobile threats
- Vulnerable applications used by fraudsters
- Online threats (Web-based attacks)
- Online threats in the banking sector
- Top 20 malicious objects detected online
- Top 10 countries where online resources are seeded with malware
- Countries where users faced the greatest risk of online infection
- Local threats
From the same authors


In the same category


IT threat evolution in Q2 2015