

Authors
In February 2007, I went to Warsaw to participate in a conference on network security. In addition to presenting, I took the opportunity to examine the security of the Polish capital’s wireless networks.
I gathered data on WiFi networks and Bluetooth enabled devices. I only analyzed configuration which can be accessed by anyone using a wireless connection. No data was harvested or decrypted. This report does not include information about the physical location of network access points, or the exact names of the networks detected.
The research was conducted on the 20th and 21st of February in the busiest regions of the city, including major shopping malls, at the airport, and at the central railway station.
The first day of scanning was conducted at the central railway station, in the conference hall and around the city. Scanning was conducted both from a car, and while walking around the historic city centre. The following route was taken:
- Prosta
- Okopowa
- Jana Pawła II
- Niepodległosci
- Domaniewska
- Puławska
- Szucha Jana Chrystiana
- Aleje Ujazdowskie
- Nowy Świat
- Aleje Jerozolimskie
- Marszałkowska
- Własysława Andersa
- Aleja Solidarności
- Nowy Zjazd
- Wybrzeże Gdańskie
- Grodzka
- Miodowa
This route passes some of the city’s major squares:
- Plac Na Rozdrożu
- Plac Trzech Krzyży
- Plac Unii Lubelskiej
- Plac Bankowy
- Stare Miasto
The map shows the route taken in the car:
Overall, we covered about 30 kilometers in the car, and approximately 5 kilometers on foot within the Old Town.
On the second day, scanning was conducted on the way to the airport, with additional stops at Arkadia and Marki, two major shopping malls. We finished by collecting data at Okęcie airport.
WiFi networks
Data transmission speed
The speed at which data is transmitted, together with the number of WiFi networks found, tends to indicate how well developed and how popular WiFi technologies are within the area under investigation.
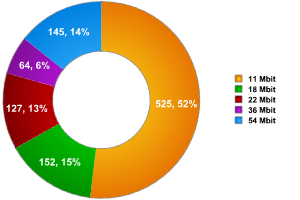
Fig 1: Distribution of WiFi networks according to transmission speed
Most of the networks we detected in Warsaw were relatively slow (11 Mbit/sec), which indicates that WiFi networks are not, as yet, widely used. However, 14% of the networks we detected transmitted data at a higher speed (54Mbit/ sec) which indicates that some high speed access points are being used, and that WiFi networks are becoming more popular. It seems likely that ISPs which offer wireless access are responsible for this 14%.
Equipment manufacturers
Examining the manufacturers of equipment used in a specific area helps us understand which brands are most popular, which in turn helps form a picture of which vulnerabilities may be widespread within a specific region. Experience shows the vulnerabilities are usually found within specific driver versions from individual manufacturers. Consequently, if vulnerable equipment from a specific manufacturer is widely used within a specific area, a large scale epidemic caused by a network worm could be anticipated in that region, or a high number of hacks into wireless networks.
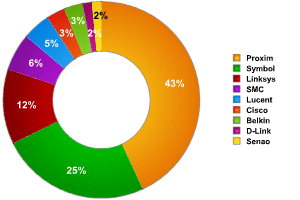
Fig. 2: Distribution of wireless network equipment according to manufacturer
It should be noted that the data only relates to equipment where we were able to determine the manufacturer. In Warsaw, this was less than 20% of all networks detected, but it does nevertheless give some idea of how popular certain manufacturers are.
Data encryption
As previous research has shown, encrypting wireless traffic is not particularly popular/ widespread. This is indicated by the number of networks detected which use WEP (Wired Equivalent Privacy). This basic security, standard for wireless networks and part of IEEE 802.11, makes it possible to encrypt traffic. 802.11 is known to have some significant security flaws which make it possible to break the encryption key used within a couple of minutes. Nonetheless, using WEP does ensure that traffic cannot be eavesdropped on by accident.
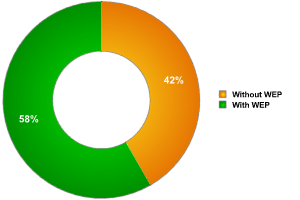
Fig 3. Distribution of networks according to encryption
Types of wireless network
Statistics on the types of network access available indicate whether the local population prefers to use public access points, or simple connections between a few machines.
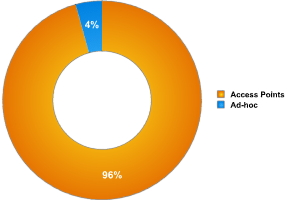
Fig. 4: Distribution of networks by type
A mere 4% of networks detected were ad-hoc, which strongly indicates that the population of Warsaw uses fixed access points rather than temporary WiFi connections.
Subliminal advertising
One interesting phenomenon is the tendency to use access points for subliminal advertising. Every client which attempts to connect to a network will look at the list of accessible networks. Using web addresses in the names of access points may be a type of subliminal advertising, with the hope that users will then go and look at the site in question. It should be said that not many access points use this approach, but it may be the start of a trend.
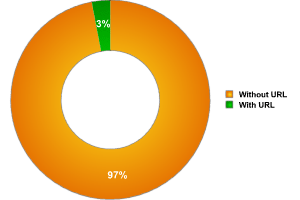
Fig. 5: Distribution of access points with a URL in the access point name
As the diagram above shows, only 3% of the access points detected in Warsaw use URLs in their names. This approach was also observed in other cities where we conducted research.
Additional observations
During my research I followed the scanning process carefully, and noticed an interesting fact: in the shopping malls, where a lot of the restaurants and cafes had their own access points, there were other people who were attempting to scan the wireless networks. I reached this conclusion by looking at the activity of those using the network; they were sending a range of requests and querying a number of networks, but not actually visiting any sites. This indicates that someone apart from me was scanning the network. It seems likely that these were malicious users who were attempting to gain access to the Internet at the expense of other users, or hackers attempting to find unprotected networks, sniff network traffic etc. It’s interesting that even though I spent a small amount of my two days in Warsaw scanning I was still able to detect potentially malicious users. It’s clear that Warsaw hackers are very interested in WiFi networks and technologies; this can also be seen by taking a look at the names of access points. While scanning, I found access points with names such as ‘Your router has been hacked’ ‘Your journey ends here’. It seems likely that these access points were hacked, and the malicious users changed the access point names in an attempt to draw attention to themselves.
Bluetooth devices
The aim of scanning Bluetooth devices is to detect the number of devices which have Bluetooth in ‘visible to all mode’. Such devices are a potential target for hackers, and it would be possible to infect with self propagating malware. I also collected statistics on device manufacturers, and have included a little information about known vulnerabilities in the devices detected.
In order to collect as much data as possible, the scanning was conducted in busy areas of the city, such as shopping malls, hotels, tourist areas, the central railway station, cafes and shops, as well as Warsaw airport.
It should be noted that the majority of Bluetooth devices (approximately 150) were detected in shopping malls and on the busy streets of Warsaw. As for the conference, out of the 500 – 600 people who attended, only 4 had their devices in ‘visible to all’ mode. Although this figure was encouraging, a vulnerable device was still detected, as one person out of the four had a device vulnerable to BlueSnarf. BlueSnarf is the most dangerous type of Bluetooth attack, and gives a remote malicious user full control over the victim device, allowing him/ her not only to harvest data saved on the phone, but also to send SMSs without the knowledge of the device’s owner, and to call any number, including premium numbers.
Among the most popular devices which we detected were mobile phones (56% of all devices detected). In second place were smartphones, with 14% of the total, and then smartphone devices such as hands free and other accessories (12%). We also detected a few laptops and even some workstations with Bluetooth enabled.
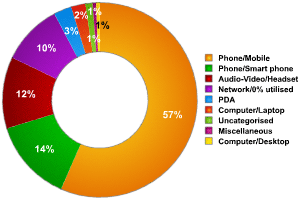
Fig. 6: Distribution of Bluetooth devices according to type
As far as Bluetooth equipment manufacturers go, there were no surprises here. Nokia was in the lead (19%) following by Motorola (10%). However, it should be borne in mind that 63% of the devices were either from poorly known manufacturers, or the manufacturer could not be identified. Consequently, the lion’s share of devices detected could actually belong to any manufacturer.
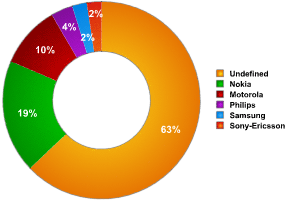
Fig. 7: Distribution of Bluetooth devices according to manufacturer
Looking at vulnerable Bluetooth devices, it should be noted that among all the devices detected, only one type of vulnerability was present: BlueSnarf. The presence of this vulnerability makes the risk of a network worm epidemic relatively high.
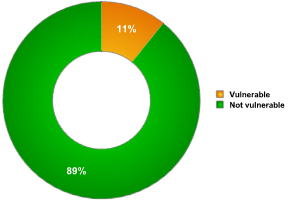
Fig. 8: Proportion of vulnerable Bluetooth devices
Conclusion
The condition of WiFi networks in Warsaw is consistent with those in the European Union as a whole. As far as encryption goes, Warsaw, with 58%, falls between other European cities: Paris (70%), Hanover (44%) and London (50%).
A unique feature of Warsaw WiFi networks is the use of URLs in the access point names. This may be a temporary phenomenon, but it was marked in Warsaw, in comparison to other cities where this trend was observed. This could become a method for spreading malicious programs – the user sees the web address in the list of accessible networks, chooses this network with his/ her browser, and then a malicious program will be downloaded to his/ her machine. At the moment, however, this approach is used purely for advertising.
From the same authors


In the same category


Wardriving in Warsaw