

Authors
We regularly conduct research into Wi-Fi networks and protocols in order to gain a picture of the current state of affairs and to highlight current security issues. We focus on Wi-Fi access points and mobile devices which support Bluetooth.
We’ve already published research material using data gathered in Peking and Tjianjin, CeBIT 2006 and InfoSecurity Europe, held in London.
This latest piece of research was conducted in Paris, partly in the city itself, and partly at InfoSecurity 2006, which was held in the French capital at the end of November 2006.
It was very interesting to compare the data collected with similar data from InfoSecurity which was held in London in spring of this year. It was also instructive to compare data on the security of Wi-Fi networks in the business districts of these two world capitals.
As part of this research, we also planned to collect data about Bluetooth enabled mobile devices at InfoSecurity itself, in the Paris Metro, and on the streets of the city. Until now, we haven’t managed to catch a single worm for mobiles devices (Cabir or Comwar) in a major city, but we were hopeful about our chances in France – after all, it was the birthplace of Cabir, the first mobile worm.
WiFi networks
We conducted our research between the 22nd and 25th of November 2006. We investigated La Defense, the business district of Paris, where InfoSecurity was being held, and other locations in Paris. We collected data on approximately 1000 access points. We did not attempt to intercept or decrypt any data transmitted via wireless networks.
We detected more than 400 Wi-Fi access points at La Defense/ InfoSecurity, and more than 500 in other regions of Paris.
This was the largest number of access points which we’ve ever detected. London, where we conducted similar research in April, comes in second place. However, we weren’t able to collect separate data for InfoSecurity, as the trade fair was being conducted within the Parisian business district itself.
Transmission speed
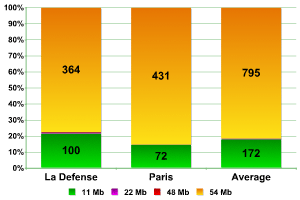
As the graphs show, the data which we collected in two different locations is practically identical. Networks which transmit data at a speed of 54MB are the most common, with the figure varying between 77% (La Defense) to more than 85% (Paris), giving an average of almost 82%. At CeBIT 2006 these networks comprised a little over half (51%) whereas the analogous figures for China and London were a mere 36% and 68% respectively.
This clearly indicates that there is far more networking equipment utilizing newer versions of 802.11 used in Paris than in London. It’s difficult to believe that this difference of more than 15% is caused simply by the rapid evolution of Parisian networks in the six months since we published our figures from London.
The second most common network speed is 11MB, with between 14% and 21% of all networks transmitting at this speed, and an average figure of 17.70%. More than 58% of all networks in China transmitted at this speed, with 47% at CeBIT and 28.5% in London.
The number of networks transmitting data at speeds between 22MB and 48MB did not exceed 1% in any area of Paris. This was significantly less than the number detected in China, Germany, and London, where they comprised up to 6% of the total).
We can therefore conclude that Wi-Fi networks are more evolved in Paris in comparison to networks in the other cities where we have conducted research. The most surprising is the significant difference between the Parisian data and the data from London, a city we had previously considered to be setting something of a benchmark.
Network equipment manufacturers
The data we collected on network equipment manufacturers in Paris differed significantly from data we collected in other locations. We have therefore decided to analyze each data set individually.
In total, equipment from 28 different manufacturers was detected.
At La Defense, equipment from 19 different manufacturers was detected. Five manufacturers were found to be the most widespread, and equipment from these sources was deployed in more than 12% of networks detected in the business region of Paris.
| manufacturers | percentage |
| Symbol | 2,99% |
| Trapeze | 2,99% |
| Airespace | 2,14% |
| Cisco | 2,14% |
| Aruba | 1,92% |
Equipment produced by the other 14 manufacturers was used in less than 8% of all networks. Unfortunately, it was impossible to establish the manufacturer in more than 80% of cases (Fake, unknown, user defined). This figure is far higher than that for CeBIT (66%) and London (61%).
Equipment from 21 manufacturers were detected in networks other regions of Paris. Of these, the equipment of 5 manufacturers was the most common, and used in more than 10% of the networks detected.
| manufacturers | percentage |
| Senao | 4,17% |
| Delta (Netgear) | 2,18% |
| Gemtek | 1,59% |
| USI (Proxim Orinoco) | 1,59% |
| US Robotics | 1,19% |
Equipment from the remaining 16 manufacturers was used in less than 6% of networks. In 83% of cases, the equipment manufactuer couldn’t be established (Fake, Unknown, User-defined), which is lower than the figures from other cities, and close to the figure for La Defense.
As the data shows, the equipment used in each location varies in terms of manufacturer. The figures for Symbol and Trapeze at La Defense, and the high amount of equipment produced by Senao in other locations are the most striking figures when the Paris data is compared to London, with Cisco having a clear advantage in London. Equipment from Cisco was detected in Paris, as was equipment produced by Aruba, which was the third most common type of equipment in London. Overall, it should be stressed that the market share of equipment manufacturers not only differs strongly from country to country, but also from region to region within a single city.
The aggregate data for the top five equipment manufacturers in the two locations is as follows:
| manufacturers | percentage |
| Senao | 2,26% |
| Trapeze | 1,44% |
| Symbol | 1,44% |
| Delta (Netgear) | 1,44% |
| Linksys (GST) | 1,34% |
In 82% of all cases, the equipment manufacturer could not be established.
Traffic encryption
Probably the most significant figure is the ratio of protected to unprotected access points. Older data collected by war drivers in cities around the world show that approximately 70% of all networks do not encrypt traffic in any way. In Peking, we obtained a figure of less than 60%, at CeBIT approximately 55%, and in London 50% of networks which did not use encryption.
Our research in Paris was designed to find out whether unencrypted networks were still more common than encrypted ones, and whether London was the only ‘digital fortress’.
First of all, let’s look at the data collected during InfoSecurity together with the data collected around La Defense:
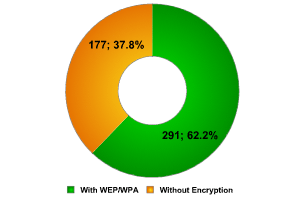
La Defense / InfoSecurity
Only 37% of networks did not use any type of encryption! This is a stunning figure, which is slightly better than the figure for London’s Canary Wharf. The two regions are very similar: a great many international banks, oil and insurance companies, news agencies etc. could be targeted by hackers on the hunt for information of commercial value.
This is the lowest figure that we have come across so far. If we take into account that fact that some of the access points which make up this 37% are public access points which are located at the La Defense shopping centers, it seems to reinforce our assumption that the high number of secure networks which we first encountered in London is general practice, and shows that system administrators are well aware of the issue.
Part of this data is naturally made up of access points at InfoSecurity. As we have previously mentioned, such access points are usually configured in a hurry, often incorrectly, and they can easily be targeted by hackers. The security of the networks detected at InfoSecurity London was worse than the security of networks in the rest of the city. It’s quite possible that this was also the case in Paris, as 37% was by far from the most surprising figure which we encountered.
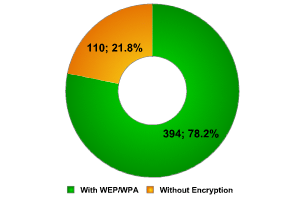
Other regions of Paris
The figures for other regions of Paris turned our preconceptions of secure wireless networks upside. A figure of 22% isn’t only almost twice as good as the data we collected in the ‘protected’ business district, but it’s the lowest percentage of unprotected networks that we’ve ever encountered in the course of our research. The general belief that approximately 70% of networks are unprotected was in part borne out by China (59%), Moscow (68%) and London (50%) but brought down by the data from Paris. And not just by data from the business district, where one would expect networks to be secure, but standard access points belonging to home users also implement encryption.
Undoubtedly, one of the reasons for these figures is that wireless networks in Paris are better developed than in other cities, as is shown by their use of newer protocols and the speed of data transmission. Just as in London, we should highlight the high level of computer literacy and awareness of Wi-Fi security issues among users. The data from Paris shows that the era of unprotected wireless networks is gradually drawing to a close.
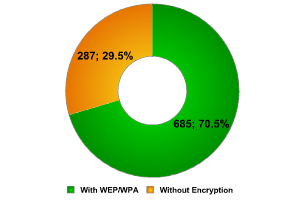
Combined data for Paris
While the data collected in other regions of London slightly detracted from the high figures collected at Canary Wharf, in Paris the opposite was true. The high figures were weakened by the public access points and the access points established by InfoSecurity participants, bringing the average number of unprotected networks down. In spite of this, however, we returned a figure of less than 30%!
Paris is therefore awarded our unofficial victor’s palm for the city with the best protected wireless networks, overtaking London (49%) and establishing a new qualitative benchmark. Paris is the city with the fastest and best protected Wi-Fi.
Types of network access
Wi-Fi networks are either made up of ESS/AP access points or via Peer/AdHoc computer-to-computer connections.
Data shows that approximately 90% of wireless networks are composed of ESS/AP access points. In China, the ratio of ESS/AP to Peer/AdHoc networks was 89% to 11%, at CeBIT 2006 58% to 42% and in London 95% to 5%.
We expected to find a high number of Peer networks at InfoSecurity Paris (in London, approximately 50% of the networks were of this type.) This is because they are constructed within the framework of an exhibition (a temporary space) and use multiple connections between computers without network cables. The high number of Peer networks found at La Defense might also be due to the fact that wireless devices, such as printers, for instance, are becoming more and more popular in offices.
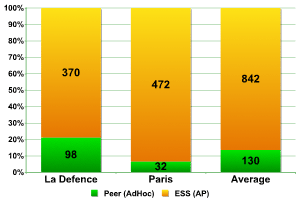
Types of Network Access
The data collected shows that more than 20% of access points both at the trade fair and in office buildings are of the Peer type, and such networks are used exclusively to connect devices to each other.
Figures from the other regions of Paris give a ratio of approximately 9 to 1. The results are closer to those from Peking than those from London.
Default configuration
Networks with default configuration are the juiciest morsel for hackers of wireless networks. As a rule, Default SSID means that the adminstrator of the access point has not changed the name of the router. This may also be an indirect indicator of the fact that the administrator account is still using the default password. The Internet is full of information about which default passwords are used by different types of network equipment, and if a hacker knows the origin of the equipment, s/he will be able to take complete control over such a network. More than 8% of the networks in Peking retained their default configuration, which is a worryingly high figure. The situation at CeBIT was better – only two access points out of more than 300 used default SSID. London gave us a figure of slightly higher than 3% in the city itself, and approximately 1.5% at Canary Wharf.
One of the best ways of protecting a network against war driving is to disable broadband spreading of the network identifier (SSID). Let’s take a look at the networks we detected from this point of view.
The figures from La Defense are far better in terms of Default SSID than the figures from Canary Wharf. Less than 0.5% is praiseworthy.
SSID was disabled in almost 33% of networks, almost the same as the figure for London, with the French having a slight edge.
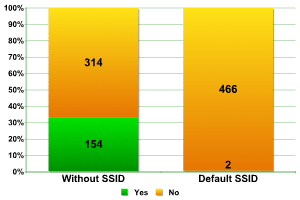
SSID Broadcast — La DЁЁfense
Taking into account the fact that we already know that wireless networks are highly evolved in Paris, the figures from other regions of the city were not surprising.
Default SSID was detected in 1.39% of networks, which was slightly lower than the figures from La Defense (to be expected) but still better than the 3.68% detected in London. The only area in which the English led the French was in terms of disabled SSID broadcast. In Paris, this was found in less than 26% of networks, in comparison to London’s 32%.
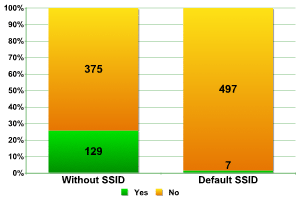
SSID Broadcast — Other regions of Paris
Network components
This section includes statistics on the number of network access points in individual networks. Of course, a network has one or more access points but how many access points is common?
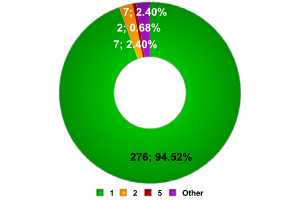
Around La Defense and at InfoSecurity 207 networks were detected. These networks contained more than 400 access points.
La DЁЁfense
As the data shows, the vast majority of networks (more than 84%) only have one access point. Just as in London, networks with 4 access points were fewer in number than those made up of 2, 3, or 10 access points.
On the other hand, there were some very large networks found, including two which had 10 and 11 access points respectively. However, there were no networks composed of 7 access points. Many access points could not be included in this data as SSID Broadcast has been disabled in the networks which they were a part of (more than 150 access points).
The 84% of networks composed of a single access point is a figure very similar to the 82% from Canary Wharf. We were interested to see if the data for London overall (51% of networks composed of a single access point) was comparable to the data for Paris overall.
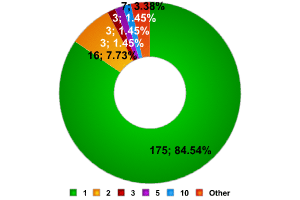
Other regions of Paris
And this is where we were surprised. Nearly 95% of the 292 networks (made up of more than 500 access points) had only a single access point. Was this due to home users, or to connections from small business? Whatever the reason, it was all the more surprising in light of the high level of encryption used in these networks, which we mentioned earlier.
As for record breaking numbers, we found three networks with 14, 16 and 18 access points respectively. These were undoubtedly public access neworks. Overall, 292 networks were found, not including the more than 100 access points where SSID was disabled.
Conclusions
The data gained from our Paris wardriving leads us to draw the following conclusions:
- The vast majority of networks transmit data at a speed of 54MB a second
- There is an unprecedentedly high use of encryption in Parisian networks in comparison with networks in other cities around the world
- Much of the data from the business regions of Paris coincides with data collected from similar regions of London
- The majority of networks only have one access point, which results from the widespread use of wireless networks among home users
Wireless devices such as printers, scanners, etc are becoming more and more widespread, making it easier to create office networks. This is clearly shown by the gradually increasing number of Peer networks.
Finally, it’s not possible to identifiy a clear leader among the manufacturers of Wi-Fi equipment. Every country has its own preferences.
Overall, it should be stressed that our research over the past two years shows that the number of networks which use some time of encryption (WEP or WAP) is steadily increasing. In fact, one could say that the situation had changed radically over the past two years – from 70% of networks in Moscow and 60% in Peking to 30% in Paris. This is surely not due to socio-economic factors. It’s a clear global trend, which shows that both users and system administrators have recognized security on open networks as being a serious issue. The life of wardrivers is going to become more difficult as it becomes more difficult to hack networks in order to steal data or simply to gain access to the Internet.
Bluetooth
The most widespread method of transmitting data by WiFi is currently the Bluetooth protocol. Almost all modern mobile phones have a wireless module which enables the exchange of data with similar devices, also making it possible to use the ‘hands free’ function. Bluetooth is an integral part of smartphones, PDAs and some laptops.
In the spring of 2006 at InfoSecurity in London we conducted our first research into Bluetooth. We detected more than 2000 Bluetooth enabled devices in “visible to all” mode. The results of the research were published on viruslist.com in June 2006.
We decided to conduct similar research in Paris in order to gain comparative data which might support our conclusions. This report includes the data we gathered, and compares it to the data from London. We detected more than 1300 Bluetooth enabled devices in “visible to all” mode; although this is fewer than the 2000+ detected in London, we believe that this data is nonetheless representative.
We used Blue Soleil, Blue Auditor and BT Scanner to collect data.
The research was conducted both within the InfoSecurity Paris exhibition hall, and around La Defense, the business district of Paris. Although fewer Bluetooth devices were detected than at InfoSecurity London, nevertheless, at least 30 – 40 devices could be detected at any one time within a 100 metre radius.
We also collected Bluetooth data while collecting data about WiFi networks in other regions of Paris. The areas investigated included the Paris Metro, the Gare du Nord (a major railway station), and areas with a high concentration of tourists.
Types of device
Let’s take a look at what Bluetooth devices we detected:
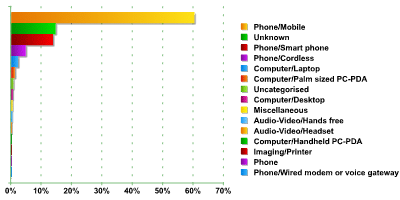
The graph clearly shows that the vast majority of devices are normal mobile phones. They make up approximately 60% of the total, which is 10% less than the figure for London. This is a fairly significant difference. This might be due to the fact that approximately 14% of the devices couldn’t be identified correctly, which could account for the difference. Standard mobile phones do not have a fully functional operating system, and they are only theoretically vulnerable to viruses, e.g. malicious programs written in Java for Mobile. However, all of these telephones are vulnerable due to Bluetooth protocol issues which we’ve written about before.
The second most popular type of device (if we exclude Unknown devices) is smartphones. They make up approximately 14% of all devices detected, which is significantly less than the 25% found in London. This is surprising, as France definitely is among the countries with the most smartphones in the world, and is one of the most developed markets for such devices. However, the statistics speak for themselves.
In third place, with almost 5% were standard cordless phones of the type often used in offices. This figure is higher than that for London, and laptops with Bluetooth were in third place in London, making up approximately 3% of all devices found. The figures for Paris are of a similar level – more than 2%. We should stress that although this isn’t a high number, the risk of hacker attacks on such devices is greater than the risk of attacks on a standard handset or smartphone. This is because the data saved on a laptop is far more extensive and attractive to hackers than data stored on a telephone.
In terms of other devices, the number of PDAs (Palm sized PC PDA and Handheld PC PDA) detected was less than 2%. This is identical to the figure from the UK, which we see as confirmation of the fact that users of such devices are very aware of Bluetooth security issues and take the appropriate precautions.
All in all, we detected more than 1300 devices of 15 different types. The number of Uncategorised and Miscellaneous devices was less than 1.5%, although we still classified this as a type of device. The single blot on our statistics was the 14% of Unknown devices.
Equipment manufacturers
This figure is very significant: we can use data about equipment manufacturers to establish what operating system is being used (in the case of smartphones/ PDAs) or get data about an individual manufacturer’s market share.
Overall, we detected equipment from 39 different manufacturers (in contrast to the 35 which we detected in London.) 6 manufacturers appeared to be the most popular, with their devices making up more than 38% of all devices detected.
Unfortunately, in approximately 50% of cases, we were unable to establish the equipment manufacturer. This is a surprising figure, as in London the percentage of such devices was only slightly over 25%. Could it somehow be connected with grey market telephones?
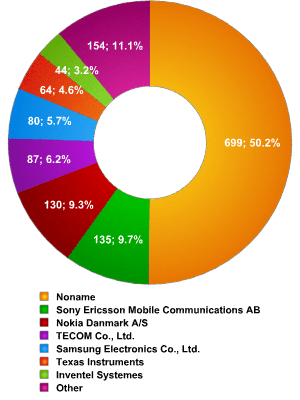
Equipment manufacturers – Paris
| manufacturers | percentage |
| Noname | 50,18% |
| Sony Ericsson Mobile Communications AB | 9,69% |
| Nokia Danmark A/S | 9,33% |
| TECOM Co., Ltd. | 6,25% |
| Samsung Electronics Co., Ltd. | 5,74% |
| Texas Instruments | 4,59% |
| Inventel Systemes | 3,16% |
| Other | 11,06% |
The data above shows that in Paris there is no clear market leader among equipment manufacturers; this is in contrast to London, where Nokia manufactured more than 30% of devices detected. In Paris, Sony Ericsson is in first place with 9.69% of the devices detected, but Nokia is not far behind. However, the figures from London were very different, as these two companies had almost half of the entire market share. The figure for Samsung, on the other hand, is very similar in both cities: 5.74% in Paris and 4.52% in London. Texas Instruments is in a similar position, perhaps explained by the limited prevalence of Motorola telephones.
Interestingly, well known manufacturers such as USI and Murata aren’t among the list of leaders, having been squeezed out by Tecom and Inventel. However, they do come just below the top six most popular manufacturers, together with LG and Sharp.
As we’ve mentioned in the past what type of equipment different manufacturers produce, the following data may be of comparative interest:
| Nokia | |
| Phone/Smart phone | 30% |
| Phone/Mobile | 70% |
| Sony Ericsson | |
| Phone/Smart phone | 12,5% |
| Phone/Mobile | 87,5% |
| Samsung | |
| Phone/Mobile | 56,8% |
| Phone/Cordless | 40,7% |
| Other | 2,5% |
| Texas Instruments | |
| Phone/Smart phone | 45,31% |
| Phone/Mobile | 35,94% |
| Computer/Handheld PC-PDA/ Palm sized PC-PDA | 18,75% |
Accessible services
The data on accessible services is of great interest to us as it illustrates the opportunities both for hackers to attack handsets and for viruses to spread. When a device establishes a Bluetooth connection with another device, it makes it possible for the second device to use some of its services. For example, if you’ve allowed a friend’s device to connect to yours in order to exchange data, you are also making it possible for your friend’s device to make calls from your phone, send SMSs, read your address book etc. And of course, it could be a hacker in place of your friend, a hacker who has used social engineering or a Bluetooth vulnerability to gain access to your device.
The data we collected on accessible services gives us a picture of what services could be accessed by remote malicious users.
Let’s start by taking a look at the data for all services. We detected approximately 3800 services on over 1300 devices, distributed in the following way:
Given the ratio of 3800 to approximately 1300, this means that each device had, on average, around 3 accessible services. Some devices had 5 or 6 accessible services.
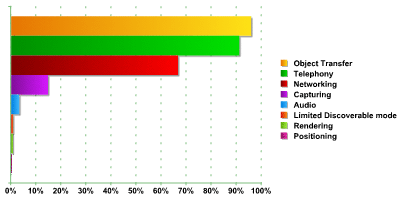
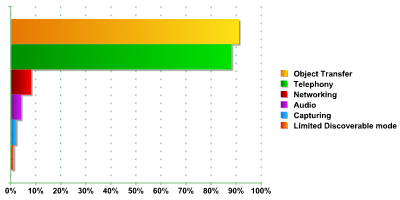
As the graph shows, three services were the most common:
- Object Transfer (sending/ receiving files). This is used in more than 95% of devices.
- Telephony (making calls, sending messages). This is used in more than 91% of devices.
- Networking (provides Internet access and the ability to use an inbuilt modem). This is used in more than 66% of devices.
These figures are practically identical to the data we collected in London, with the difference in all three cases being less than 1.5%.
As we are primarily interested in smartphones, which are among the most vulnerable Bluetooth devices, it’s worth taking a look at the data relating to them separately.
As the graph below shows, the ratio of devices: services is approximately 1: 2.
There’s a slight difference between the figures for smartphones and the data for other devices.
With more than 93%, Object Transfer remains the most widespread accessible service, followed by Telephony with 91%, and Networking in third place, with the low figure of slightly more than 10%.
The data from our research supports our previous conclusions: although some users of Bluetooth devices are aware of the risks posed by cyber threats, user education is still needed. The manufacturers of mobile phones and smartphones would also do well to examine the issue of Bluetooth security and the implementation of services which can be accessed via Blue
From the same authors


In the same category


Wardriving in Paris