

Authors
Introduction
The Internet is changing, from being a network of computers to a network of the most varied devices possible. And the world itself is becoming increasingly mobile, with an enormous range of communication devices available. This is a relatively new phenomenon and, like all innovations, it’s of interest both to hackers and to information security companies. The situation is complicated by the fact that, like everything new, wireless networks and protocols still haven’t got over their teething troubles: in the hands of inexperienced users, they can pose a serious risk.
As readers of analysis published on viruslist.com will have noticed, Kaspersky Lab has been researching the various security issues relating to wireless networks and wireless protocols.The aim of such research, with a focus on WiFi access points and mobile devices which support Bluetooth is twofold: to gain a up to date picture of the changing wireless environment, and to focus users’ attention on wireless security problems.
We’ve already published reports on wireless networks in Peking and Tianjin, wireless networks detected at CeBIT 2006 in Germany, and reports on malware for mobile devices and the problems of Bluetooth protocol.
Our latest research was conducted in London, partially at InfoSecurity 2006. In a notorious case last year, scammers installed several false access points, with an interface which appeared to provide access to the public network. Unsuspecting users who connected via such access points entered their passwords and other confidential data which were then sent directly to the scammers.
Apart from WiFi networks at InfoSecurity, we also investigated the security of WiFi networks in business districts of London. Additionally, we collected data about Bluetooth enabled devices at the exhibition, in the London underground, and while walking around London. According to information from F-Secure, mobile malware has been detected in the UK, and we thought we might be able to catch a sample of Cabir or Comwar in the wild. You can read more about this in our Bluetooth report, coming soon on viruslist.com.
WiFi
This research was conducted between 25th and 28th April 2006, at the Great Hall, Olympia Exhibition Centre (InfoSecurity 2006), at Canary Wharf, where many international companies are located, and in a range of other areas of London. We collected data on more than 600 access points. We did not at any stage attempt to intercept or decrypt wireless network traffic.
The WiFi networks we detected were distributed as follows:
- InfoSecurity – 200+
- Canary Wharf – 260+
- Other areas of London – approx. 150
Data transmission speed
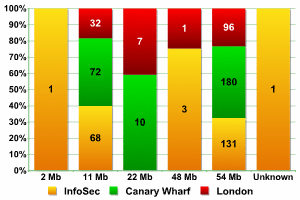
Transmission speed (by location)
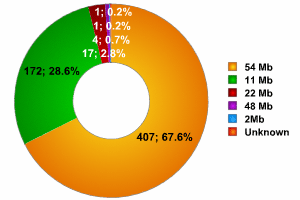
Transmission speed (overall figures)
As the graphs show, the data collected from three different locations are fairly similar. Networks with a transmission speed of 54MB were the most common, with the percentage ranging from 64% of all networks detected at InfoSecurity to more than 70% (other areas of London), giving an average of 67.6%. In comparison, only 51% of networks at CeBit and 36% of networks detected in China transmitted data at this speed. Clearly, the UK uses far more equipment which utilizes newer versions of 802.11.
Second most popular were networks with a transmission speed of 11MB. The percentage of such networks varied from 23% to 33% of all networks, with a mean of 28.6%. In China, more than 58% of all networks transmitted at this speed, whereas at CeBIT the figure was 47%.
The number of networks with a transmission speed between 22 and 48MB didn’t exceed 4%, which coincides with the figures from China and Germany.
Overall, the data clearly indicates that wireless networks in London are more technologically evolved than those in the other areas we had previously investigated.
Equipment manufacturers
Statistics for equipment manufacturers differ significantly from location to location, and for this reason, we will examine the data for each location separately.
In total, equipment from 33 manufacturers was detected.
At InfoSecurity, 18 different manufacturers were detected. Four manufacturers were the most popular, with their equipment being used in more than 25% of networks at the exhibition.
| Manufacturer | Percentage |
| Aruba | 16.18% |
| Intel | 5.39% |
| NetGear | 1.96% |
| Cisco | 1.96% |
Equipment produced by the remaining 14 manufacturers was used in less than 10% of the networks. More than 64% of the networks used equipment which registered as Fake, Unknown, or User Defined. This figure is very close to CeBIT (66%) and is significantly higher than the 39% detected in China.
At Canary Wharf, equipment from 16 manufacturers was detected; out of these, five manufacturers were the most popular, with their equipment being used in 24% of the networks detected.
| Manufacturer | Percentage |
| Cisco | 11.07% |
| CyberTAN | 4.20% |
| 2Wire | 3.05% |
| NetGear | 3.05% |
| Symbol | 2.67% |
Equipment from the other 11 manufacturers was used in less than 10% of the networks detected. 66% of networks used equipment which registered as Fake, Unknown, or User-Defined, mirroring the figures for the InfoSecurity networks.
Data from other areas of London showed the most variation in terms of equipment used relative to the small number of WiFi points. Overall, equipment from 21 manufacturers was detected, with 3 manufacturers representing more than 30% of the networks detected.
| Manufacturer | Percentage |
| CyberTAN | 18.38% |
| Cisco | 7.35% |
| 2Wire | 4.41% |
Equipment from the other 18 manufacturers was used in 22% of the networks detected. Fake, Unknown, or User Defined equipment was used in less than 48% of the networks.
As this data shows, the popularity of equipment manufacturers differs substantially from location to location. The leading position of Aruba at InfoSec and the significant amount of CyberTAN equipment in other locations is the most notable way in which the English statistics differ from the Chinese and German data. These manufacturers were not identified as having a presence in the latter countries.
Overall figures for equipment from the five leading manufacturers in all three locations are as follows:
| Manufacturer | Percentage |
| Cisco | 7.14% |
| CyberTAN | 5.98% |
| Aruba | 5.48% |
| Netgear | 2.49% |
| 2Wire | 2.33% |
The overall figure for Undefined, Fake, or User Defined equipment in all London locations was 61.46%.
Encryption
Probably the most interesting fact about the WiFi networks detected was the ratio of protected to unprotected access points. Data collected by war-drivers around the world indicates that the number of access points with no encryption is approximately 70%. In Peking, the figure was less than 60%, and 55% of networks at CeBIT were unencrypted. We hoped that our research in London would confirm whether or not the figure of 70% is accurate, and whether or not the ratio of protected to unprotected networks at major IT exhibitions was consistent.
To start with, let’s take a look at data from the networks detected:
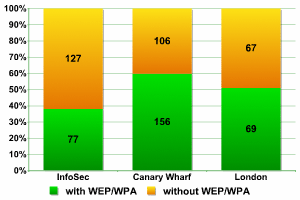
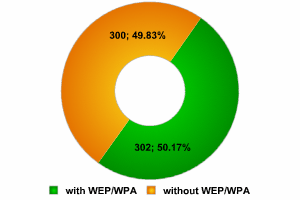
Encryption (overall figures)
InfoSec
62% of networks at InfoSec were operating without encryption, and this is an unacceptably high percentage. The majority of these access points provide access to the equipment of IT exhibitors, a major target for hackers. This figure for InfoSec is even higher than the number of such networks detected at CeBIT, and InfoSec is a dedicated security event with exhibitors who specialize in information security. We expected that there would be a more serious attitude towards security from such companies with their own WiFi access points.
Canary Wharf
I have to acknowledge that after seeing such figures from InfoSec, I was doubly interested to research the situation at Canary Wharf. This business district is on the northern end of the Isle of Dogs, which is located in the East End of London. It’s made up of a multitude of skyscrapers, one of which, Canada House, is at 238 metres the tallest building in the UK. A large number of multi-national banks, such as HSBC, Citibank etc. have their headquarters here, as do insurance companies and news agencies. Such organizations that might well be targeted by hackers and fall victim to the theft of confidential and proprietary information. It was clear that such organizations would have WiFi access points, and it only remained to be seen how well protected these points were.
The data collected at Canary Wharf was surprisingly encouraging.
Only 40% of networks used no encryption. This is the lowest figure ever in the course of our research into WiFi. If we take into account that some of the networks which make up this 40% are public access points in shopping centres located at Canary Wharf, then the overall level of protection in this region of London is ground breaking. It’s clear that companies are concerned about security issues and that they recognize the potential problems caused by using WiFi within their network infrastructure. It should also be noted that nearly every inch of Canary Wharf’s streets and squares are under the eye of security cameras – a war driver could easily attract the attention of security guards, and the periodic wailing of police sirens would add a few grey hairs to any hacker’s head.
However, even here there are unprotected networks; standing 20 metres from the building of a well known bank, I detected a very strong signal emanating from a WiFi point within the building.
Unfortunately we didn’t have time to conduct similar research in the old business district of London, the City. However, we will do this in the future. It would be good to establish whether or not the levels of protection at Canary Wharf are a unique local phenomenon, or whether this is standard practice in London business districts.
The widespread use of WEP/ WPA at Canary Wharf wasn’t the only surprise that London held for us. 62% of networks unprotected at CeBIT, 40% of networks unprotected in business districts. What about the figures for other areas of London? The results were no less interesting.
Other areas of London
Only 49% of networks in other areas of London have no encryption! This figure is significantly lower than the ‘worldwide figure’ of 70%, lower than the Moscow average of 68 – 69%, and lower than the Chinese figure of 59%. It may be that this is due to the more highly developed nature of wireless networks in London – as a rule they use newer protocols and higher transmission speeds. Without a doubt, English users are more computer literate, and better informed about the problems of WiFi security than users in other countries a very pleasing fact.
However, the downside is that once again, just as at CeBIT 2006, the largest number of unprotected networks was detected at InfoSec. As we’ve mentioned before, such access points are often installed with lower security and in a short period of time, but they will be the subject of increased attention by hackers visiting such exhibitions in order to steal information.
Even the terrible figures from InfoSec couldn’t spoil the overall figures for London, with just over 50% of networks using WEP/WPA.
This means that London wins our unofficial prize for the best protected WiFi networks, moving ahead of Moscow and Peking and creating a new benchmark for encryption standards.
Types of network access
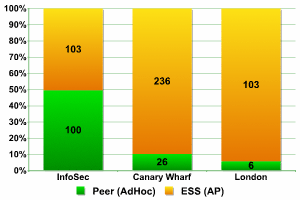
WiFi networks are either organized as ESS/AP access points, or with Peer/AdHoc connections.
Data shows that over 90% of WiFi networks throughout the world use ESS/AP connections. In China the ratio of ESS/AP to Peer/AdHoc was 89 to 11, and at CeBIT 2006 it was 58 to 42. The high percentage (42%) of Peer/AdHoc networks at exhibitions is explained by the fact that such networks need to connect a range of computers and other devices without network cables.
Network access
The data shows that the number of ESS/AP networks and Peer/AdHoc connections was more or less equal at InfoSecurity (as was this case at CeBIT.), and that these networks are used only to connect between devices. Statistics from Canary Wharf give a result of 236 to 26. The data gathered in other areas of London gives 103 networks using ESS/AP, and a mere 6 using Peer/AdHoc.
Default configuration
Networks with default configuration are a prime target for hackers. If the network is designated as having default SSID, this means, as a rule, that the access point administrator did not change the router name. This may also be an indirect indicator of the fact that the administrator’s account still uses the default password. The Internet is full of information about how default passwords are used in specific pieces of networking equipment, and if an attacker has information about the manufacturer, s/he may be able to use such information to gain complete control of a network. In Peking, such networks comprised more than 8% of all networks detected, a very high percentage. At CeBIT 2006 the situation was better – only 2 network access points out of 300 had default SSID.
One of the best ways to protect against war-driving is to disable SSID. Bearing this in mind, let’s take a look at the data collected.
Overall figures
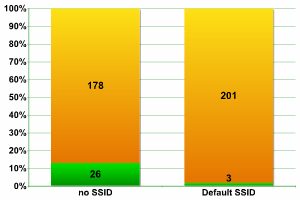
InfoSecurity 2006
The data from InfoSecurity London didn’t differ significantly from data from other trade fairs. Only three access points with Default SSID were detected i.e. less than 1.5% of the overall total.
SSID Broadcast was disabled in almost 13% of networks; this is significantly better than the 8% of networks detected at CeBIT.
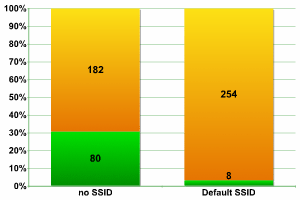
Canary Wharf
It’s interesting that even in “secure” Canary Wharf we did detect networks which had default configuration. There were not as many as in Peking, but more than we detected at the “insecure” InfoSecurity – over 3%. However, Canary Wharf administrators appear to be more active than anyone else in disabling SSID, giving a record total of 30% of networks.
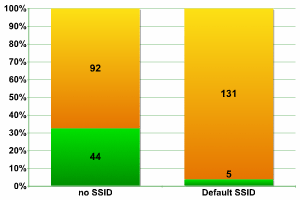
Other areas of London
Taking what we know about the development of WiFi networks in London, the figures for other areas of London provided no surprises. In spite of the fact that default SSID was detected in 3.68% of networks (higher than at Canary Wharf, which is only to be expected), this figure is far lower than the Chinese figure of 8%. Even the frequent enabling of SSID Broadcast, in more than 32% of networks, fits into the picture we have already created of London WiFi.
Network components
Our previous research has not included data on network components, but we thought it would be an interesting area to investigate. This section includes information on how many access points the networks we detected have. Naturally, a network can include one or more access points – we set out to determine how many access points different networks had.
During InfoSecurity, we detected 84 separate networks, and more than 200 access points.
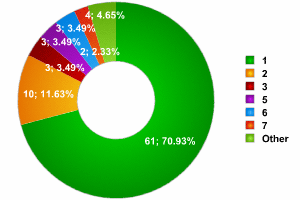
InfoSecurity 2006
As the graph above shows, the vast majority (over 70%) of networks consisted of a single access point. It’s not clear why there were so few networks with 4 access points – so few, indeed, that they do not figure on the graph, and far fewer than networks with 2 – 3 access points, or even 7.
As a contrast, we detected two enormous networks which had 13 and 14 access points respectively. However, we did not detect any networks with between 9 – 12 access points. There are also a number of access points which are not included in our statistics, as SSID Broadcast was disabled, and it was therefore impossible to determine which network they were part of.
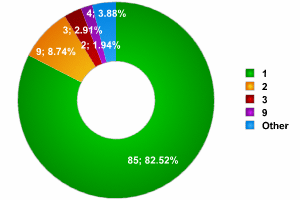
Canary Wharf
At Canary Wharf, over 82% of networks had a single access point. There were approximately the same number of networks made up of 2 – 3 access points as at InfoSec, and, quite unexpectedly, a network of 9 access points was in fourth place. As far as records go, 2 networks, with 18 and 22 access points respectively, were detected. Overall, a total of 104 networks were detected, disregarding the access points where SSID was disabled and the network could not be determined.
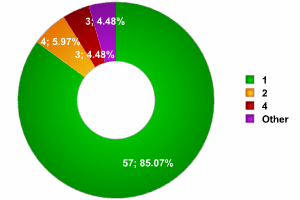
Other areas of London
As the graph shows, the data for other areas of London indicates that the number of networks with a single access point is similar to the figures at InfoSecurity; the number of networks with 2 access points was much lower, although it exceeded the number of networks with 4 access points. There were no record breaking networks, and the maximum number of access points found in any network was six. Overall, 67 networks were detected, not taking into account the access points were the network SSID could not be detected.
Conclusion
To summarize the results of our London war-driving :
- majority of networks transmitting data at 54MB
- lower level of security (standard) at the trade fair; an equal number of AP and Peer networks.
- significantly high use of encryption in networks in the city in comparison with other cities
“Internet access should be free and universally available,” Maybe there are system administrators still subscribe to this noble point of view. However, I think that the situation we witnessed at InfoSecurity, where visitors and security company employees were able to observe a certain access point named ‘default’ for three days – this is almost certainly due to poor security awareness, and not altruism.
From the same authors


In the same category


War-driving in England