

Authors
Figures
|
Indicator |
H1 2020 |
H2 2020 |
2020 |
| Global percentage of attacked ICS computers | 32.6% | 33.42% | 38.55% |
|
Percentage of attacked ICS computers by region |
|||
| Northern Europe | 10.1% | 11.5% | 12.3% |
| Western Europe | 15.1% | 14.8% | 17.6% |
| Australia | 16.3% | 17.0% | 18.9% |
| United States and Canada | 17.2% | 16.5% | 19.6% |
| Eastern Europe | 26.4% | 28.0% | 30.5% |
| Southern Europe | 27.6% | 29.6% | 33.1% |
| Latin America | 33.6% | 34.3% | 38.8% |
| Russia | 32.2% | 34.6% | 39.5% |
| Middle East | 34.0% | 34.6% | 40.2% |
| South Asia | 38.8% | 41.3% | 47.0% |
| East Asia | 42.9% | 41.8% | 46.3% |
| Central Asia | 43.7% | 43.9% | 48.8% |
| Africa | 45.6% | 46.4% | 51.2% |
| Southeast Asia | 49.8% | 47.5% | 53.9% |
|
Main threat sources globally |
|||
| Internet | 16.7% | 16.7% | 20.5% |
| Removable media | 5.8% | 5.4% | 7.0% |
| Email clients | 3.4% | 4.1% | 4.4% |
Traits
- There is no longer a downward trend in the percentage of ICS computers on which malicious objects were blocked.
Starting with the second half (H2) of 2019, we observed a decline in the percentages of ICS computers on which malicious objects were blocked. This was observed in industrial control systems (ICS) as well as in corporate and personal computing environments. This downward trend was not observed in the second half of 2020.- Globally, the percentage of attacked ICS computers in the second half of the year was 33.4%, which was 0.85 percentage points (p.p.) higher than the first half (H1) of the year.

Percentage of ICS computers on which malicious objects were blocked, by half-year, 2017 – 2020 (download)
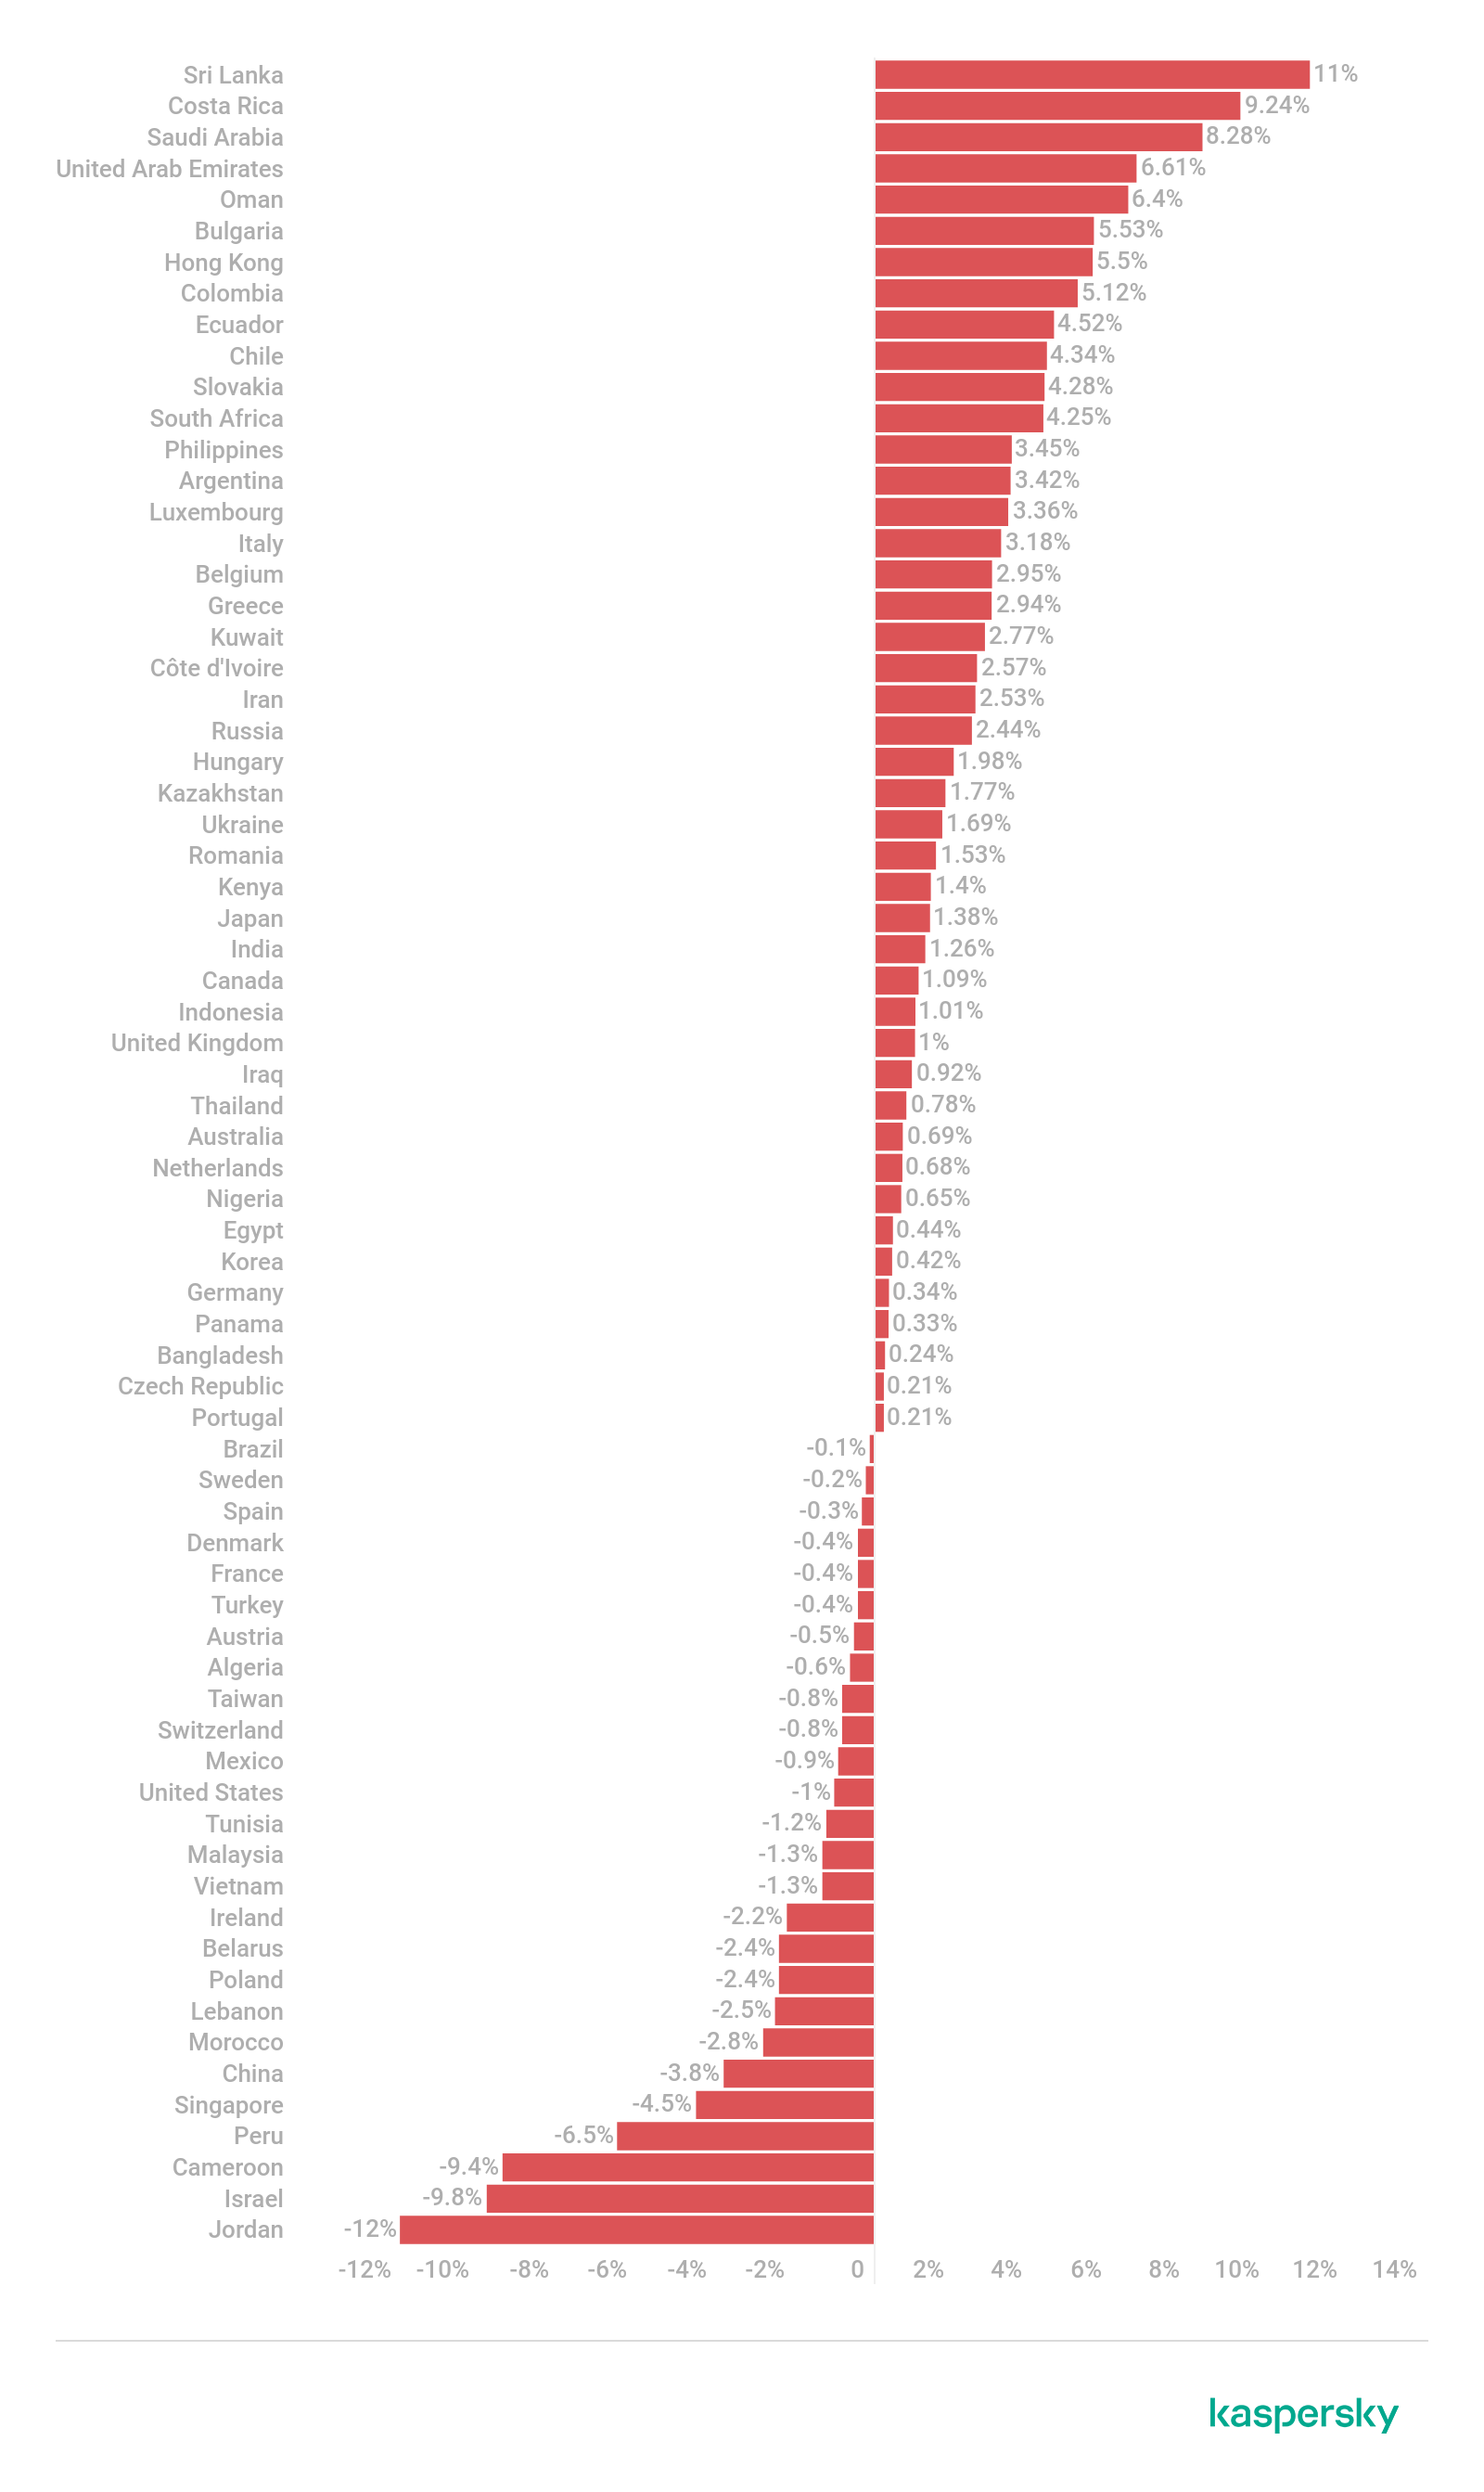
- The percentage of attacked ICS computers increased in 62% of countries.
In H2 2020, the percentage of ICS computers on which malicious objects were blocked increased in relation to H1 in 62% of countries. In comparison, this trend was observed in 7% of countries in 2019, and the same was seen in H1 2020 compared to H2 2019.Change in the percentage of attacked computers in countries of the world (p.p.) in H2 compared to H1, 2019 vs 2020 (download 1, 2)
The maximum growth of this indicator in a country was 8.2 p.p. (in Saudi Arabia), while most countries observed no more than a 4 p.p. increase. Therefore, the global average change over the half-year was insignificant.
- Globally, the percentage of attacked ICS computers in the second half of the year was 33.4%, which was 0.85 percentage points (p.p.) higher than the first half (H1) of the year.
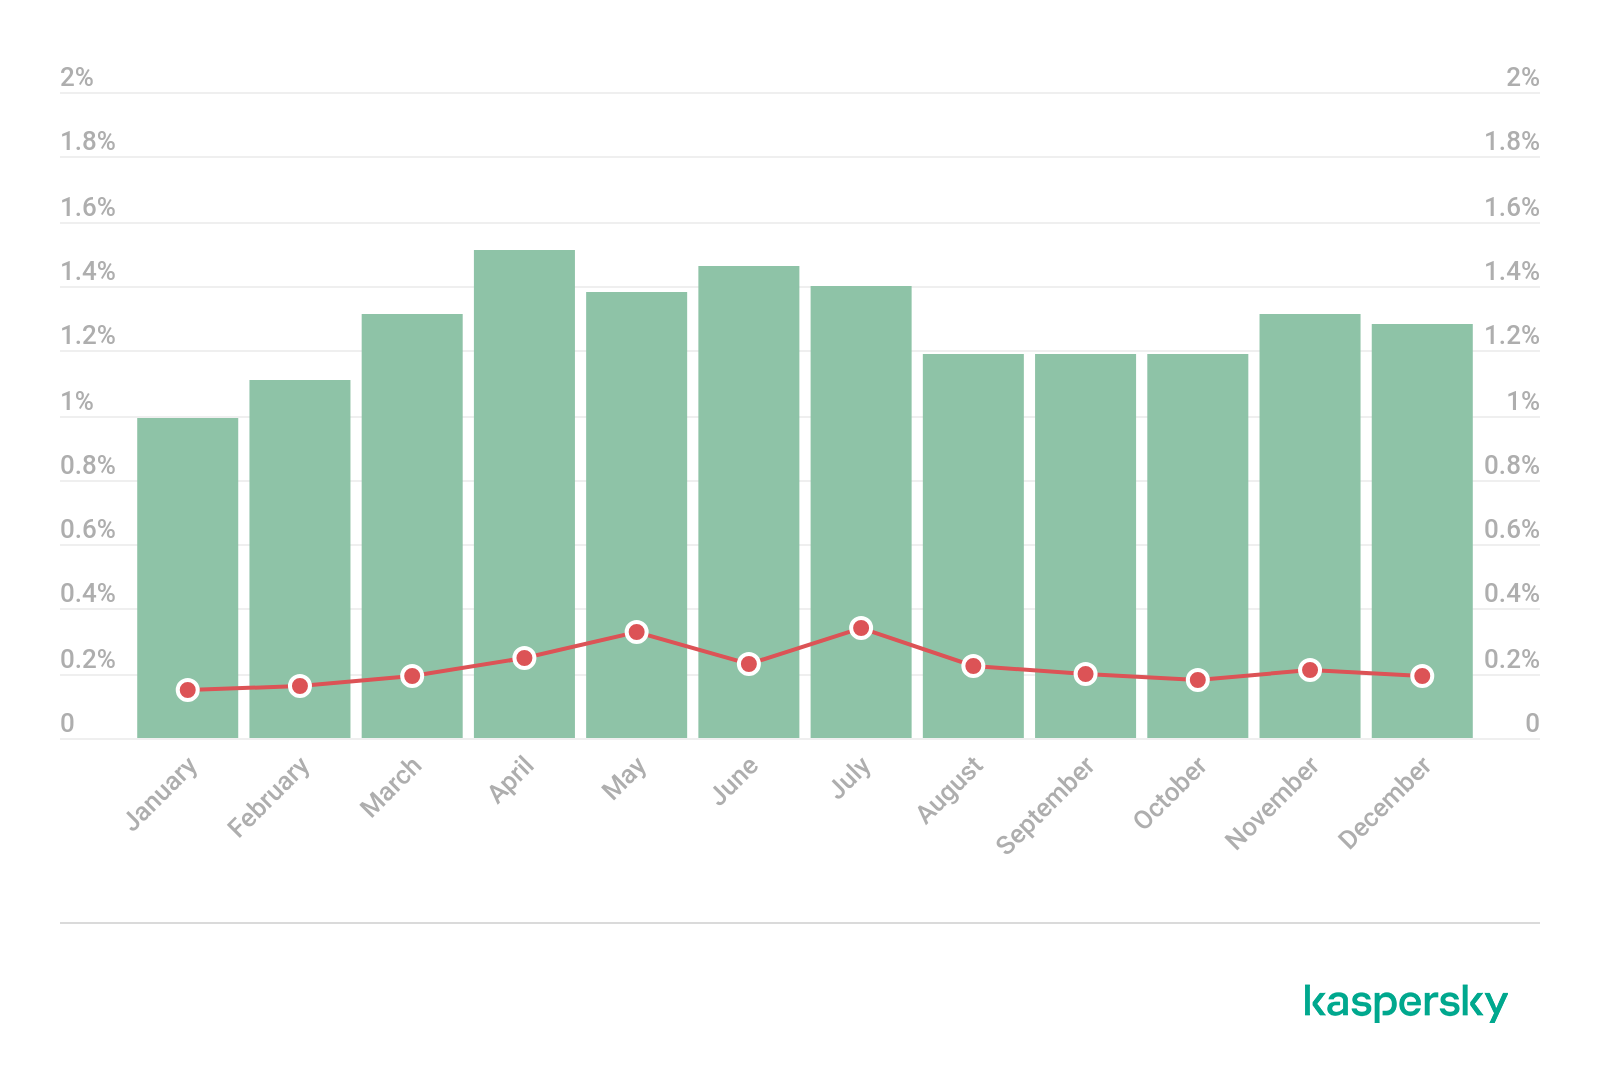
- The seasonal fluctuations typical of past years were not observed this year
In previous years, the percentage of ICS computers on which malicious objects were blocked was at its maximum in March/April and October, while this indicator sagged between those months.In 2020, this indicator behaved differently. It reached its maximum in February and dropped almost to its minimum in May. In the first two months of summer, it grew to its near-maximum in July. In October, the percentage of attacked ICS computers was one of the lowest.
Percentage of ICS computers on which malicious objects were blocked, by month, 2018 – 2020 (download)
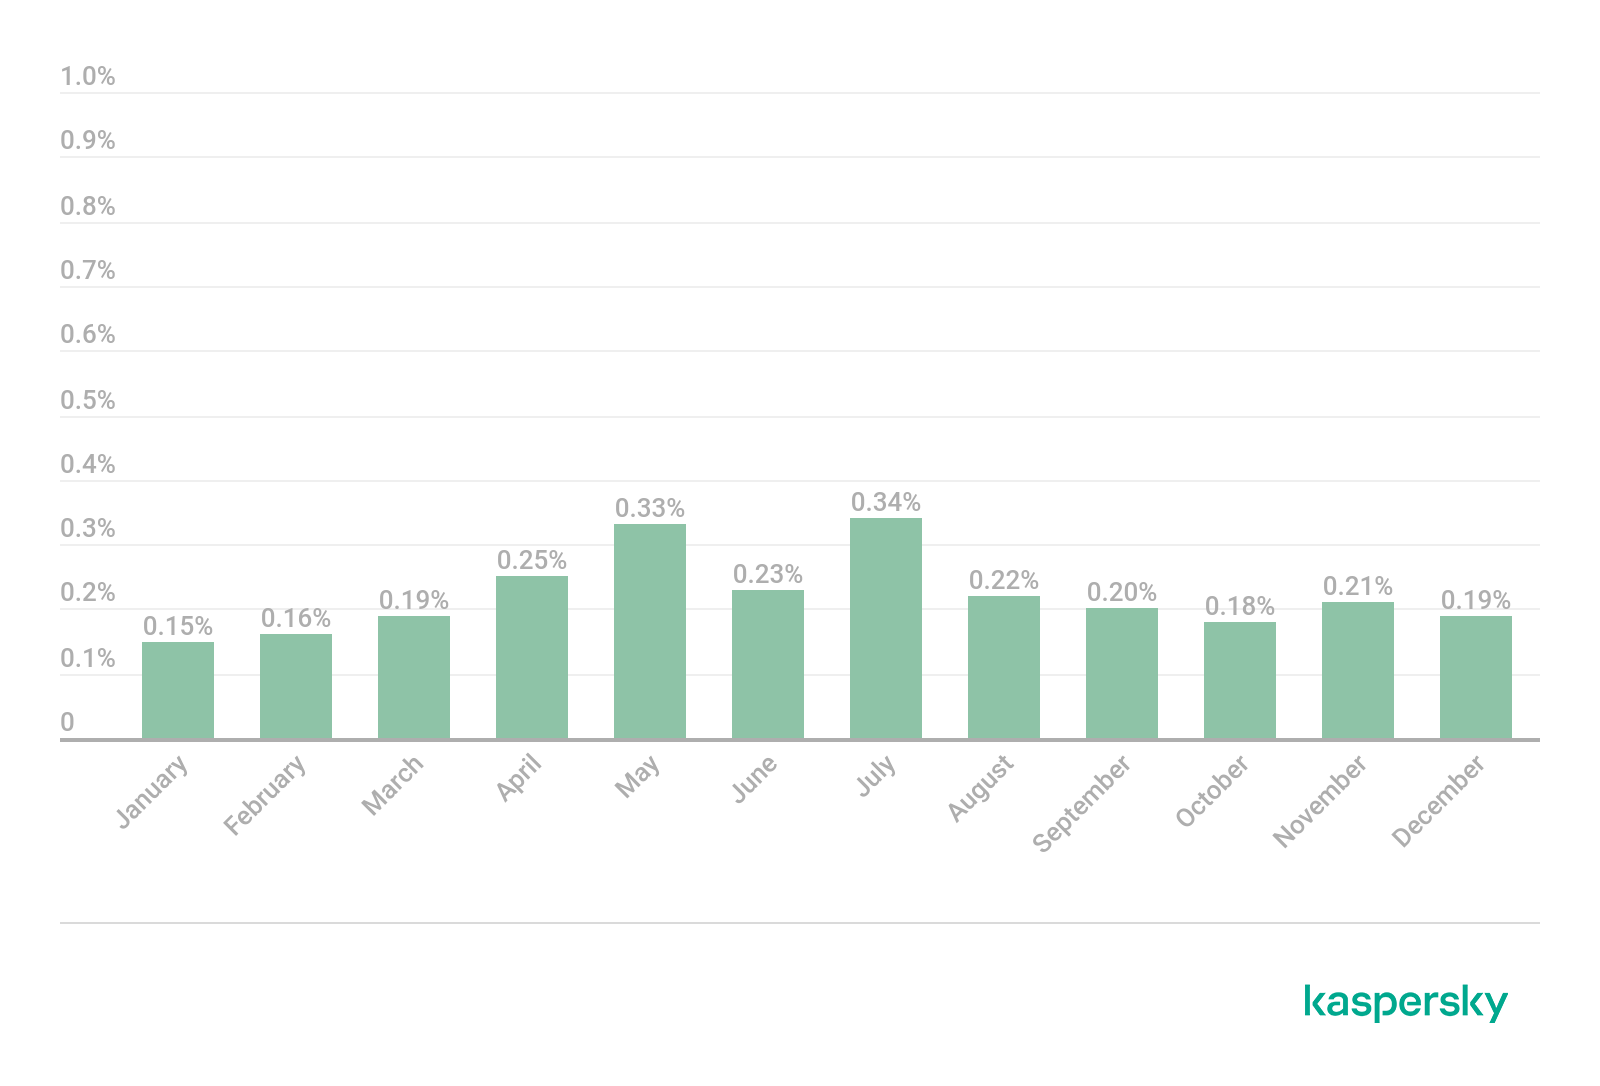
- The percentage of ICS computers on which malicious email attachments were blocked increased
- Globally, in H2 2020, the percentage of ICS computers on which malicious email attachments were blocked increased by 0.7 p.p. compared to H1.

Percentage of ICS computers on which malicious email attachments were blocked (download)
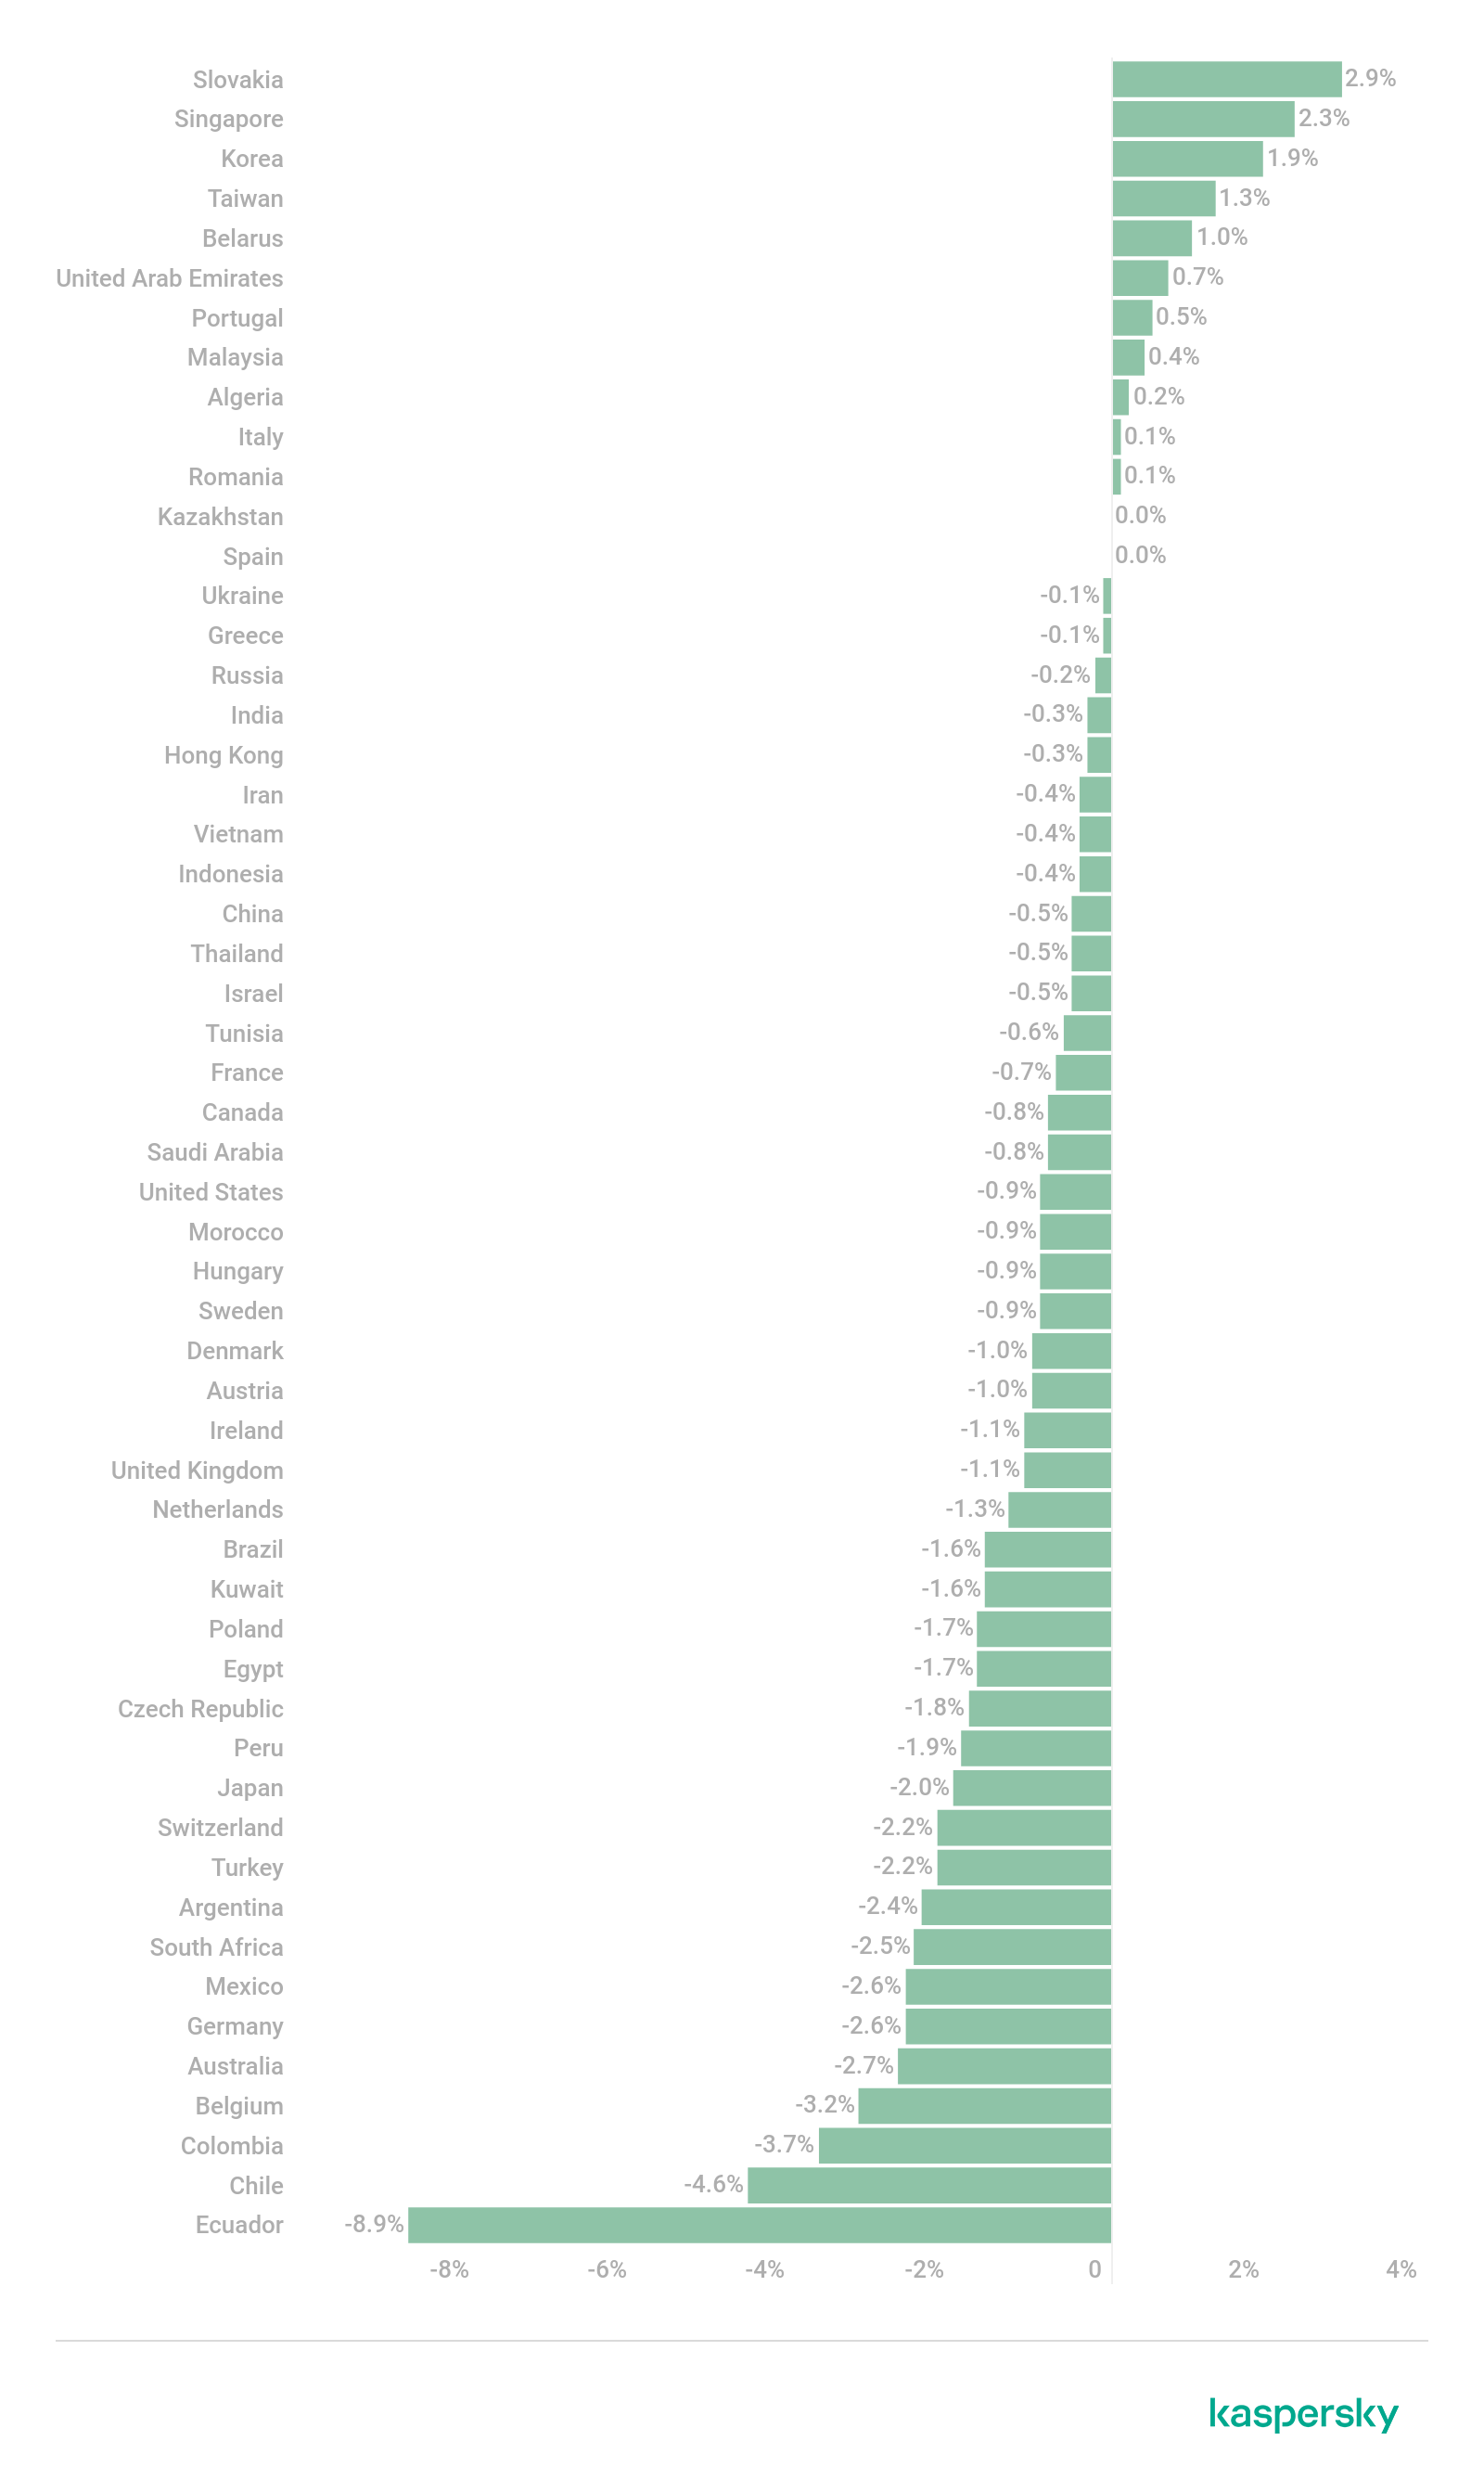
- This indicator increased in all regions except East Asia, the US and Canada, Western Europe, and Russia.
- In 73.4% of all countries in H2 2020, the percentage of ICS computers on which malicious email attachments were blocked increased compared to H1 2020.This is three times larger than the equivalent indicator for 2019 (23.6%).
Change in the percentage of ICS computers (p.p.) on which malicious email attachments were blocked in H2 compared to H1, countries and territories, 2019 vs 2020 (download 1, 2)
- Globally, in H2 2020, the percentage of ICS computers on which malicious email attachments were blocked increased by 0.7 p.p. compared to H1.
- There was a rise in the percentage of ICS computers on which threats distributed over the internet and email, and spyware and miners were blocked
- Malicious objects from the internet – web resources involved in the distribution or management of malware (+2.5 p.p.), and malicious scripts and redirects on web resources (JS and HTML) (+1.6 p.p.).
- Typical threats distributed by email (+1.2 p.p.). – malicious MS Office and PDF documents (+1.2 p.p.).
- Spyware (+1.4 p.p.) – Trojans, backdoors, and keyloggers.
- Miners (+0.7 p.p.) – executable files for Windows.
For all these threats, the indicators of H2 2020 exceeded the equivalent results of not only H1 2020 but also H2 2019.

Percentage of ICS computers on which various types of malicious objects were blocked, H2 2019 – H2 2020 (download)
- In developed countries, the percentage of ICS computers attacked by ransomware increased
Globally, the percentage of ICS computers on which ransomware was blocked decreased from 0.63% in H1 to 0.49% in H2.At the same time, this indicator increased in regions with developed countries:- +0.25 p.p. in the US and Canada
- +0.23 p.p. in Australia
- +0.13 p.p. in Western Europe

Change in the percentage of ICS computers (p.p.) on which ransomware was blocked in H2 2020 compared to H1 (download)
Impact of the COVID-19 pandemic
In our H1 2020 report, we wrote about the impact of the COVID-19 pandemic on the changes that we observed in the attack surface and threat landscape for industrial enterprises and industrial automation systems. In H2 2020, we continued our observations and identified a number of trends that could, in our opinion, be due to circumstances connected with the pandemic in one way or another, as well as the reaction of governments, organizations and people to these circumstances.
Changes in seasonal fluctuations in the percentage of attacked computers
It can be seen in the ‘Percentage of ICS computers on which malicious objects were blocked’ diagram that in the past years the percentage of attacked ICS computers significantly decreased in summer months and in December. It is likely that this decrease was associated with traditional vacation periods: an infected USB drive cannot transfer malware from one computer to another all by itself, nor can an engineering workstation click on a link leading to a phishing website when the engineer is not there.
However, there was a noticeable change in the situation in 2020: we saw no significant seasonal fluctuations in the percentage of attacked computers. It is likely that this was due to changes in employee vacation schedules, since many people decided to go without vacations in the time of lockdown, travel restrictions, and closed borders.
Attacks on RDP remote connection services
Another effect of the pandemic was a noticeable increase in the percentage of ICS computers that could be accessed remotely via the RDP protocol.

Percentage of ICS computers accessible via RDP, by months of 2020 (download)
It can be seen in the diagram above that the percentage grew continuously from January to April – the time when many organizations were dealing with the challenges of organizing work under an impending and actual lockdown. Then, after some fluctuations, the percentage decreased somewhat and stabilized at a slightly higher level than before the pandemic.
We do not have sufficient data to make conclusions as to what proportion of these computers could only be accessed from the industrial network of the enterprise, what part could be accessed from the corporate segment of the network and what percentage was available even outside the organization’s perimeter. However, we can state with confidence that the increase in the availability of ICS computers certainly affected the attack surface. Threat actors clearly took advantage of that – this is obvious from the following diagram, which shows the percentages of ICS computers on which brute force attacks on credentials used to access the RDP service were detected and blocked:
Percentage of ICS computers on which attempts to brute force RDP passwords were detected, by months of 2020 (download)
It is easy to notice a certain synchronism in the changes occurring in these two parameters: the percentage of attacked RDP connections follows the percentage of UCS computers available via RDP almost all through the year (from January to October) with a delay of approximately one month, catching up (i.e., the changes are synchronized) in October and November.
Percentage of ICS computers on which brute force attacks on RDP passwords were detected and percentage of ICS computers available via RDP (download)
We can only guess whether the one-month ‘delay’ in changes occurring in the percentage of attacked computers had to do with the speed with which attacks propagated on the enterprise network or the speed with which threat actors responded to changes in the opportunity landscape (attack surface).
Changes in ransomware priorities
One more potential consequence of the pandemic can be identified by analyzing the dynamics of ransomware attacks on industrial enterprises in different regions, which can be indirectly assessed based on the percentage of ICS computers attacked by ransomware. It can be seen in the ‘Change in the percentage of ICS computers (p.p.) on which ransomware was blocked’ diagram, as well as the diagram below that this percentage decreased in H2 2020 in all regions of the world except North America, Western Europe and Australia, where it did not just fail to decrease but increased several times over!

Percentage of ICS computers on which ransomware was blocked, H2 2019 – H2 2020 (download)
We believe that these curious dynamics could indicate the response of threat actors to the economic consequences of the pandemic. In those countries where the ‘creditworthiness’ of organizations decreased as a result of the pandemic, the number of attacks on industrial enterprises also fell (and so did the percentage of attacked ICS computers). At the same time, in countries where industrial organizations were generally more financially stable and were still able to pay ransom, the activity of attackers increased (and the percentage of attacked ICS computers surged). It can be hypothesized that the changes that we observed were due, among other things, to a shift in some groups’ focus when choosing victims towards organizations in more economically stable countries.
The full report is available on Kaspersky ICS CERT.
Threat landscape for industrial automation systems. Statistics for H2 2020
Comment
From the same authors


In the same category


Hicham
Hello,
I am interested in the details of industrial threats ICS, OT and IIOT by month, by time and by date.
Yuliya
Hi, Hicham!
You can find the full version of the report here or contact Kaspersky ICS CERT if you have additional questions.