
January in figures:
- The amount of spam in email traffic increased by 0.5 percentage points compared to December and averaged 77.6%.
- Phishing emails accounted for 0.03% of all mail traffic, a decrease of 0.11 percentage points compared to the previous month.
- Malicious files were found in 2.75% of all emails, an increase of 1 percentage point compared to December’s figure.
Spam in the spotlight
Festive season
In early January, the main factor determining the amount of spam in mail traffic was the New Year holidays. It may sound strange, but spam also appears to have taken a holiday. As can be seen from the chart below, during the period 1-10 January the percentage of spam in mail traffic was significantly lower than usual.
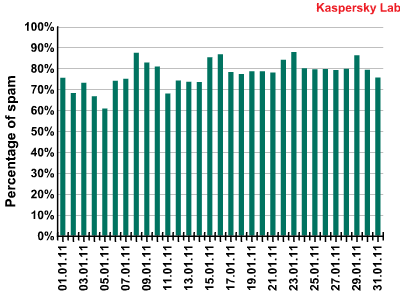
Spam in mail traffic in January 2011
It should be noted that when talking about the percentage of spam we mean relative values (not absolute) which depend both on the volume of spam traffic and on the amount of ‘clean’ mail traffic. In absolute figures the share of spam messages in the first days of January decreased by a factor of 5-6.
It is safe to say that the main reason for this decline is the decrease in botnet activity. It is a well-known fact that the vast majority of spam is sent using zombie networks. During the holiday period many infected machines would have been turned off so they did not facilitate the distribution of spam. The fact that the lull in botnet activity coincided with the New Year holidays, and not the Christmas holidays of the western world, suggests that Russians, or to be more precise, criminal organizations from the former Soviet republics play a significant role in the global spam business. There is a widely held belief that citizens of the USSR are behind the numerous botnets and partner programs that are currently active. Spam distribution at the beginning of January appears to confirm this, with botmasters and partner program owners probably on holiday too.
The amount of spam in mail traffic had returned to pre-holiday levels by mid-January.
Two months’ respite
In the second half of 2010 the spam business suffered several serious blows which had a profound effect on the volume of unsolicited correspondence in mail traffic, the type of spam being sent and its geographical sources. However, in December and January the spammers enjoyed a period of relative calm with no high-profile campaigns against them or legal hassles.
That easing of pressure had an almost immediate effect. In January, the USA reentered the Top 20 ranking of the most popular sources of spam. This seems to testify to the fact that the spam business is gradually recovering there.
To recap, the USA had for a long time been the undisputed No.1 distributor of spam. Back in August 2010, for example, its spam output reached 15.5% of all spam. In September, the volume of unsolicited emails sent from the USA started to decrease and in October it fell to 18th place. The USA disappeared altogether from the Top 20 in November and December, having distributed less than 1.5% of all spam. In January, it was back in our rating and ranked 14th.
It also appears that the USA is clearly regaining popularity among those spreading malware, with an increase recorded in the number of messages containing malicious code detected by mail antivirus. Interestingly, the dramatic growth in the amount of mail antivirus detections in India was followed by an increase in the share of spam distributed from that country. The upturn in malicious programs being detected was obviously linked to a “recruiting” campaign to add more computers to zombie networks sending out spam. The increase in mail antivirus detections in the United States suggests that cybercriminals are trying to revive their old botnets or to create new ones which could soon result in the amount of spam emanating from the country returning to earlier levels. However, this does not mean that the USA will regain its former place at the head of the Top 20 most popular sources of spam.
In January, medical spam started to gradually reclaim its former position, which is yet another indicator that the spam business is stabilizing. Pharmaceutical partner programs used to be the most profitable source of income for spammers. However, the intensity of the anti-spam campaign in the latter months of 2010 led to a dramatic decline in this category of spam.
The percentage of spam advertising Viagra in January increased again. Rapid growth was recorded at the beginning of the month when the amount of pharmaceutical spam almost reached 60% of all spam. However, this was against a backdrop of a general decline in spammer activity. The upsurge in medical spam could have been caused by botmasters going on holiday and giving their botnets instructions to send out good old pharmaceutical spam and not to bother searching for other options or clients.
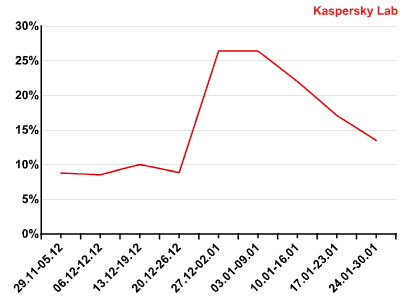
The percentage of spam emails contaning Viagra offers in December 2010-January 2011
Indeed, by the end of the month this spam category accounted for 45% of all spam messages, but even that figure is 15 percentage points higher than in December. According to the monthly results, pharmaceutical spam has won back its leading position in the rating of the most popular spam categories.
In general, the percentage of spam emails grew slightly compared to December’s figure. This happened despite a considerable decrease in the volume of spam traffic at the beginning of the month. Ignoring the New Year lull, the share of spam in all mail traffic for 10 – 31 January averaged 79.1%, an increase of 2 percentage points compared to December. This could also be considered a sign of the spam business stabilizing.
Early Valentine’s cards
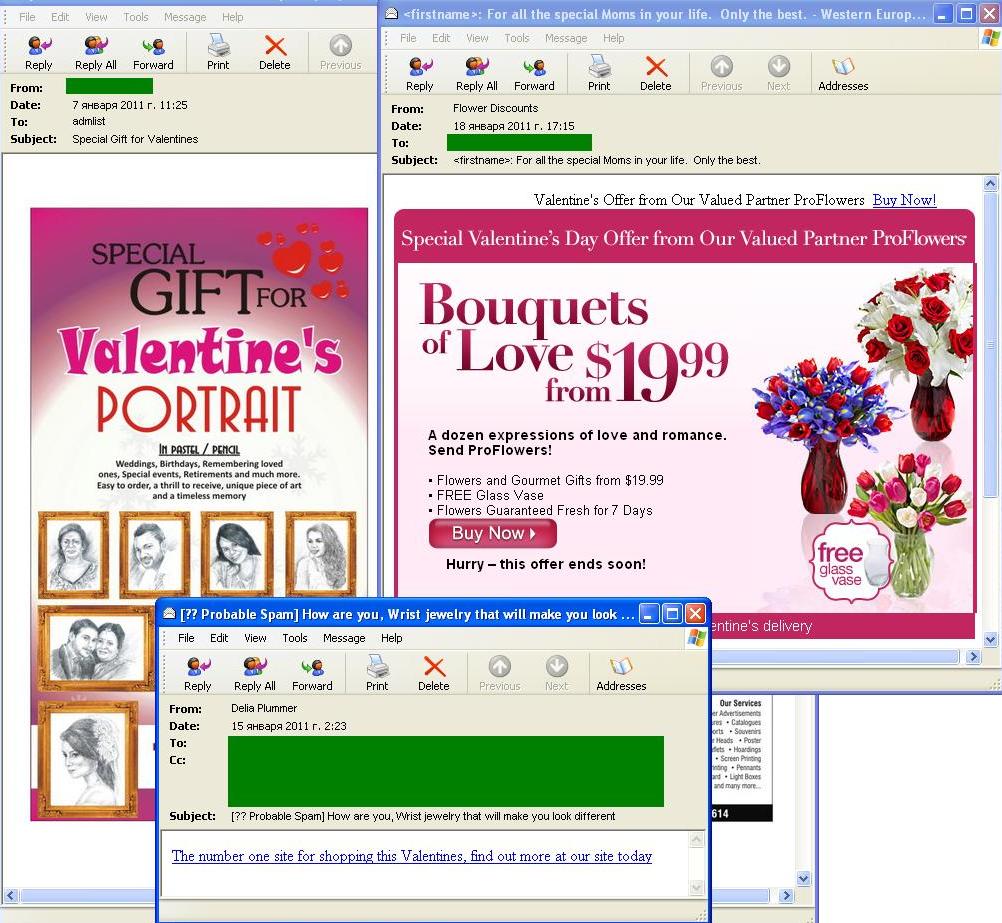
On 7 January, more than a month before Valentine’s Day, our spam lab registered the first emails exploiting the Valentine’s theme.
This type of spam message traditionally contains adverts for unusual gifts, flowers, fake designer goods, medication to improve the male libido etc.
Naturally, the number of these emails grows as 14 February approaches.
Users should be particularly vigilant with all emails received in this period: a Valentine’s Day card from an unknown sender may contain a malicious code or a link to an infected site instead of a declaration of love.
Statistical summary
Spam in mail traffic
The amount of spam detected in mail traffic increased by 0.5 percentage points and averaged 77.6% in January 2010. A low of 60.7% was recorded on 5 January with a peak of 87.7% on 23 January.
Sources of spam
Russia, India and Italy maintained their leading positions as the most popular sources of spam with their contribution to the world’s spam traffic remaining almost unchanged from December. The amount of spam emanating from India stood at 9.01%, a decrease of 0.88 percentage points. Russia came second again having distributed 0.3 percentage points less spam than in December. 5.07% of spam originated in Italy, an increase of 0.27 percentage points when compared to the previous month.
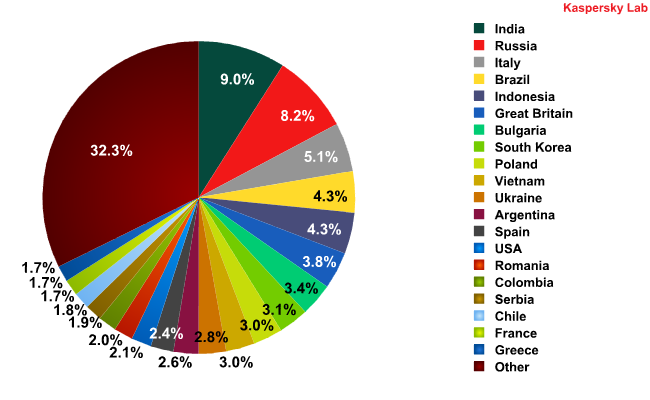
Sources of spam in January 2011
In January, there were no major shifts either in the geography of the main sources of spam or in the percentage ratio of email spam originating from them: the contribution of each country only fluctuated within a range of 1 percentage point compared with December’s figures with the exception of Vietnam which dropped from 4th to 10th place (-1.75 percentage points).
We have already mentioned that the USA’s re-entry to the Top 20 can be considered a momentous event. Even though in January it only distributed 2.07% of all spam, 14th position in the rating suggests that cybercriminals have taken the first steps to restoring their botnet capacity inside the USA.
Malware in mail traffic
Malicious files were found in 2.75% of all emails in January, a drop of 1 percentage point compared with the previous month.
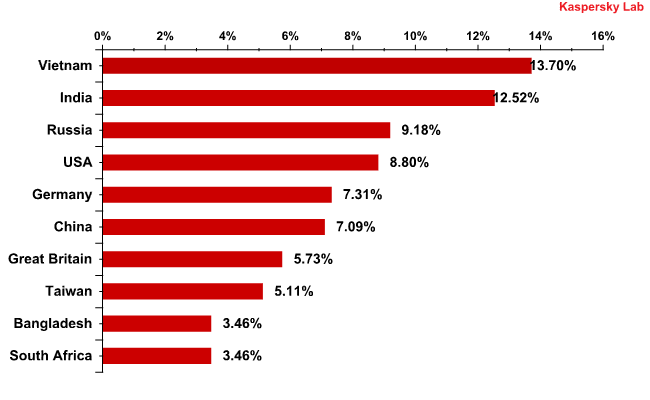
Countries where mail antivirus detected malware most frequently in January 2011
As in December, the majority of emails with malicious attachments were detected in India, Russia and Vietnam. The USA and the UK moved up this rating which could be the result of efforts to restore botnets after law enforcement agencies eased the pressure on the spam industry. Ukraine, where over 4% of all malicious programs were detected in mail traffic in December, disappeared from the Top 10 in January.
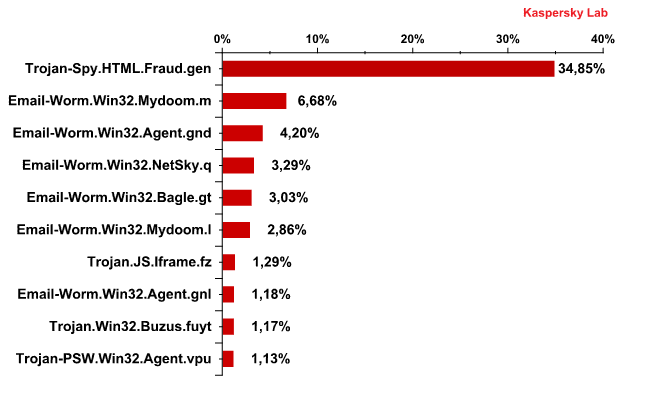
The Top 10 malicious programs distributed via mail traffic in January 2011
Trojan-Spy.HTML.Fraud.gen again topped the list of the 10 most popular malicious programs distributed via email in January.
This particular Trojan uses spoofing technology and appears in the form of an HTML page resembling the site of a well-known bank or e-pay system where the user is asked to enter a login and a password.
For the second month in a row the majority of Top 10 malicious programs spread via email were mail worms whose main functions were the harvesting of email addresses and spreading themselves via mail traffic.
In January, the Top 10 welcomed one more Email-Worm.Win32.Mydoom modification – Email-Worm.Win32.Mydoom.l. Both variations of the Mydoom worm were added to Kaspersky Lab’s databases in 2004. The messages sent by these malicious programs are used to send a copy of itself in the form of a message containing a fake email system notification about a delivery failure. In this case the main function of the program is the harvesting of email addresses. More details about these malicious programs can be found here and here.
Two more mail worms in January’s Top 10 were Email-Worm.Win32.Agent.gnd and Email-Worm.Win32.Agent.gnl. The Agent.gnd modification was seen in the rating in December. However, their functionality is more sophisticated compared to the aforementioned worms. They not only collect email addresses and distribute themselves via mail traffic but install other malicious programs once they penetrate a victim computer. These malicious programs are mostly Trojan downloaders which immediately try to gain access to Internet resources in order to download other malware.
The functionality of Email-Worm.Win32.Bagle.gt is more complicated compared to other “simpler” worms. It does not install Trojan downloaders but downloads malicious programs itself from Internet resources. It also sends a copy of itself to all email addresses harvested from the victim machine.
Spam by category
As was mentioned above, in January pharmaceutical spam regained its leading position in our rating of the most popular spam categories. In second place was the Personal Finance category – sites offering cheap loans and help finding work. This upsurge at the beginning of the year could be down to the need to pay off loans and reflect turbulence in the labor market.
The Fake Designer Goods category, which topped the rating in December, dropped to third place in January.
Conclusion
For spammers, December and January was a time of gradual recovery from the anti-spam and anti-botnet campaigns which had such a significant impact on their capabilities. Unfortunately, they have been quite successful at restoring their botnets and if no new incidents affect the world of spam in the near future, the volume of unsolicited messages in mail traffic could reach summer 2010 levels by spring.
Though the share of pharmaceutical spam fell considerably after botnets came under attack in autumn, it has by no means been eradicated: spammers will never give up such a profitable side of their business unless law enforcement agencies resume a robust anti-spam campaign. The distribution of medical-related spam will no doubt be reinvigorated in February on the eve of Valentine’s Day.
It is likely that the volume of spam originating from the USA will also return to previous levels. This is because the country is high computerized and cybercriminals see it is an attractive location for botnets.
We would once again like to remind users that apart from a reliable antivirus solution it is extremely important to exercise care when communicating online and while surfing the Internet.



Spam report: January 2011