
February in figures
- The amount of spam in email traffic was up 2.3 percentage points compared to January and averaged 78.5%
- The amount of phishing emails remained unchanged compared with January’s figure, accounting for 0.02% of all mail traffic
- Malicious files were found in 2.8% of all emails, a decrease of 1.5 percentage points from January.
Spam in the spotlight
Holiday spam
In our spam report for January we wrote about spam dedicated to Valentine’s Day, a theme that was also discussed in a separate blog. Valentine’s spam peaked on 12 February, when 0.2% of all spam messages exploited the patron saint of love’s holiday.
February saw English-language spammers start offering Easter-themed gifts.
Interestingly, in February we registered an English-language mass mailing exploiting the theme of International Women’s Day (8 March), a holiday which is not widely celebrated in English-speaking countries.
It’s not very clear what the authors of this mass mailing wanted to achieve by offering an English-speaking audience pills to improve male virility as a present for Women’s Day. The message was headed “8 of March Goods”, though this had nothing to do with the advertised site. It also remains a mystery why the spammers used a fragment from the English-language edition of Lev Tolstoy’s War and Peace to add “noise” to the text – perhaps they are slavophiles.
Political spam
In February, the Russian-language section of the Internet, or RuNet, was full of political mass mailings. This was unsurprising considering the numerous political rallies and protests that were taking place across Russia and the country’s upcoming presidential elections.
English-language spam traffic also contained mailings with a political theme as the US presidential race hots up.
Statistical summary
Sources of spam
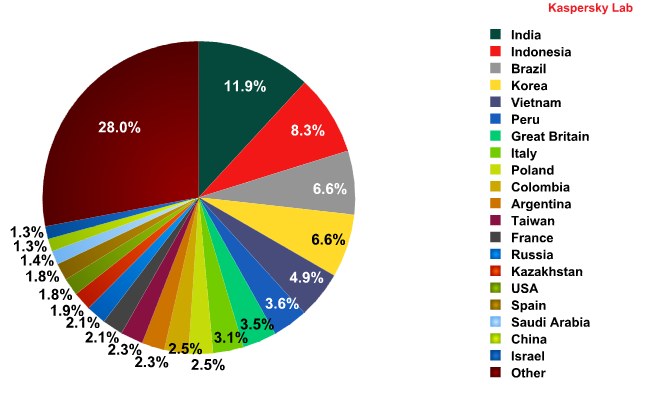
Top 20 sources of spam in February 2012
The top 20 most popular sources of spam remained largely unchanged from the previous month: the first 12 places were occupied by the same group of countries, though some swapped places. The share of spam distributed from the countries in the rating did not change significantly, with fluctuations within a range of 1.5 percentage points.
India maintained its leadership with 11.9% of all distributed spam (+0.4 percentage points). Indonesia’s contribution also increased slightly (+0.3 percentage points).
Brazil and South Korea, which came 3rd and 4th respectively, demonstrated similar results for the second month in a row – the amount of spam originating from each country dropped by a little over 1 percentage point in February.
Malware in mail traffic
In February, the share of malicious files found in all emails amounted to 2.8% — a decrease of 1.5 percentage points compared to January.
Distribution of email antivirus detections, by country
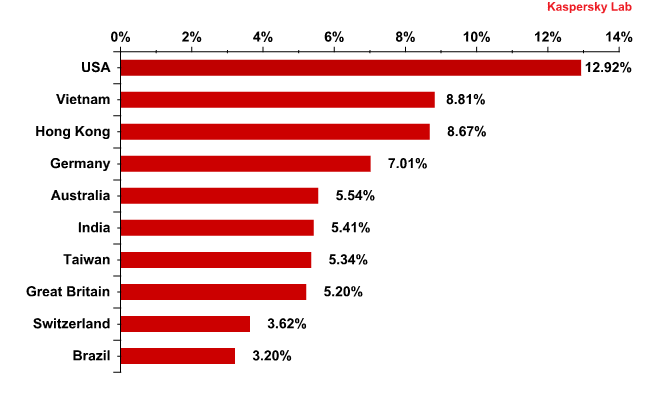
Distribution of email antivirus detections, by country: February 2012
For the second month in a row the US suffered the highest level of email antivirus detections, though the share of Kaspersky Mail Antivirus detections decreased slightly compared to January (-0.2 percentage points).
Russia left the Top 10 as the share of antivirus detections in there dropped by another 2 percentage points.
As we have already mentioned, there are two main objectives when it comes to spam distribution. The first is to spread malware in order to gain access to users’ personal and financial data; the second is to incorporate users’ computers in botnets.
When malware is distributed to harvest data, it mostly targets developed countries where users have a higher standard of living and the use of Internet banking is more widespread. Developing countries, where only small numbers of computers are protected by antivirus programs, mostly attract malware used to expand botnets.
Malicious code targeting users’ personal and financial data currently prevails in spam traffic. However, bot programs continue to spread, mostly in Asia.
This breakdown of different types of attack by region has been observed over the last two months. The changes in the share of antivirus detection on the territories of all countries except Russia were insignificant, fluctuating within a range of 1.5 percentage points.
Top 10 malicious programs spread via email in February 2012
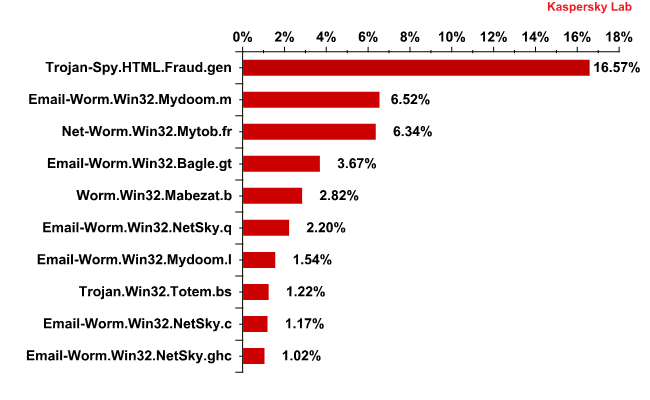
Top 10 malicious programs spread via email in February 2012
The top four malicious programs that spread via email in February were unchanged from January.
Rating leader Trojan-Spy.HTML.Fraud.gen accounted for over 16% of all detections. This Trojan uses spoofing technology and appears in the form of an HTML page. It comes with a phishing email containing a link to a fake site resembling that of a well-known bank or e-pay system where the user is asked to enter a login and a password.
Six out of 10 malicious programs detected in mail traffic are mail worms belonging to the Email-Worm.Win32.Mydoom, Email-Worm.Win32.NetSky, and Email-Worm.Win32.Bagle families.
Mydoom.m, Bagle.gt and NetSky.q, ending the month in 2nd, 4th and 6th respectively, were non-movers in February. Another two worms of the NetSky family – NetSky.c and NetSky.ghc – occupied 9th and 10th places. Mydoom.l, the second Mydoom malicious program, was ranked 7th.
Half of the top 10 is made up of malicious programs belonging to the Mydoom and NetSky families that have only two functions – to harvest email addresses and send copies of themselves to these addresses. Bagle.gt, yet another mail worm, in addition to the usual functionality downloads malicious programs from the Internet.
Phishing
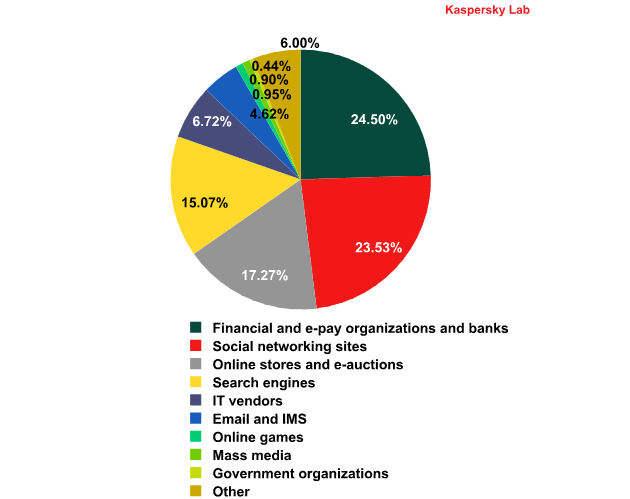
Top 100 organizations, by sphere of activity, targeted by phishers in February 2012
(based on anti-phishing component detections*)
*This rating is based on our anti-phishing component detections activated every time a user attempts to click on a phishing link, regardless of whether the link is in a spam email or on a web page.
The top 100 organizations targeted by phishers in February remained almost unchanged from the previous month.
Financial organizations are still the most attractive target for the phishers. As was the case in January, almost a quarter of the anti-phishing component detections came from phishing sites designed to steal from bank and e-pay accounts.
The share of anti-phishing detections on phishing sites targeting social network accounts increased by 3.5 percentage points compared with January’s figure. Facebook became the most popular phisher target in February. At the same time the amount of anti-phishing detections targeting online stores and e-auctions dropped by 3 percentage points. Last month’s leader Amazon noticeably lost ground in February.
The share of the other categories changed insignificantly – within a range of 1 percentage point.
Hallmark, which supplies e-greeting cards, was among the top 100 resources whose customers were targeted by phishers. It is likely that the fraudsters attempted to exploit the company’s brand in order to spread malware on Valentine’s Day.
Spam by category
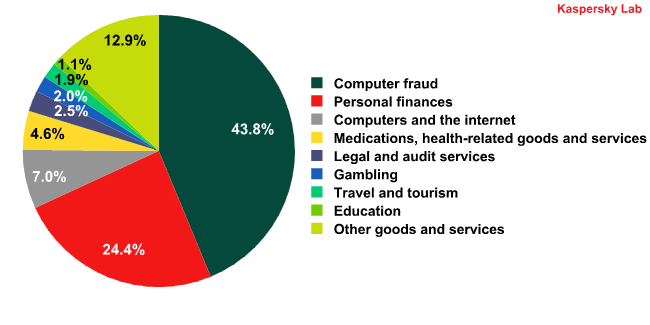
Spam by category in February 2012
The top two categories in English-language spam remain unchanged for the third month in a row. The share of both increased compared to January: fraudulent emails remained on top with an increase of 4.6 percentage points. The percentage in the personal finance category grew by 3.9 percentage points.
February saw a decrease in the amount of mass mailings offering educational grants or a scientific degree which were popular with the spammers last month. As a result, the share of emails in the education category decreased significantly and only averaged 1.19%.
Conclusion
The reduction in the share of spam with malicious attachments is unlikely to last long. It is difficult to imagine that spammers would forego the chance to participate in partner programs that distribute malicious code, especially when the number of orders for spam in developing countries is falling as a result of the global economic downturn.
It should also be noted that malware in spam is distributed both in the form of attachments and in the form of malicious links, which means the decrease in the share of malicious attachments in mail traffic does not always indicate a reduction in the amount of malicious mass mailings.


Spam report: February 2012