
February in figures
- The amount of spam in mail traffic increased by 1.1 percentage points compared to January and averaged 78.7%.
- The amount of phishing emails was unchanged in February, accounting for 0.03% of all mail traffic.
- Malicious files were found in 3.18% of all emails, an increase of 0.43 percentage points compared to January’s figure.
Spam in the spotlight
China and the USA join forces to battle spam
Vendors of anti-spam software aim to protect end-users from unsolicited emails rather than address the sources of spam. They simply do not have the resources or authority to hamper the registration of spam domains, shut down hosting services that provide platforms for botnets or to break up those botnets. Anti-spam vendors can offer expert advice, but there needs to be public demand for it. For this to happen there needs to be effective anti-spam legislation that law enforcement agencies can implement in order to combat unwanted mail.
Moreover, spam is both an international and regional business, which means any measures to tackle it have to go beyond those of individual states. In other words, law enforcement agencies from different countries have to cooperate with each other.
This is the conclusion reached by authorities in China and the USA which for the meantime are ready to put aside their differences on issues related to the Internet to concentrate on combating spam. A joint document drafted by officials from both countries entitled ‘Fighting Spam to Build Trust’ is due to be published in March.
We hope that this initiative will encourage other organizations and states to follow suit.
Until 2010 China was one of the leading sources of spam and the .cn domain accounted for the lion’s share of spam sites. Legislative measures led to a dramatic reduction in the amount of spam emanating from China (from 3.5% of all spam in 2009 to 1.9% in 2010) while spam sites were almost completely eradicated from the Chinese domain zone.
The USA, on the other hand, ended 2010 as the biggest single distributor of spam (16%). A number of measures were implemented in the second half of the year that were quite successful at combating spam. The closure of the Pushdo/Cutwail botnet in August 2010, for instance, led to a tenfold decrease in the amount of spam being distributed from the USA. Unlike in China, however, the measures adopted by US law enforcement agencies did not have a long-term effect.
Revival of spam traffic from the USA
In our January report we noted a gradual increase in the amount of spam traffic coming from the USA and February merely reinforced this trend.
As was mentioned above, after the closure of the Pushdo/Сutwail botnet the volume of spam emanating from the USA fell considerably. The USA managed to maintain a record-low level of spam distribution throughout autumn and early winter (6% in September and around 1-1.5% from October to December).
The amount of spam coming from the USA grew steadily from early January and had reached 2.5% of all spam traffic by the end of the month. In February it reached its highest level in four months – 4.27%. It looks like that figure is going to continue rising in the next few months.
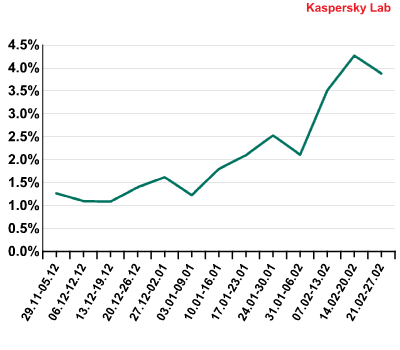
Volume of spam distributed from the USA from December 2010 to February 2011
This forecast is confirmed by analysis of mail antivirus data – the USA came second in terms of detections made by our mail antivirus module in March.
We have already noted on several occasions that spam mailings are used as a method to spread malicious code, including malware capable of adding computers to a zombie network. An increase in the level of mail antivirus detections in a particular region suggests that the amount of spam coming from that region will increase in the near future.
The number of detections made by mail antivirus in the USA fell significantly after the closure of the Pushdo/Cutwail botnet. It appears the cybercriminals involved not only lost a huge botnet but also temporarily froze the activities of other smaller zombie networks. This may have been a precautionary measure following the increased interest in their activities by law enforcement agencies.
Our mail antivirus module has been recording more and more detections over the last two months.
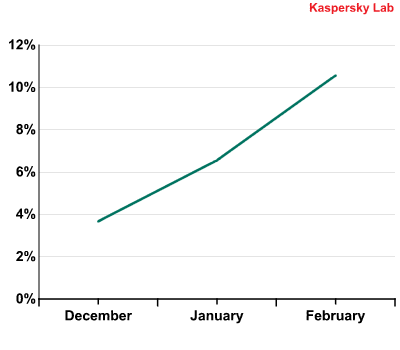
Mail antivirus detections recorded in the USA from December 2010 to February 2011.
Statistical summary
Spam in mail traffic
The amount of spam detected in mail traffic increased by 1.1 percentage points compared to the previous month and averaged 78.7%. A low of 72.3% was recorded on 11 February with a peak of 86.8% on 13 February.
Sources of spam
India remained the leading source of spam in February, accounting for 8.83% of all spam traffic – a drop of 1.02 percentage points compared to January.
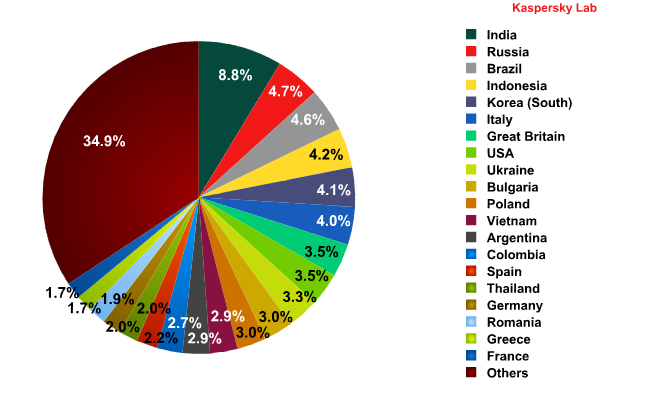
Sources of spam in February 2011
Almost half as much spam came from Russia – the second biggest source – compared to the previous month after a drop of 4.26 percentage points. The volume of spam coming from Russia decreased throughout the month and in the final week of February there was more spam emanating from the USA than Russia.
South Korea climbed six places to claim fifth place. The amount of spam coming from South Korea grew by 1.4 percentage points compared to the previous month.
The figures for the other countries in the Top 5 remained virtually unchanged in February, although their positions did change. Brazil rose to third place (+0.41 percentage points) and Indonesia moved up one place to fourth (-0.39 percentage points). Italy, meanwhile, dropped to sixth place (-0.78 percentage points).
The USA ended the month as the eighth biggest source of spam.
Malware in mail traffic
Malicious files were found in 3.18% of all emails in February, a rise of 0.43 percentage points compared with the previous month.
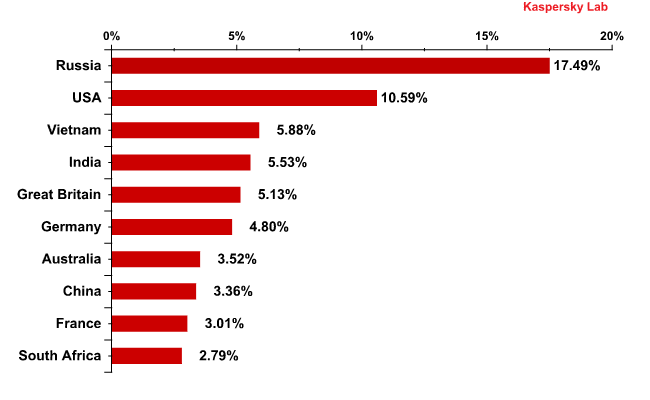
Countries where mail antivirus detected malware most frequently in February 2011
The country where most malicious attachments were detected by our mail antivirus was Russia. The USA claimed second place pushing Vietnam and India down to third and fourth places respectively. Once again our mail antivirus detected high levels of malicious attachments in mail traffic in the UK and Germany.
The malicious programs most commonly detected in mail traffic in February were as follows:
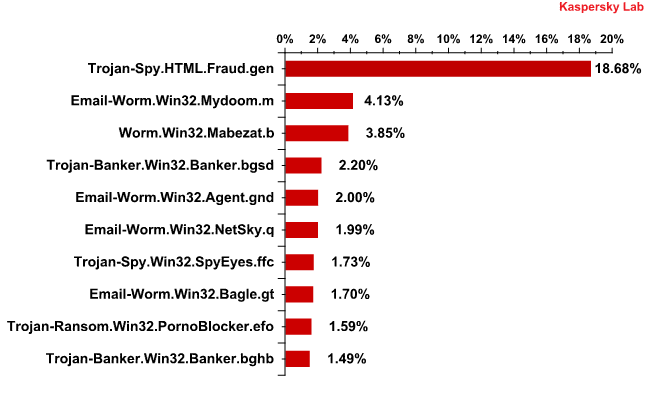
The Top 10 malicious programs distributed via mail traffic in February 2011
The malicious programs in February’s rating can be split into two groups. The first group consists of worms which we have covered in previous reports. This group includes the second place entry Email-Worm.Win32.Mydoom.m – a long-term resident in our antivirus databases whose primary function is to harvest email addresses that help it to continue spreading. You can find out more about this worm here.
Occupying sixth place in our rating is the slightly newer Email-Worm.Win32.NetSky.q, which has identical functionality. You can find out more about this malicious program here.
As well as harvesting email addresses and using them to propagate itself, Email-Worm.Win32.Agent.gnd in fifth place installs other malicious programs. These tend to be Trojan downloaders that immediately try to gain access to specific websites from which they download other malicious programs.
In eighth place and with more complex functionality than basic mail worms, Email-Worm.Win32.Bagle.gt
does not install downloaders on a system but contacts websites itself in order to download malicious programs from them. This worm also harvests email addresses and uses them to continue spreading.
The second group of malware consists of programs designed to steal confidential information. It includes Trojan-Spy.HTMLFraud.gen, the long-standing leader of the rating.
This group also includes a couple of new entries that are representatives of the Trojan-Banker family – Trojan-Banker.Win32.Banker.bgsd and Trojan-Banker.Win32.Banker.bghb. These two programs are designed to steal confidential financial information from users.
Trojan-Spy.Win32.SpyEyes.ffc is another newcomer to the rating and is yet another program that steals confidential data from users.
Two other programs in the rating did not fall into either of the aforementioned groups: Trojan-Ransom.Win32.PornoBlocker.efo, which disables victim computers and demands payment to restore access, and Worm.Win32.Mabezat.b, which is a regular in our rating (more details can be viewed here).
Conclusion
As we predicted, the overall amount of spam in email traffic is gradually increasing and this trend is particularly evident when it comes to spam emanating from the USA. We forecast a return to spam levels of 81-82% by April-May 2011.
On the current evidence, it looks like the USA will once again be among the top five sources of spam in March.
February’s rating of the most common malicious programs detected in mail traffic serves as a reminder that cybercriminals are extremely interested in gaining access to any valuable confidential information that is stored on users’ computers. The black hats have a wealth of tools at their disposal to help them achieve this. The user’s main line of defense is their common sense, which ensures that antivirus protection is kept up to date and that suspicious email attachments from unknown senders are never opened.


Spam report: February 2011