
Recent trends
- The amount of spam in email traffic decreased by 2.4 percentage points compared to July’s figure and averaged 82.6%.
- Links to phishing sites were found in 0.03% of all emails, an increase of 0.01 percentage points compared with the previous month.
- Malicious files were found in 6.29% of all emails, an increase of 3.1 percentage points compared with the previous month.
Spam in mail traffic
The amount of spam detected in mail traffic averaged 82.6% in August 2010. A low of 79.4% was recorded on 2 August, with a peak value of 89.7% being reached on 7 August.
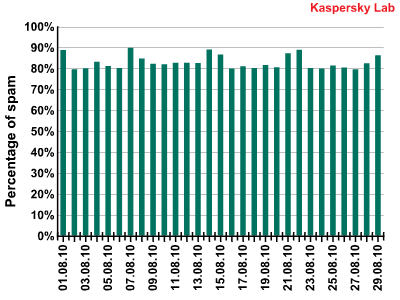
Spam in mail traffic in August 2010
Sources of spam
Hong Kong, which last month debuted in 17th place in July’s Top 20, unexpectedly appeared at 2nd place. In August, 7.7% of the total volume of spam was distributed from its territory. A bit less spam – 7.2% – originated from India which came 3rd in the rating.
The USA maintained its leadership with 15.5% of the total amount of distributed spam.
After a short break, the Netherlands and Canada reentered the Top 20 having distributed 1.5% of the total spam volume each.
Conversely, Indonesia and Taiwan’s presence in the Top 20 was short-lived and in August 2010 they left the list of leaders.
The UK is still in 5th place, having distributed 1% less spam than in July.
Phishing
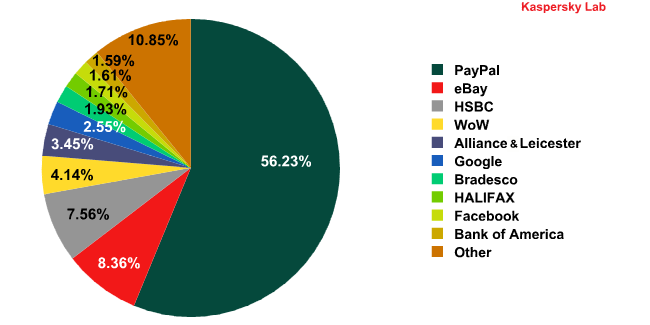
Organizations targeted by phishing attacks in August 2010
One very noticeable change in the rating of organizations most frequently targeted by phishers was Facebook’s drop from 2nd to 9th place. The percentage of attacks on this resource fell by more than ten times last month. It’s difficult to say what caused the cybercriminals’ huge loss of interest in this social network. Perhaps it might be the calm before the storm.
At the same time, there were double the number of attacks targeting one of the Top 5 leaders, HSBC, and WoW moved up from 8th to 4th position.
The percentage of attacks on eBay remained the same.
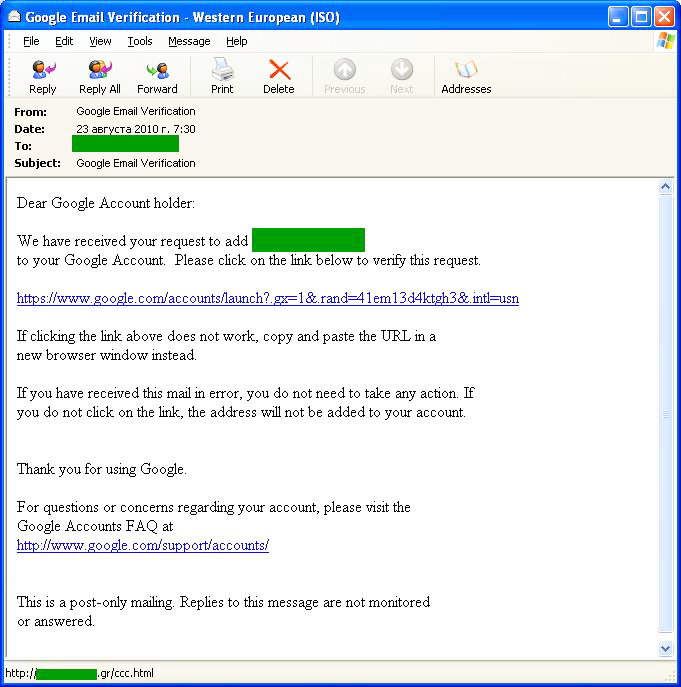
In August, Google was attacked several times more often than in July: the share of attacks on this organization increased by 0.75 percentage points, placing it in 3rd position in the rating. The scheme the fraudsters used to gain access to users’ personal data has not changed from that which they used in July.
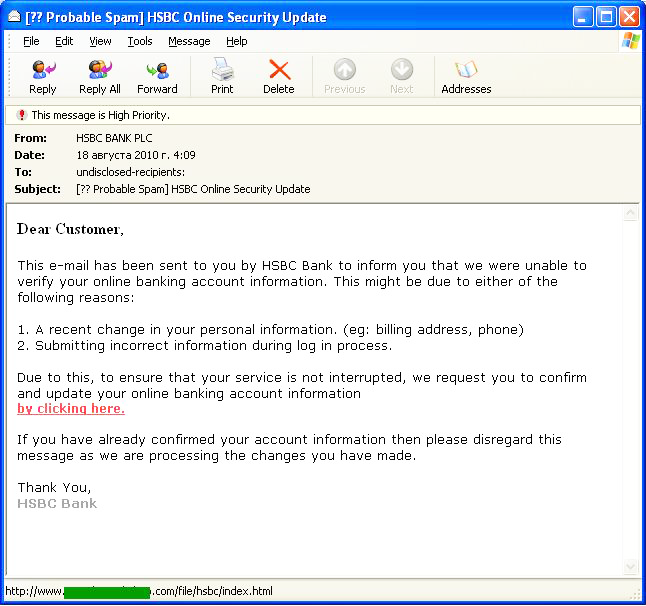
The abovementioned HSBC came 3rd in August. Our analysts recorded numerous phishing attacks aimed at stealing login credentials for HSBC’s e-banking system.
Below is an example of one such email:
Malware in mail traffic
In August, the Top 10 list of malware distributed via email looked like this:
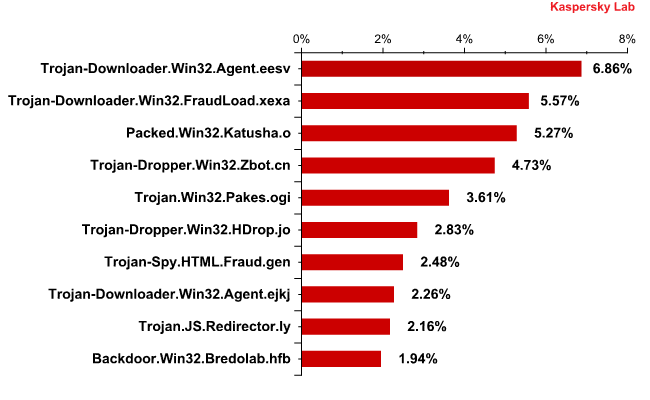
Malicious programs in email traffic in August 2010
As we can see, August’s list of the most widespread malware in mail traffic is much more “heterogeneous” than July’s. It included 10 malicious programs which belonged to 9 different families. The Trojan-Downloader.Win32.Agent family maintained its leadership: two variants of this program Trojan-Downloader.Win32.Agent.eesv (12.87%) and Trojan-Downloader.Win32.Agent.ejkj (4.23%) came 1st and 8th in the rating. After installation, these programs connect to the system resources in order to access the URL list which is then used to download other malicious programs.
Trojan-Downloader.Win32.FraudLoad.xexa accounted for more that 10% of all malware distributed via email. The Trojans of this family install a rogue antivirus program on victims’ computers that is designed to extort money.
In 3rd place comes Packed.Win32.Katusha.o, a variant of a packer that was popular half a year ago. This program may contain both rogue antivirus programs and Zbot.
The list of countries in which users most often received malicious programs distributed via email did not see much change compared to July:
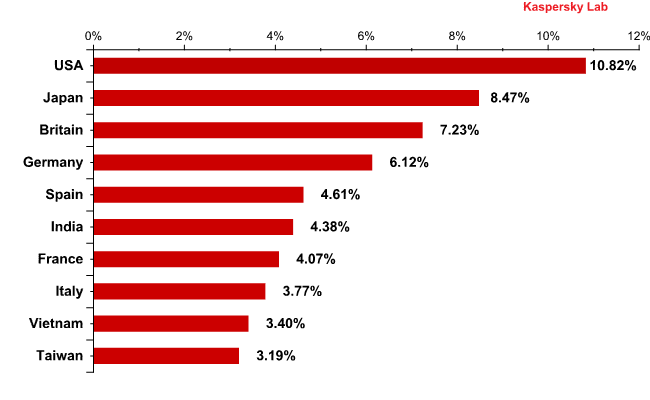
Countries in which users most often received malicious programs distributed via email
The USA and Japan maintained their leading positions, occupying 1st and 2nd places. The amount of malware sent to these countries remained unchanged. Germany’s share decreased slightly, resulting in it dropping down a number of positions in the rating.
The percentage of malware sent to Taiwan was twice less in August than the previous month.
China, which occupied 9th place in July, didn’t appear in August’s Top 10. However, this country remains attractive to fraudsters: the amount of emails with malicious attachments decreased by only 0.5 percentage points.
Spam by category
In August, nearly 90% of all English-language spam fell into just three categories: Medications and Health-Related Goods and Services (40%), Fake Designer Goods (27%) and Fraudulent Spam (20%). The other two categories in the Top 5 being Personal Finance and Computer Fraud, which averaged 4% each.
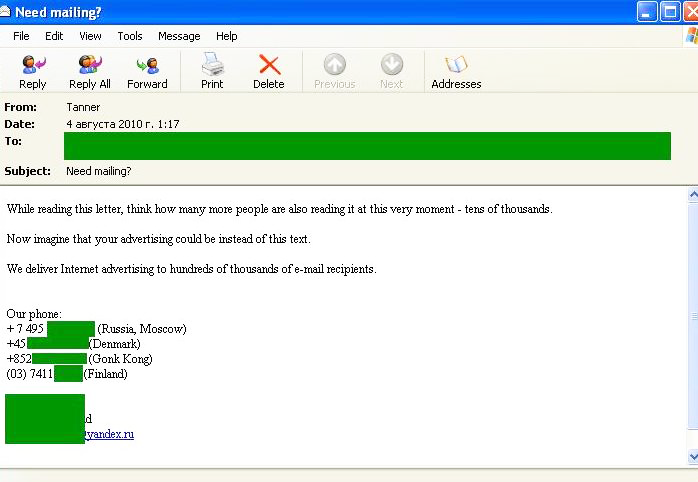
Interestingly, in August we registered an English-language bulk mail that advertised spammer services, which is not typical for the English-language spam category. Even more interesting was the fact that among the contacts offered by spammers was a Moscow telephone number and an email box with a yandex.ru address:
Conclusion
In August, the number of malicious mailings doubled and unfortunately this unpleasant trend remains, contrary to our expectations. Importantly, the majority of these mailings targeted users in the developed countries – the USA, the UK, Germany, France and Italy. For a few months in a row now, these nations have been among the ‘leaders’ in the rating of the countries in which users most often received malicious programs distributed via email.
Additionally, fraudulent spam accounts for the majority of all English-language mailings, which reminds us of the fact that spam is not only irritating, but also dangerous.




Spam Report: August 2010