

Authors
The amount of spam in mail traffic averaged 85.7% in July. A low of 80.9% was recorded on 17 July, while there was a high of 90.8% on 19 July.
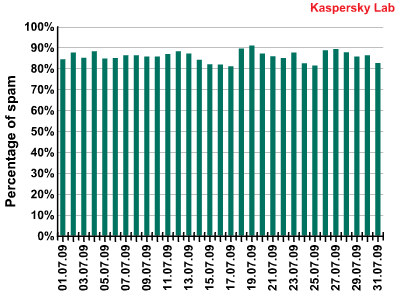
Percentage of spam on the Russian Internet in July 2009
Malicious files were found in 0.11% of emails – a decrease of 0.2% compared to the previous month.
Phishing
Links to phishing sites were found in 1.03% of all emails – an increase of 0.09% compared to June. PayPal (40.19%) and eBay (30.01%) remain the most common phishing targets. July saw several phishing attacks in which spammers included a link to a malicious site in the email attachment and not in the body of the message.

Organizations targeted by phishing attacks in July 2009
English-language spammers used an unusual trick in order to obtain confidential data. They notified users that an unexpectedly large number of addresses had been registered on a particular site and asked each user to confirm that they were a real person by sending the following information: user name, password, date of birth and country of residence.

Sources of spam on the Russian Internet

In July, the US was the leading source of spam – its share increased by 15.79% compared to the first six months of 2009 and averaged 24.9%. In other words, nearly a quarter of all July’s spam was mailed from the US! The make-up of the rest of the top five looks rather familiar: Brazil is second (8.5%) followed by China (5.65%), India (5.5%) and Russia (4.9%). The trend seen in the first six months continued, with the amount of spam from Western European countries decreasing noticeably, leaving them at the bottom of the Top 20. They have been overtaken by a number of Asian countries.
Spam by category
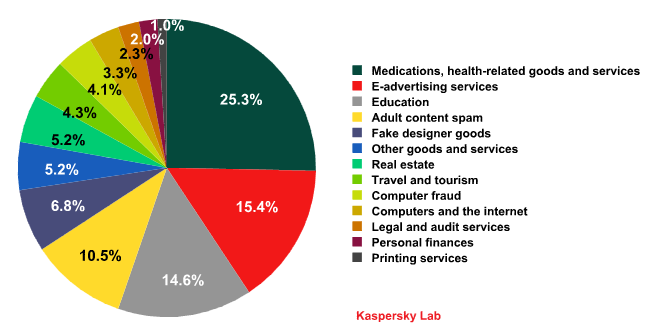
Breakdown of spam categories on the Russian Internet in July 2009
In July, the top spam categories were:
- Medications and health-related goods and services – 25.3% (+4.2%)
- E-advertising services – 15.4 % (+0.2%)
- Education – 14.6% (+0.3%)
- Adult content spam – 10.5% (+4.2%)
- Fake designer goods – 6.8% (+0.9%)
Noticeably, the spammer services ordered by small companies in July amounted to 32.6%, which accounts for just one-third of all mail traffic. The share of the Other goods and services category almost halved in the middle of the summer, falling from 11.7% to 6.5%.
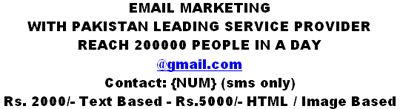
The share of the E-advertising services category remained virtually unchanged. July saw an increase in the number of offers for unsolicited English-language mailings. One company, in an effort to make its services more reliable, announced its cooperation with a provider in Pakistan.
Conclusion
July is the month when the holiday season is at its peak and the number of business transactions slows until autumn. This leads to a lull in spammer activity. Autumn’s trends will most probably be determined in August when spammer activity starts picking up again.
Recent trends
- The volume of spam in mail traffic increased by 1.7% compared to June’s figure and averaged 85.7%
- Links to phishing sites were found in 1.03% of all emails – an increase of 0.09% compared to June
- Malicious files were found in 0.11% of emails – a decrease of 0.2% compared to the previous month
- The amount of spam offering goods and services in the real sector has declined
- In order to bypass filters, spammers provided their contact details in the form of a picture consisting of two random symbols with a number of gaps between them
From the same authors


In the same category


Spam evolution: July 2009