

Recent trends:
- In the first quarter, the percentage of spam in email traffic averaged 85.2%.
- Links to phishing sites were found in 0.57% of all mail traffic.
- Graphical attachments were contained in 11.7% of all spam messages.
- The top three sources of spam included the USA, India and Russia.
- Spammers transferred domains from the .cn zone to the ru zone.
Spam in mail traffic
Spam in mail traffic
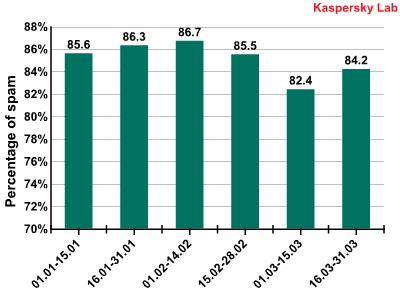
In the first quarter of 2010, the percentage of spam in email traffic averaged 85.2%. This figure coincides with the final result for 2009. The first half of March saw a considerable decrease in the quantity of spam. This might have been caused by the closure of 277 domains belonging to the Waledac spammer botnet at the end of February. However Waledac is not the most active player in the spam market and thus it is probably not the cause of such a noticeable drop in the amount of spam, unlike in the McColo case.
We have already mentioned the formation of the spam market in our previous reports. We can now go on to speak about stabilization in the quantity of spam in mail traffic, which remains practically unchanged, fluctuating somewhere between 84-87%. The downward trend in last year’s mail traffic spam is apparent for this year too, which means the share of this type of spam is close to its maximum figures. A high of 90.8% was recorded on 21 February, with a low of 78% on 5 March.
Sources of spam
Sources of spam by region

Sources of spam by region
Asia remains the leading source of spam, as it was last year (31.7%). Europe is not far behind – with 30.6% of spam being distributed from its territory. If we combine Russia with the rest of Europe, this region would then take the lead with 36.6%.
The quantity of spam distributed from South America has decreased. In the first half of 2009 it reached 15% and came second. Currently South America outputs 10.5%, which was close to its 2008 figure (11%).
At the same time the amount of spam distributed from Eastern Europe has increased (16.4%). It is easy to follow the growth dynamics in the quantity of spam sent out from this region in the first quarter of 2010:
Spam distributed from the territory of Eastern and Central Europe: growth dynamics
Sources of spam by country

Sources of spam
There are no major shifts in the sources of spam rating – no unexpected leaders appeared. The US maintained its position at the top, with India and Russia coming second and third. They were mainly followed by countries from Eastern Asia and Eastern Europe. Almost all of the previous participants remained in the Top 10, merely swapping places.
The situation in Brazil improved significantly: it moved down from third to sixth place. Turkey and China left the Top 10. With China, this may have been caused by a tightening of the government’s domain registration policy. Ukraine and Germany on the other hand, reentered the Top 10 again. In 2008 they were consistently among the ten leading spam distributors, but in 2009 they could not maintain their positions.
It should be noted that the language in which spam is distributed from a certain country often does not reflect the official language of that country. For example, a lot of Russian-language spam comes from India, while Brazil spreads a lot of German-language spam and there is lots of spam coming out of Germany that is in Spanish. This happens because the language of spam is not defined by the geographical localization of the IP. It is defined by the botnet which the computers belong to.
Size of spam emails
Size of spam emails
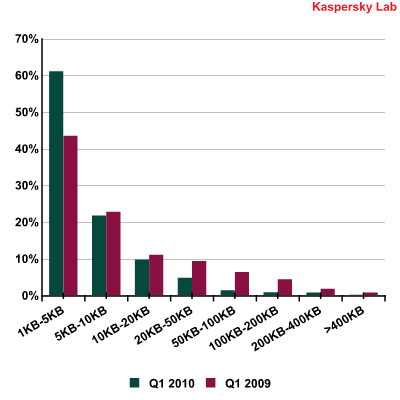
Spammers prefer to send small emails, often not exceeding 1 KB. This can be easily explained by the fact that such emails contain one link only, thus creating difficulties for content-oriented filters in detecting them. Additionally, it takes fewer resources to distribute such “lightweight” emails. Also, the majority of contemporary users immediately delete an email if they see it is spam. That is why spammers try to encapsulate any advertising information into one phrase, so that a user will have time to read it before they press the ‘Delete’ button. In the first quarter of 2010 the share of small emails averaged one third of the total quantity of spam (31.3%). Emails larger than 50 KB in size accounted for only 2.9% of all spam in Q1 2010.
Types of malicious attachments in spam emails
Types of malicious attachments in spam emails
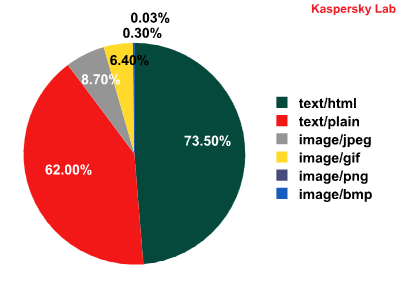
In the first quarter of 2010 the majority of emails contained an HTML attachment. Noticeably, smaller emails with an HTML attachment may contain only a link. Messages with attachments in jpeg format were found in 8.7% of all spam emails and 6.4% for gif format. Some emails contained both a jpeg and a gif element: the content of the message was in jpeg while the unsubscribe form was in gif.
The total quantity of graphical spam (messages with pictures) averaged 11.7% of all spam emails. The majority of messages containing pictures were distributed in February.
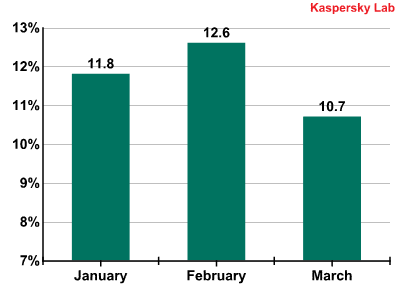
Emails with graphical attachments
Phishing
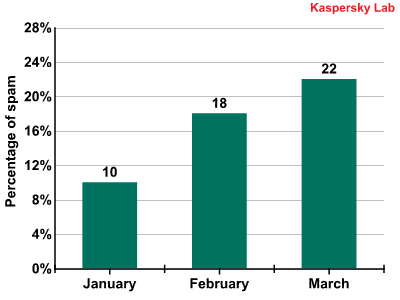
In the first quarter of 2010 links to phishing sites were found in 0.57% of all mail traffic. In January and February the share of phishing emails almost equalled the previous year’s figure, while in March it drastically decreased and averaged only 0.03% of all mail traffic. It’s not easy to explain this fact, but we will watch how the situation develops.
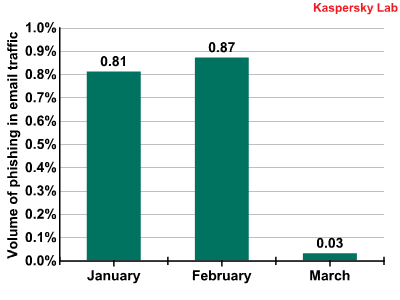
Emails containing links to phishing sites
Once again, the most attractive target for the phishers was PayPal, it being on the receiving end of more than half of all phishing attacks during the first quarter of 2010. Second place, not unexpectedly, fell to eBay with 13.3%.

Top 10 organizations targeted by phishing attacks
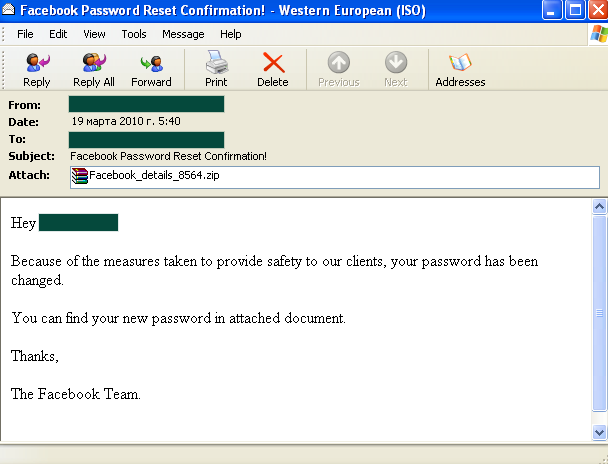
Facebook popped up unexpectedly in fourth place. This was the first time since we started monitoring that attacks on a social networking site have been so prolific. Currently, Facebook is one of the most popular social networking sites with more than 400 million users and their number is constantly growing. Having stolen users’ accounts, the fraudsters can then use them to distribute spam, sending bulk emails to the account owners and their friends in the network. This method of distributing spam allows huge audiences to be reached. Additionally, it lets the fraudsters take advantage of the social networking sites’ additional options, like being able to send different requests, links to photo’s and invitations, all with the advertisement attached, both within the network and to users’ inboxes. Also, while registering accounts users enter their data (for example, an email address) which the spammers can add to their databases.
Interestingly, in March the Russian social network VKontakte took 25th place among the organizations targeted by phishing attacks. This network has exceeded the bounds of the Russian Internet and continues to expand.
Messages with malicious attachments
During the first quarter of 2010 malicious files were found in 0.68% of all mail traffic, a decrease of 0.3 percentage points compared to the last quarter of 2009.
The geographical spread of attempts to infect users’ computers via email can be seen in the graph below:

Computer infection by geography
Over 35% of messages received by users in Germany, the UK, Italy, France and Spain (i.e. the countries of the EU zone) contained malicious attachments. Japan received 7.6% of all infected emails and 13% were sent to other Asian countries, including Taiwan, India and China. Nearly 7% of malicious messages reached their US addressees.
In the first quarter of 2010 the Top 10 most popular malicious files found in mail traffic were as follows:
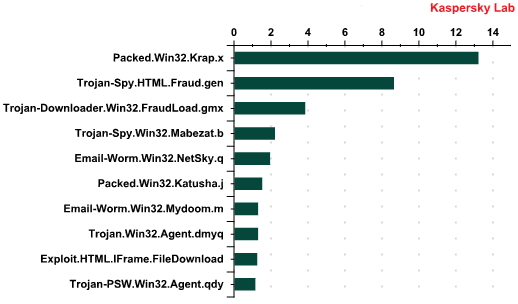
Top 10 most popular malicious files found in mail traffic
First there’s the packer Packed.Win32.Krap.x. In the previous quarter it was fourth in the rating. At the beginning of 2010 Krap.x was found in emails twice as often as at the end of 2009. This is not the only packer in the rating. Packed.Win32.Katusha.j (6th place) is in fact a representative of the new generation of Packed.Win32.Krap.ah, the most widely distributed program in the last quarter.
Generally, Krap.ah (Katusha.j) and Krap.x are used to pack the Trojan spy Zbot and other rogue antivirus programs. In addition Krap.x is a packer for Iksmas, a mail worm with the integrated function of data theft and spam distribution.
Interestingly, more than 55% of all emails with an attachment containing Packed.Win32.Krap.x were sent to developed countries, including 16.7% to Japan, 12.7% to Germany and nearly 8% to the United States.
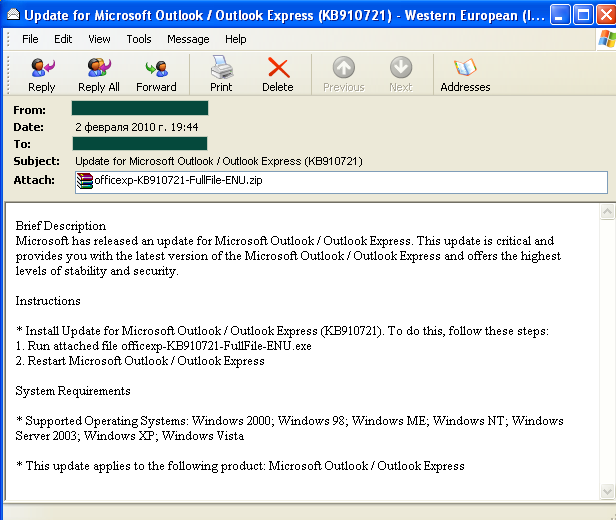
Malicious programs packed with the help of Krap.x were also distributed in emails that offered users the chance to install a Microsoft Outlook update.
Second place in the Top 10 goes to Trojan-Spy.HTML.Fraud.gen. This piece of malware is designed to collect users’ personal and registration data. In January and March 2010 this malicious program led the field in malware distributed via email.
More than 70% of the Trojan-Spy.HTML.Fraud.gen (just as Packed.Win32.Krap.x) malware samples found were found in developed countries, including 39% detected in the UK.
Trojan-Downloader.Win32.FraudLoad.gmx is in third position. This Trojan downloads other malicious programs to a user’s computer, including rogue antivirus programs designed to extort money from its victim. This Trojan was most often received by users whose official language is English – in the UK, the USA, Australia and Canada. More than half of all the Trojan-Downloader.Win32.FraudLoad.gmx samples we detected were from these countries. During March it was especially active in the fake bulk emailing sent on behalf of Facebook.
Migration of spammer domains to the .ru zone
Last year spammers actively used Chinese domains to deploy sites advertising Viagra or containing other types of traditional spammer offers. Spammers distributed huge amounts of spam containing links to such domains. At the end of 2009, the Chinese government tightened their policy concerning domain registration in China. This caused a considerable decrease in the amount of spam containing links to Chinese domains. Unfortunately, the spam itself has not disappeared and spammer domains have migrated from the .cn zone to the .ru zone.
The activities of the authorities in China saw the closure in March of two major Chinese domain registration companies, Go Daddy and Network Solutions. This was caused by the introduction of requirements for some IP address providers to provide Chinese officials with documents and photographs proving their identity.
Conclusion
The beginning of 2010 was rather quiet for the spam industry. The amount of spam in mail traffic stopped growing and during the first quarter of 2010 did not exceed last year’s figures. Taking recent development trends into consideration, we can already speak about the saturation of mail traffic with spam. Analysis proves that the share of spam in mail traffic has been following a parabolic curve over the last 10 years.
At the beginning of 2000, the share of spam doubled every year: 15% in 2001, 30-40% in 2002, 50% by the middle of 2003 and 70-80% by the end of 2003. By the end of 2004 the spam industry had been formed and further growth of its share of mail traffic slowed down: then during 2004-2009 it increased from 75% to 85%. This may also be caused by the appearance of new Internet platforms for spammers, such as blogs and social networks.
Though generally the amount of spam is stable, it ‘migrates’ from region to region. For example, in the first quarter of 2010 the amount of spam originating from Latin America deceased, while more spam was distributed from Central and Eastern Europe.
Spammers do not develop new technologies. They continue to use small messages that can be distributed quickly and in big quantities.
Fraudsters and virus writers actively exploit spam technologies, with virus writers using social networks to distribute their malicious programs.
When at the end of 2009 the Chinese government tightened their domain name registration policy, spam content migrated from the .cn zone to the .ru zone. If law enforcement agencies both in Russia and worldwide were more active in combating this problem, there would be far fewer negative incidents resulting from spam.
From the same authors


In the same category


Spam evolution: January-March 2010