

Authors
Spam in mail traffic
The amount of spam in mail traffic averaged 87.2%. A low of 81.4% was recorded on 20 February, while there was a high of 93% on 22 February.
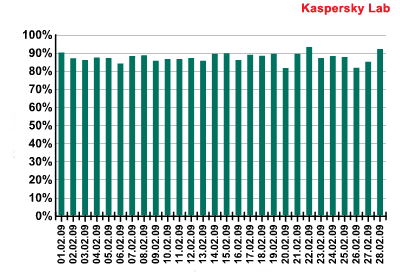
Percentage of spam on the Russian Internet in February 2009
The amount of graphical spam decreased again, accounting for 13% of all spam (compared to January’s 17%).
Malicious programs
The number of emails that contained malicious attachments fell by 0.84% in February and averaged 0.2%.
Emails containing malicious links were notable for their diversity. Throughout February, for instance, there were mass mailings on the Russian Internet offering users the opportunity to download a program that supposedly made it possible to view third-party SMS messages. When users tried to download a trial version, a malicious program that varied from day to day was downloaded to their computers.
February is a month when cybercriminals usually typically exploit Valentine’s Day to distribute malware. The link in the message below led to Email-Worm.Win32.Iksmas.zl.
“I’m burning for you”
Click on the link below to see your greeting card:
This eCard will remove after 12-03-2009 from our servers.
Below is an example of an email that contained two links to Trojan-Downloader.JS.Inor.a, a malicious program which was downloaded to the victim machine and then redirected the browser to web sites advertising medications.

Phishing
Links to phishing sites were present in 0.84% of messages, 0.11% less than January’s figure. The majority of phishing attacks targeted PayPal (39.64%) and eBay (20.58%).
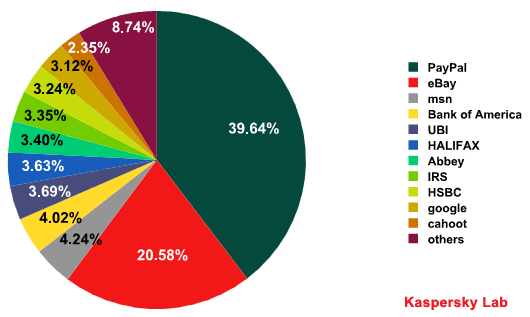
Organizations targeted by phishing attacks
Spam by category

Breakdown of spam categories on the Russian Internet in February 2009
In February, the top five categories were:
- E-advertising services – 15.8% (+3.6%)
- Medications, health-related goods and services – 14.9% (-10.4%)
- Adult content spam – 14.1% (-5.6%)
- Education – 12.7% (+6.2%)
- Real estate – 4.7% (+2.3%)
In these times of economic crisis, the leading spam categories, such as Medications, health-related goods and services, and Adult content spam, have lost ground to other categories, such as Real estate, that have never been in the leading spam categories before. This suggests that spammers’ clients are changing and that spammers are losing some of their long-term clients. The competition between various spammer companies is becoming particularly intense, which is reflected in the fact that advertizing for spammer services (E-advertising services) was the most popular spam category in February. Spammers are not only advertising their own services but doing their best to ensure those adverts are as effective as possible by using the most successful methods and formats of recent years.
The message below offers the email records of UK businesses for mass mailing purposes.

The share of Medications, health-related goods and services spam almost halved in February, falling from 25.3% to an average of 14.9% and accounted for little more than 10% of all spam by the end of the month.
The end of the festive season brought increase in the number of offers for educational programs and seminars, boosting the Education category to 6.2% of all spam.
The Real estate category almost doubled compared to January and entered the top five spam categories. Most offers were for business premises. This is understandable given the state of the economy and the fact that many offices are now standing vacant. This means additional advertising is necessary to find new occupants.
Spammer tricks
Spammers made use of a number of old tricks in February – distorting texts, adding background noise to pictures, links to third-level domains, etc.
Among the more unusual innovations was a mass mailing offering a program that could help the user perfect his/ her written English. The mailing included messages in various languages which all advertized the same product. After clicking on the link, the user ended up on a page advertising the product in the language of the same country as the IP address of his/ her computer. The site itself belonged to the .asia domain, a domain name extension for countries in the Asia-Pacific region and Australia.
Conclusion
The volume of spam in mail traffic remains high and this trend is likely to be continue right up to the summer holiday season. Nevertheless, the economic crisis may well cause some changes within the spam industry, and some of these will be unpredictable. So far, we have seen spammers attempt to make their activity more effective by employing a combination of techniques, expanding the reach of mass mailings and stepping up advertising of their own services. At the moment, spammers are demonstrating increased activity and increasingly sophisticated approaches; users should, as ever, be on their guard.
Recent trends
- The volume of spam in mail traffic increased by 0.5% compared to January and averaged 87.2%
- Graphical spam fell by 4% to 13%.
- Links to phishing sites were found in 0.84% of all emails – a decrease of 0.11% compared to January.
- Malicious files were found in 0.2% of emails – a drop of 0.84% compared to the previous month.
- Malware masqueraded as applications designed to read third-party SMS messages.
- There were several mass mailings of greetings cards which contained links to .exe files.
- E-advertising services claimed top spot among the leading spam categories.
- Real estate entered the top five leading spam categories.
From the same authors


In the same category


Spam evolution: February 2009