

This report analyses trends in the evolution of malicious programs during the first half of 2008, and compares this with data from the second half of 2007.
It is primarily intended for IT security professionals who have an interest in malicious programs, but may also be of use to general readers with an interest in computer virology.
Results for 1H 2008
The first six months of 2008 confirmed the predictions we made at the end of last year about the evolution of malicious programs, namely:
- the continuing evolution of so-called Malware 2.0 technologies
- the evolution of rootkits
- the return of file viruses
- attacks on social networking sites
- threats for mobile devices
One of the most notable malicious programs during the first half of 2008 was, undoubtedly, the Storm worm (classified by Kaspersky Lab as Zhelatin). It remains in the vanguard of Malware 2.0. There were around a dozen significant outbreaks which all used tried and tested methods: mass mailing messages containing links to hacked or specially prepared servers where the body of the worm was located. The same links were placed on social messaging sites or spread via Instant Messenger.
As for rootkits, the problem of “bootkits” (which came to light at the end of 2007) became more of a threat with the appearance of new modifications of Sinowal. Although this program didn’t evolve, it shouldn’t be said that bootkits have ceased to be a problem. Bootkit technologies present some serious challenges for current antivirus technologies, and the current absence of bootkits seems more likely to be a hiatus, rather than virus writers moving away from developing such malicious programs.
In terms of “classic” rootkits, the “mythical” rootkit Rustock.c was finally identified (see https://securelist.com/rustock-and-all-that/36217/ for more details). This event caused some problems for the antivirus industry, not only in terms of detection and disinfection, but also in terms of the methods used to collect and analyse new samples, and the speed of vendor reaction to new threats.
It’s possible to build two chains stemming from the technologies used in Rustock.c – a logical one and a technical one, both of which lead to another two important issues: obfuscation and polymorphism. The “garbage code” implemented in Rustock is designed to hinder to the maximum methods for analysing and combating the rootkit – an approach which has for a long time actively been used in file viruses. And these approaches are being developed, in the main by Chinese virus writers. However, such developments have lead to virus functions being added to a range of backdoors and worms, rather than leading to the creation of new file viruses.
Today’s viruses are not confined to simple file infectors. Rather, they are powerful botnet components designed to steal user data and conduct DDoS attacks. The most obvious examples are Virut, Alman, Allaple, and the Fujack and Autorun worms. During the first half of 2008, these malicious programs caused a multitude of infections around the world, leading us to conclude that virus functionality will continue to be actively added to backdoors and worms in the near future.
Social networks were subject to the biggest attacks in their history. Effectively, these popular networks became a playground for virus and spam technologies, and they’re not only attacked by XSS worms, as was previously the case. Virus writers have moved away from searching for vulnerabilities in the engines of social networking sites – they’re now using tried and tested social engineering approaches, simply learning to send messages from “friends” which contain a link to infected websites. MySpace and Orkut are among the most attacked sites, while Facebook became a target slightly later. Russian users have been attacked by worms and Trojans which spread via Odnoklassniki.ru and Vkontakte.
Mobile threats suddenly changed direction: instead of attacking smartphones, virus writers decided to change their tactics and started to specialize in Trojan programs for J2ME, which are capable of running on almost any mobile phone. These programs (almost 50 were detected) have the same payload: they send SMS messages to premium-rate numbers, emptying the user’s account and putting profits directly into the pockets of the Trojan author.
During the first half of 2008, 440,311 programs were added to our antivirus database, against the 136,953 programs in the previous six months.
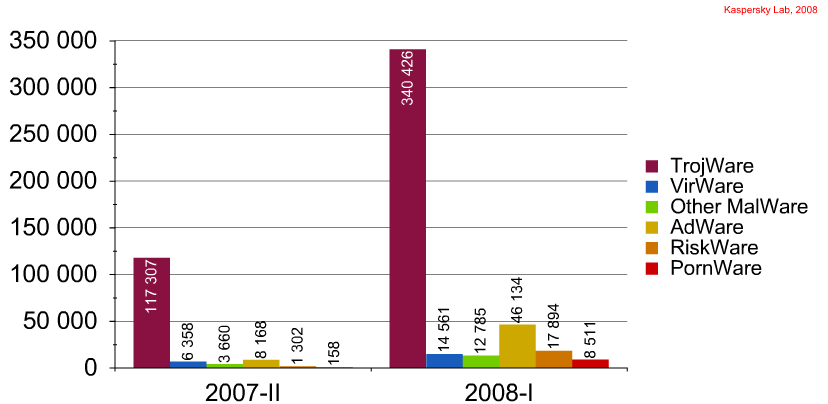
Total number of new programs detecte
(1H 2007 and 2H 2008)
| Programs detected | 2H 2007 | 1H 2008 | 2H 2007% | 1H 2008% | Change | Growth |
| TrojWare | 117307 | 340426 | 85.65% | 77.31% | 8.34% | 190.20% | AdWare | 8168 | 46134 | 5.96% | 10.48% | -4.51% | 464.81% | RiskWare | 1302 | 17894 | 0.95% | 4.06% | -3.11% | 1274.35% | VirWare | 6358 | 14561 | 4.64% | 3.31% | 1.34% | 129.02% | Other MalWare | 3660 | 12785 | 2.67% | 2.90% | -0.23% | 249.32% | PornWare | 158 | 8511 | 0.12% | 1.93% | -1.82% | 5286.71% | All programs detected | 136953 | 440311 | 100.00% | 100.00% |

Distribution of programs detected by class
As the data above shows, the overall number of threats detected in the first half of 2008 tripled in comparison to the previous half year.
The statistics used in this report were generated using the number of records added to the Kaspersky Lab antivirus databases in the first half of 2008. At the moment, there is no single industry standard on how to calculate the number of malicious programs. There are two methods which are mainly used: a count of the number of unique files, and a count of the number of records, or signatures, used to detect malware. Each approach has pluses and minuses. A count of the unique files (e.g. those that have a unique MD5) in an antivirus company’s collection is a good way of calculating the number of threats. (It should be noted that the number of unique files will not be the same as the number of records.) It’s particularly appropriate to use this method at the moment as the vast majority of contemporary threats are Trojans which do not modify their body, and which do not infect other files.
However, it should be stressed that a significant proportion of unique files will be files that have been infected by file viruses e.g. although two or more files may have been infected by the same virus, each file will still have a unique MD5. Installer/ dropper programs also contribute to the number of unique files – although they are not, in themselves, malicious and the files differ from each other, two or more files will still contain the same Trojan program. Script, html files, and office documents also add to the number of unique files, but again, although the individual files may be unique, if the threat is the same, two different files will be detected using the same record.
As mentioned above, the number of signatures will not correspond to the number of unique files. Additionally, this figure will differ from antivirus company to antivirus company due to the difference in technologies and engines used by each company.
However, if analysing data from a single antivirus company, a signature count is the most appropriate method and will accurately reflect the trends in threat evolution.
During the first half of 2008, Kaspersky Lab identified more than 5,000,000 unique files.The 440,000+ records which were added to the antivirus database detect all the threats present in these files, with a relatively even distribution of number of files detected by each record.
Given current trends in the rate at which new malicious programs appear, it seems likely that the number of unique files which contain malicious and potentially unwanted programs will reach 15,000,000 by the end of 2008.
Malicious programs
During the first half of 2008, Kaspersky Lab analysts detected 367772 new malicious programs – 2.9 times more than during the second half of 2007. The average number of new malicious programs detected each month was 61295,33
Overall, the number of new programs increased by 188.85%. This growth rate significantly exceeds that of 2007, when 114% more malicious programs were detected than in 2006.
The Kaspersky Lab classification divides malicious programs into three classes:
- TrojWare: Trojan programs which are unable to propagate independently (e.g. backdoor programs, rootkits and all types of Trojan)
- VirWare: malicious programs which are capable of propagating independently (viruses and worms)
- Other MalWare: programs used maliciously to create threats and conduct attacks
2008 did not bring any significant changes in the ratio between classes of malicious programs. The TrojWare class is still the absolute leader, making up more than 92% of all malicious programs. The number of new Trojan programs detected in the first half of 2009 increased by 190.2% in comparison with the previous half year. However, the percentage of TrojWare programs among all malicious programs changed by a mere 0.43%, which is significantly less than the increase of over 2% in 2007.
There has been a change in the trends shown over the last two years, when the share of various Trojan programs increased, while the figures for VirWare and Other MalWare decreased. During the first half of 2008, the share of the Other MalWare class increased. Incidentally, the increase (of more than 0.5%) exceeded the same figure for the dominant TrojWare class.

Distribution of malicious programs by class

Number of malicous programs detected Jan – Jun 2008 by class
| Total | 2008 | 2007 | Share 2008 | Share 07 | Change | Growth |
| TrojWare | 340426 | 117307 | 92.56% | 92.13% | 0.43% | 190.20% | VirWare | 14561 | 6358 | 3.96% | 4.99% | -1.03% | 129.02% | Other MalWare | 12785 | 3660 | 3.48% | 2.87% | 0.60% | 249.32% | Malicious | 367772 | 127325 | 100 | 100 | 188.85% |
A year ago – back in summer 2007 – programs in the Other MalWare class made up 1.95% of all malicious programs. This figure started to increase in the second half of 2007 (2.87%) and retained this upward trend during the first half of 2008. Overall, during this half year period, the class Other MalWare reached 3.48%. Taking into account the fact that the number of new programs in this class increased 3.5 times in comparison with the figures from the second half of 2007, the figures provide evidence of a steady increase in the number of a variety of “non-classic” threats.
The number of new programs in the Other MalWare class rose by almost 250%, putting this class almost on a par with VirWare. Over the course of the half year, only 1776 fewer programs were detected in the Other MalWare class than in the VirWare class. By the end of the year, if these growth trends are maintained in both classes, Other MalWare may well be in second place in terms of the number of malicious programs per class.
There were additional factors which influenced the increase in the number of programs in the Other MalWare class: the appearance of a large number of new exploits and the significant expansion of malicious behaviors to include those previously not regarded as malicious e.g. FraudTool. Such behaviors were added to the antivirus databases in the first half year of 2008.
A similar slow down in the growth of VirWare, which began five years ago, has led to the viruses and worms which were dominant at that time almost ceasing to evolve. The decrease in the percentage of VirWare continued in 2008: data for the first six months of the year for programs of this class made up less than 4% of all malicious programs – 1.03% less than in the second half of 2007. Additionally, the rate of decline for VirWare exceeded that of the previous year. The increase in the number of new viruses and worms is significantly slower that the increases shown in the other classes: there were 129% more programs in the VirWare class than in the previous half year. Overall, the distribution of malicious programs among the classes has entered a stable period. Objective reasons for this are both the dominance of Trojan programs, and the change in attack vectors and targets, a shift which has already been noted.
Below is a more detailed look at the changes taking place within each class.
Trojan programs
The graph below shows the number of new Trojan programs detected each month by Kaspersky Lab analysts:

Number of new TrojWare programs detected by Kaspersky Lab analysts each month (July 2007 – June 2008)
In the second half of 2007, the number of new Trojan programs detected each month began to decrease. However, the number began to increase at the start of 2008, and by the end of the half year made up 190.2%. Three peaks were noted during the first six months of 2008: in January, March, and May. Each peak was either followed by a small drop or a period of stability, followed by another active increase in the number of new Trojan programs. This picture does, in part, repeat the trends of 2007 when two peaks were observed in May and August, followed by a corresponding decrease. The situation described above is completely different to the situation in 2006 when the number of new Trojan programs increased constantly.
It seems likely that the aggressive increase in the number of Trojan programs will continue in the near future. However, this growth is not accompanied by a corresponding evolution in the sophistication of the technologies used. The vast majority of Trojan programs are still extremely primitive creations written by poorly educated script-kiddies, and an increase in the number of such programs is caused exclusively by the availability of Trojan programs on the black market, and also the relative ease of spreading such programs.
The most significant change in the distribution of behaviors within this class is that of the Trojan behavior (i.e. programs which are classified as ‘Trojan’, rather than, for example, ‘Trojan-Dropper’) which rose from fifth place to third place, and is now one of the leading behaviors.

Distribution of Trojan programs by behavior
In order to better understand the changes which have taken place in this class, let’s take a look at the increase in the various behaviors exhibited by malicious programs.

Number of new Trojan programs by behavior

Growth in number of new malicious programs in the TrojWare class
| TrojWare | 1H 2008 | 2H 2008 | Growth | Share in 2008 | Share in 2007 | Change |
| Backdoor | 100864 | 39566 | 154.90% | 29.63% | 33.73% | -4.1% | Trojan-Downloader | 66517 | 25689 | 158.9% | 19.54% | 21.9% | -2.36% | Trojan | 61452 | 10451 | 488% | 18.05% | 8.91% | 9.142% | Trojan-PSW | 59973 | 23835 | 151.6% | 17.62% | 20.32% | -2.701% | Trojan-Spy | 22823 | 11914 | 91.6% | 6.7% | 10.16% | -3.452% | Trojan-Dropper | 19994 | 2620 | 663.1% | 5.87% | 2.23% | 3.64% | Trojan-Clicker | 4089 | 1168 | 250.1% | 1.2% | 1% | 0.205% | Trojan-Proxy | 2540 | 1428 | 77.9% | 0.75% | 1.22% | -0.471% | Rootkit | 1917 | 554 | 246% | 0.56% | 0.47% | 0.091% | Trojan-DDOS | 117 | 45 | 160% | 0.03% | 0.04% | -0.004% | Trojan-SMS | 47 | 9 | 422.2% | 0.01% | 0.01% | 0.006% | Trojan-IM | 40 | 8 | 400% | 0.01% | 0.01% | 0.005% | Trojan-AOL | 22 | 5 | 340% | 0.01% | 0.004% | 0.002% | Trojan-Mailfinder | 14 | 0 | 0.004% | 0% | 0.004% | Trojan-Notifier | 13 | 11 | 18.2% | 0.004% | 0.009% | -0.006% | Trojan-ArcBomb | 3 | 4 | -25% | 0.0010% | 0.003% | -0.003% | Trojan-Ransom | 1 | 0 | 0.0003% | 0.000% | 0.000% | Total TrojWare | 340426 | 117307 | 190.2% |
The following behaviors showed the most impressive (i.e. 200%+) growth in the first six months of 2008: Trojan-Dropper, Trojan, Trojan-Clicker and Rootkit. (The figures for the Trojan-AOL, Trojan-IM, and Trojan-SMS behaviors are not taken into account as the number of such programs is very small.)
The Trojan-Dropper behavior shows far more impressive results, with a growth of more than 660% – a record for all Trojans over the last few years. The increase in the number of malicious programs which exhibit this behavior is caused by more and more virus writers starting to use the tactic of hiding Trojan files within other program distributives to ensure that the maximum number of different Trojans will be installed on a victim machine simultaneously. This situation is due to the fact that in the cybercrime world, it’s dedicated groups that are responsible for spreading malicious programs, rather than the authors of the programs or the clients who buy them.
These reasons also, presumably, have an influence on the figures shown by Trojan-Downloader programs. This behavior, which was the most widespread behavior in 2006 came second last year to the Backdoor behavior. In the first half year of 2008, the Trojan-Downloader behavior was able to retain second place (overtaking Trojan programs by a mere 1%); however, this was accompanied by a continued decreased in the number of downloader programs among all Trojan programs (- 2.4%).
The increase in the number of “ordinary” Trojans – by 488% – is interesting. Previously, programs exhibiting Trojan behavior was somewhat second rank, and there were no reasons to suppose there would be any significant increase in this behavior. What has happened with the Trojan behavior in the first half of 2008 is, to a great extent, caused by the striving of virus writers towards universal Trojan code. More often than not, they choose not to create several modules which work in conjunction with each other, but rather implement all functions within the framework of a single application. This approach is the reaction of malicious users to increasingly effective antivirus technologies – it’s far easier to extend the time period between the release of a malicious program and that program being added to antivirus databases for a single program, than for several programs.
The growing popularity of Trojan-Clicker programs is caused by cybercriminals being attracted to one of the ways in which money can be made illegally on the Internet e.g. payment for ‘clicks’ on advertising links, and “increasing” the rating of certain sites. This type of scam has been in existence for a while now; however, prior to 2008, virus writers did not appear to pay much attention to it. In 2008 the situation changed, and the result is that during the six months under scrutiny, 250% more new Trojan-Clicker programs were detected than during the previous six month period.
As for rootkits, in spite of significant growth (246%), the change in the number of such programs in relation to all Trojan programs was insignificant – a mere +0.9%.
In June 2008, Kaspersky Lab placed several families of malicious programs (the behavior of which differed from current behaviors) into two new behavioral categories: Trojan-Mailfinder and Trojan-Ransom.
The main function of programs classified as having Trojan-Mailfinder behavior is to harvest email addresses from victim machines in order for them to be added to spammer databases. This behavior is made up both of a range of Trojan programs and a number of programs which were previously classified as having SpamTool behavior and placed in the Other MalWare class.
Although programs classified as Trojan-Ransom are relatively few in number, they still pose a serious threat. This behavior covers all malicious programs which adversely affect operating system performance in some way, and encrypt user files in order to demand money from the user in return for the files being restored.
In July 2008 another two behaviors were added to the Kaspersky Lab classification: Trojan-Banker and Trojan-GameThief.
The Trojan-Banker behavior covers all Trojan programs which are designed to gain illegal access to online banking and credit card accounts. Previously such programs were classified, in the main, as Trojan-Spy or Trojan-PSW.
Trojan-GameThief is designed to cover the wide variety of Trojans which are designed to steal user data for popular online games. It should be stressed that last year these “gaming” Trojans became the most common type of malicious program. Several families, previously classified as Trojan-Spy and Trojan-PSW will now be classified as Trojan-GameThief.
Creating these new behaviors within the classification should have a noticeable effect on the distribution of Trojan programs by behavior. The results will be included in our next report: Malware Evolution 2008.
At the moment, the TrojWare class broadly covers three behavioral groups:
- Backdoor, Trojan-Downloader, Trojan, Trojan-PSW
These are the most common type of Trojan program, making up approximately 85% of the entire TrojWare class (each behavior has a more than 17% share of the class)
Over the course of the half year, the Trojan behavior broke into the group of leaders, with a 9% increase in its share of all Trojan programs. It should be noted that out of the four behaviors in the first group, only the Trojan behavior increased its share, while the figures for the other behaviors decreased (e.g. the share held by Backdoor programs fell by more than 4%)It’s likely that this group will show rapid growth (of more than 150%) in the second half of 2008. The share held by the Trojan behavior will continue to increase, as will the decrease in Trojan-Downloader and Trojan-PSW programs. Backdoor programs will remain the most common type of malicious program, in the main due to the efforts of Chinese virus writers.
- Trojan-Spy and Trojan-Dropper
In the first six months of 2008 Trojan behavior moved from the second group into the first group, and Trojan-Dropper rose from the third group to replace it. The figures for the behaviors in the second group are approximately 5 – 7%. The growth rates for the Trojan-Spy and Trojan-Dropper programs differ significantly (remember that Trojan-Dropper programs have set a record with a growth of 663.1%).During the second half of 2008, the proportion of Trojan-Dropper programs among all Trojan programs is likely to continue to increase, bringing the figures for this behavior close to that of the first group. It is likely that the recently defined behaviors Trojan-Banker and Trojan-GameThief will join the second group.
- Trojan-Proxy, Trojan-Clicker, Other
Each behavior accounts for less than 1.2% of the group. With the exception of the Trojan-Clicker behavior, the growth rates of all the behaviors in this group are insignificant.An increase in the number of programs which exhibit any specific behavior to the same level as the second group (Trojan-Clicker) can’t be excluded. However, it’s far more likely that the number of malicious programs in this group will continue to decline as they are squeezed out by programs from the first group.
Of the third group, Trojan-SMS programs are of particular interest. In the first half of 2008, the number of these programs rose by 422% and approached 50 in total. Of course, in comparison to more than 100,000 new backdoor programs, this is a very modest figure; however, Trojan-SMS programs differ from all other malicious programs in that they run on mobile phones, making them probably the most real threat to mobile devices.
Mobile malware: the start of criminalization
The first half of 2008 was interesting from a mobile malware point of view, and specifically, the evolution of Trojan programs which stealthily send SMS messages to short premium numbers.
Regarding this, it’s worth stressing the following points:
- An increase in the number of malicious programs with Trojan-SMS behavior.
- The cross-platform nature of mobile Trojans – any mobile phone which supports Java applications or has a Python interpreter is under threat.
- The increase in the number of WAP sites where such Trojan programs are placed.
- The appearance of ICQ spam which advertises WAP sites and the malicious programs located on these sites.
- The variety of social engineering methods used to spread and disguise malicious programs.
- The identification of short numbers to which short messages are secretly sent.
We’ll take a closer look at these and other trends below.
Let’s start with the increase in the number of malicious programs with Trojan-SMS behavior. During the first half of 2008, more of these programs were detected than since the first such program was detected (which was Trojan-SMS.J2ME.RedBrowser.a, detected on 27th February 2006).

Number of new Trojan-SMS programs detected by Kaspersky Lab analysts in 2008
During the first six months of 2008, 422% more new Trojan-SMS programs were detected than during the second six months of 2007.
There are currently nine families of malicious program which target the J2ME platform, three which target Symbian and one which targets Python.
So what exactly are these Trojans? They are essentially relatively primitive creations.
In the case of J2ME Trojans, then the vast majority of them have the following structure: a jar archive which contains several class files. One of these files sends an SMS message to a short number (naturally, the user is not asked whether such a message should be sent, and the user is not informed of how much it costs to send such a message). The other class files are simply there to disguise the malicious program. The archive may contain a number of images (in the vast majority of cases, these will be erotic ones) and also a manifest file, which in some cases is also used by the malicious program to send messages.
In the case of the Trojan-SMS.Python.Flocker family, its primitive nature and payload are essentially the same – it’s only the platform which is different. The main script responsible for sending SMS messages to a short premium-rate number is written in Python and located in a sis archive, which also contains additional scripts designed to mask the activity of the malicious program.
One of the reasons Trojan-SMS programs are a threat is their cross platform nature. If the phone (and this applies to phones which are not smartphones) has an integrated Java machine, Trojan-SMS.J2ME will be able to function on the device without any problems. As for Trojan-SMS.Python, the cross platform factor affects smartphones running Symbian. If the phone (which can be running any version of the OS) includes a Python interpreter, then Trojan-SMS.Python is able to function.
The method most commonly used (only a few are used) to spread such malicious programs are WAP portals, which offer the user the opportunity to download ringtones, pictures, games and other applications for their mobile. The vast majority of Trojan programs are disguised either as applications which can be used to send SMS messages free of charge, and use the Internet free of charge, or applications of an erotic/ pornographic nature.
Sometimes virus writers come up with original ways of disguising the malicious payload of their creations. For instance, once a user has launched Trojan-SMS.J2ME.Swapi.g, a message appears on the phone inviting the user to look at a pornographic image. In order to do this, the user has to press “DA” (“Yes”) while a short tune is playing. (The program’s jar archive contains both a png file and a midi music file.) In attempting to press the button in time, the user is distracted and doesn’t guess that each time the button is pressed (either while the music is playing or not) leads to an SMS message being sent to a short number, and a charge being made for each message that is sent.
Nearly all sites which have malicious programs located on them offer the user the option to upload his/ her files to the site. Registration is simple – just a couple of clicks – and free access make it possible for virus writers to spread their primitive creations without any difficulty. They simply have to give their file the most attractive name possible (e.g. free_gprs_internet, otpravka_sms_besplatno [send_sms_free], goloya_devushka [naked_girl] etc., write a few enticing lines describing the program and then wait for a user to decide to s/he wants to send free SMS messages or look at erotic pictures.
Once malware has been placed on the site, of course it has to be advertised in some way. And this is where mass mailing links by ICQ or spamming forums comes in. Why ICQ? This IM client is very popular in Russian and CIS countries, and a lot of users who want to be in constant touch use mobile ICQ clients. Of course, for a malicious user, these people are potential victims.
This leads to the creation of an interesting chain: a malicious program is created → it’s placed on a WAP site with an enticing name and description → a mass mailing is conducted which may reach users of mobile ICQ clients.
There’s only one question still to be examined – that of the short numbers used by mobile Trojans. Three numbers – 1171, 1161, 3649 – seem to be the most widely used by all the malicious programs detected by Kaspersky Lab. These numbers are not only used by malicious users but also by a number of legitimate companies which offer a range of services. Payment from SMS messages is assigned according to the prefix with which the SMS is sent. These prefixes change in different Trojan-SMS programs, but do occasionally repeat.
This type of cybercrime has become popular, particularly in Russia, due to the extremely simple method of making SMS payments.
Mobile operators offer short numbers for lease. It would be very expensive for a private person to lease such a number, but there are content providers who lease these numbers, then sub-lease them, having added a specific prefix to them.
For instance, the short number 1171 belongs to a provider, but if a message which begins with “S1” is sent to 1171, the provider’s system transfers part of the cost of the SMS to the account of the person sub-leasing it.
The mobile operator keeps between 45% and 49% of the cost of an SMS sent to a short number, and the provider leasing the number gets approximately 10%. The remaining sum is transferred to the sub-leaser – in this case, the malicious scammer.
To sum up: the first half of 2008 has been the first period to show significant growth in malicious programs for mobile phones which send SMS messages to short premium rate numbers without the knowledge of the phone’s owner. It’s clear that these programs have been created with one aim in mind: to make money using short numbers, or more precisely, the SMS messages which are secretly sent to these numbers. As these programs are simple to create and spread, this is likely to lead to a continued increase in the number of malicious programs with Trojan-SMS behavior in the second half of 2008. We will continue to track the situation.
Gaming Trojans: the game continues
One of the marked trends last year was the explosive increase in the number of new malicious programs which are designed to steal online gaming passwords. This trend continued in the first half of 2008, with 49094 new gaming Trojans being detected during the period. This is one and a half times more than the number of similar Trojans which were detected during the whole of 2007 and exceeds the figures for the previous half year by 264.6%.

Number of new Trojan programs which steal passwords to online games detected by Kaspersky Lab analysts

Number of new gaming Trojans detected by Kaspersky Lab analysts
(July 2007- June 2008)
95% of the new gaming Trojans detected during the first half of 2008 steal passwords to more than one online game. Such Trojans include programs from the Trojan-PSW.Win32.OnLineGames and Trojan-PSW.Win32.Magania families.
The OnLineGames family is the most numerous with 57.6% of all gaming Trojans belonging to this family. The number of malicious programs in this family increased significantly during the first six months of 2008, overtaking by some margin the increase in the number of Trojans which steal passwords to a single online game.
Trojan programs from the Magania family are interesting in that they target the users of a single popular portal (http://en.wikipedia.org/wiki.Gamania). Although the popularity of this family started to drop rapidly in May due to several online worlds on the portal having been closed (including MapleStory), nevertheless, this family still made up 37.4% of all new gaming Trojans by the end of the half year.

Number of new malicious programs from the most common gaming Trojan families
(by month, 2008)
Trojan-PSW.Win32.OnLineGames – steals passwords to several games
Trojan-PSW.Win32.Magania – attacks Gamania online gaming portal
Trojan-PSW.Win32.Ganhame – attacks Hangame Online
Trojan-PSW.Win32.Lmir – Legend of Mir
Trojan-PSW.Win32.Nilage – Lineage
Trojan-PSW.Win32.WOW – World of Warcraft
The popularity of online games among virus writers is directly dependent on the popularity of such games among gamers and how developed the market for a specific game’s virtual assets is. The lion’s share of gaming Trojans which are designed to steal passwords to a single game target four games: Legend of Mir and Hangame, which are popular in China, and Lineage and World of Warcraft which are played throughout the world.

Distribution of most common gaming Trojans which target a single game
As the diagram above shows, the largest share of Trojan programs are designed to steal passwords to Lineage. According to statistics on www.mmogchart.com (see below), Lineage, which was one of the first online games to appear on the Internet back in 1999, led in terms of the number of subscribers over a four year period. Currently, Lineage has the most developed economy of all online games and a fully developed market for virtual assets, which are sold for real money.
World of Warcraft, which currently leads the online gaming market, is second in terms of popularity among virus writers. However, it’s this game which holds the monthly record for the number of new Trojans. In May 209 Trojans which target World of Warcraft players were detected – between 6 and 7 new Trojans per day.

Distribution of online game subscribers
Source : mmogchart.com
During the first half of 2008, the main method used for spreading malicious programs which steal passwords to online games changed. In 2007, malicious users preferred to use self-propagating programs (worms and viruses) to spread their creations. Now the most popular method for delivering gaming Trojans to users’ computers is the mass hacking of web sites (for instance, using SQL injection) and using exploits to download Trojans to the computers used to view these sites.
This propagation method seems to have been fairly successful. However, the majority of attacks are not targeted: a gaming Trojan can infect anyone visiting the hacked site, not just those who play online games. Malicious users decided to capitalize on their success and extended the functionality of gaming Trojans in the first half of 2008 by adding backdoor modules to gaming Trojans, making it possible to unite infected computers in a zombie network.
Such developments show that the criminal business connected with stealing online game characters and virtual gaming assets continued to evolve in the first half of 2008. Kaspersky Lab detected, on average, 273 new gaming Trojans, of which 259 were capable of stealing passwords to more than one online game. Trojan-PSW.Win32.OnLineGames comes in second place among all the families which make up the TrojWare class, being overtaken only by Backdoor.Win32.Hupigon.
Virus writers have optimized the attack scheme which they previously used. They have started using hacked sites to spread their creations, and while Trojans designed to steal online game passwords previously posed a threat only to the players of such games, now they pose a threat to all users, as the vast majority of gaming Trojans which have been detected over the last few months are equipped with a backdoor function.
The evolution of gaming malware will continue in the near future.
Worms and viruses
VirWare displayed the slowest growth rate out of the three classes of malicious program – “only” 129%. However, even such modest figures mean, in practice, more than 2,000 new viruses and worms a month.
The figure below shows the number of new programs in the VirWare category detected by Kaspersky Lab analysts each month.

Number of new VirWare programs detected by Kaspersky Lab analysts each month (July 2007 – June 2008)
At first glance, the increase in the number of new malicious programs in this class seems very similar to that of the TrojWare class, with similar rises and subsequent falls. However, there were two such peaks for the VirWare class during the first half of 2008, while TrojWare had three. This shows that this class of malicious programs exists and evolves in accordance with its own rules. The relatively slow growth of 129% of the VirWare class demonstrates how viruses and worms differ from the other classes. During the first half of 2008, this led to yet another fall in the share of such programs by more than 1%.
If this trend continues in the second half of 2008, it may be that this class will slide down to third place, with Other MalWare taking second place.
There was significant movement within the VirWare class during the period under examination. The figure below shows the distribution of behaviors within the VirWare class.

Distribution of behaviors in the VirWare class
In order to understand the changes which took place within the class better, let’s take a look at the increase in the number of malicious programs of various behaviors.

Number of new programs in the VirWare class

Growth in number of new malicious programs in the VirWare class
| VirWare | 1H 2008 | 2H 2007 | Growth | 2008% | “+/-” |
| Worm | 6386 | 1413 | 351.95% | 43.857% | 21.63% | Net-Worm | 3393 | 258 | 1215.12% | 23.302% | 19.24% | Email-Worm | 2757 | 1629 | 69.24% | 18.934% | -6.69% | IM-Worm | 755 | 431 | 75.17% | 5.185% | -1.59% | Virus | 666 | 2468 | -73.01% | 4.574% | -34.24% | P2P-Worm | 516 | 126 | 309.52% | 3.544% | 1.56% | IRC-Worm | 88 | 33 | 166.67% | 0.604% | 0.09% | Total | 14561 | 6358 | 129.02% | 100% |
The biggest changes in the VirWare class related to classic file viruses, and it’s difficult to explain the changes that took place in the first half of 2008. In 2007, viruses were leaders in terms of growth rates (390%) among all malicious programs and ended the last half year in first place in the VirWare category with a figure of 38.8%. In the first half of 2008, viruses showed a negative increase (-73%) and by the end of the period under investigation, their share was only slightly more than 4.5%.
We expected the number of more sophisticated viruses, and the continued evolution of polymorphic technologies to increase. However, it seems that cyber criminals are heavily involved in writing Trojans and do not have sufficient technical knowledge to implement virus technologies. This is, unquestionably, a good sign for the antivirus industry.
Programs which exhibit Worm behavior have a clear lead. The growth rate of such programs (352%) lead to such programs doubling their share of programs in the VirWare class and to take first place with a figure of close to 44%. Removing such worms, which spread via removable storage media and via local networks, from users’ computers is a very hard task.
It was Net-Worm programs which showed the most rapid increase during the first half year of 2008. In fact the increase of more than 1200% on the previous half year was unprecendented. This behavior, which disappeared in 2007, suddenly reappeared in second place. The reason for this dramatic increase clearly has its roots in the continuing evolution of Worm programs, which are currently moving to a new stage in their development. Their authors are trying to get to grips with new ways of spreading their creations and are starting to use old methods at a new level. Given the absence of critical vulnerabilities (which were used by worms such as Lovesan and Sasser in the past), modern network worms are more and more frequently using hacked web sites and social networking sites to spread.
The steady rise in Email-Worm programs over the last few years continued in 2008, but was none the less not large enough to allow such programs to move into second place. In the first half of the year, Email-Worm programs increased in number by 6.7%, taking third place with a figure of 19%. None the less, this means that every fifth program in the VirWare class is a worm which spreads via email. It is three email worm families – Warezov, Zhelatin and Bagle – which are, in the main, responsible for this growth, as they were in 2007.
There are two broad groups of behavior in the VirWare class:
- Email-Worm, Worm, Net-Worm
Each behavior makes up more than 18% of all programs in the VirWare class. Email-Worm programs, which previously led the class, are currently at a plateau stage, while Worm and Net-Worm programs have exhibited explosive growth.
- IM-Worm, Virus, P2P-Worm, IRC-Worm
Each behavior makes up less than 6% of all VirWare. The growth rates differ markedly, ranging from negative growth to more than 300% (on a par with the leaders). However, only the Virus behavior is likely to significantly increase its share, as the others depend on second level Internet services (IM, IRC, P2P).
Other malicious programs
Programs in this class are the least common in terms of number of programs detected. However, this class has the largest number of behaviors.
It’s extremely difficult to make any predictions regarding the number of malicious programs in the Other MalWare class: there was weak growth within this class in 2004-2005, a small drop in 2006, and a growth of 27% in 2007. However, the class grew by 249.3% on the previous half year during the first six months of 2008.

Number of new programs in the Other Malware class detected by Kaspersky Lab analysts (July 2007 – June 2008)
The distribution in behaviors in the Other MalWare class is shown in the figure below,

Distribution of programs in the Other MalWare class by behavior
In order to better understand the changes which have taken place in this class, let’s take a look at how individual behaviors have increased in number:

Number of new programs in the Other MalWare class

Growth in the number of new malicious programs in the Other MalWare class
| MalWare | 1H 2008 | 2H 2007 | Growth | 2008% | “+/-” |
| Hoax | 3371 | 1085 | 210.69% | 26.367% | -3.28% | FraudTool | 3339 | 387 | 762.79% | 26.117% | 15.54% | Exploit | 1975 | 711 | 177.78% | 15.448% | -3.98% | HackTool | 1377 | 306 | 350% | 10.77% | 2.41% | Constructor | 731 | 292 | 150.34% | 5.718% | -2.26% | Packed | 509 | 403 | 26.30% | 3.981% | -7.03% | SpamTool | 431 | 184 | 134.24% | 3.371% | -1.66% | IM-Flooder | 287 | 55 | 421.82% | 2.245% | 0.74% | Flooder | 196 | 51 | 284.31% | 1.533% | 0.14% | BadJoke | 174 | 69 | 152.17% | 1.361% | -0.52% | VirTool | 153 | 50 | 206% | 1.197% | -0.17% | Email-Flooder | 77 | 8 | 862.5% | 0.602% | 0.38% | DoS | 75 | 37 | 102.7% | 0.587% | -0.42% | Spoofer | 36 | 6 | 500% | 0.282% | 0.12% | Sniffer | 24 | 10 | 140% | 0.188% | -0.09% | SMS-Flooder | 15 | 4 | 275% | 0.117% | 0.01% | Nuker | 15 | 2 | 650% | 0.117% | 0.06% | Total | 12785 | 3660 | 249.32% | 100% |
Hoax continues to be the most common behavior in this class, exhibiting significant growth for the third year in a row: from 150% to 286%. None the less, this behavior’s share of the OtherMalWare class dropped by more than 3% during the first six months of 2008.
The Exploit behavior, which once showed the highest figures, continues to lose position. In spite of an increase of 178%, it was not able to retain second place. It is currently in third place, making up 15.5% of the OtherMalWare class.
Packed and FraudTool, two new behaviors which were added to the classification in 2007, differ in terms of their movement within the class.
Packed, which exhibited significant gains last year, came to something of a standstill (26%) in the first half of 2008. This led to a decrease of more than 7% of the share of Packed programs in the OtherMalware class.
FraudTool, on the other hand, is effectively a class leader, together with Hoax. This is due to an increase of more than 760% in such programs, as virus writers continue to actively use them. The main type of FraudTool program is so-called “rogue antivirus” programs, which come in the guise of fully-functional antivirus solutions. When such programs are installed on a computer, they will inevitably “detect” some sort of virus (even if the machine is absolutely clean) and advise the user to pay for a version of the program to disinfect the system. In addition to scamming users, such programs also have adware functionality.
Potentially unwanted programs
We started including potentially unwanted programs (PUPS) in our reports last year. These are programs which are developed and distributed by legitimate companies, but have functions which make it possible for them to be used malicious. These programs cannot be categorically classified either as threats or as harmless programs: it all depends on how they are used.
There are three classes of program which Kaspersky Lab classifies as potentially unwanted:
- AdWare: these are programs designed to show advertising, redirect search requests to advertising sites, and also to collect marketing data (for instance, which sites a user visits).
- RiskWare: these are legitimate programs which can be used malicious to target a user’s system and his/ her data (e.g. destroying, blocking, modifying or copying information, adversely affecting computer or network performance).
- PornWare: these are utilities designed to show pornography in one form or another (this class only contains three behaviors: Porn-Tool, Porn-Dialer and Porn-Downloader).
AdWare
This class is the most stable – for the second year in a row, AdWare programs have exhibited growth rate figures of 450%. The number of new samples each month is approaching 8,000, putting AdWare programs in second place among all programs detected by Kaspersky Anti-Virus.
The figure below shows the number of new AdWare programs detected by Kaspersky Lab analysts each month.

Number of new AdWare programs detected by Kaspersky Lab analysts
(July 2007 – June 2008)
| AdWare | 1H 2008 | 2H 2007 | Growth | AdWare | 46134 | 8168 | 464.81% |
The graph aboves shows the sharp increase in such programs starting at the beginning of 2008. It should be stressed that the efforts of law enforcement bodies around the world directed at making such programs illegal, and attempts to legitimize them have not, so far, been successful. It’s true that many AdWare developers have modified the functions and behavior of their products and this is, in part, due to the increase in the number of AdTool programs (more details on these below). However, this is clearly not enough to help useres in the fight against intrusive advertising.
What is even more disturbing is that many AdWare programs have Trojan functionality, up to and including the use of rootkit technologies in order to hide their presence in the system. An example of this is Virtumonde: a few years ago, this program was rank-and-file AdWare, but we now classify it as a Trojan as its authors use underhand methods to spread it.
RiskWare and PornWare
As there are only three behaviors in the PornWare group, and the number of programs in this group detected by Kaspersky Lab analysts in the first half of 2008 made up 11.7% of all potentially unwanted programs, the analysis below looks at PornWare together with RiskWare.
The figure below shows the number of new RiskWare and PornWare programs detected by Kaspersky Lab analysts each month.

Number of new RiskWare and PornWare programs detected by Kaspersky Lab
(July 2007 -June 2008)
In the first half of 2008, Kaspersky Lab analysts detected more than 26000 RiskWare and PornWare programs, giving a growth figure for the two classes of more than 1700%.
This is because several thousand programs classifed as AdTool were added to the antivirus databases. The graph clearly shows the corresponding peak in March; following this, the figures for RiskWare and PornWare flattened out and were in accordance with predicted figures.
The figure below shows the distribution of behaviors within the RiskWare and PornWare classes.

Distribution of RiskWare+ PornWare programs by behavior
Number of new RiskWare and PornWare programs by behavior
| RiskWare&PornWare | 1H 2008 | 2H 2007 | Growth | 2008% | “+/-” |
| AdTool | 13555 | 50 | 27010% | 51.33% | 47.90% | Porn-Dialer | 8311 | 130 | 6293.08% | 31.48% | 22.60% | Monitor | 1491 | 611 | 144.03% | 5.65% | -36.20% | PSW-Tool | 719 | 131 | 448.85% | 2.72% | -6.20% | Downloader | 688 | 104 | 561.54% | 2.61% | -4.50% | Server-FTP | 396 | 36 | 1000% | 1.5% | -1% | Other | 246 | 47 | 423.40% | 0.93% | -2.30% | RemoteAdmin | 228 | 107 | 113.08% | 0.86% | -6.50% | Net-Tool | 200 | 73 | 173.97% | 0.76% | -4.20% | Porn-Tool | 165 | 13 | 1169.23% | 0.62% | -0.30% | RiskTool | 139 | 51 | 172.55% | 0.53% | -3% | Dialer | 113 | 46 | 145.65% | 0.43% | -2.70% | Server-Proxy | 67 | 17 | 294.12% | 0.25% | -0.90% | Porn-Downloader | 35 | 15 | 133.33% | 0.13% | -0.90% | Tool | 26 | 15 | 73.33% | 0.1% | -0.90% | Client-IRC | 11 | 7 | 57.14% | 0.04% | -0.40% | Server-Web | 7 | 5 | 40% | 0.03% | -0.30% | Server-Telnet | 5 | 0 | 0.02% | WebToolbar | 2 | 0 | 0.01% | Client-SMTP | 1 | 2 | -50% | 0 | -0.10% | Total | 26405 | 1460 | 1708.56% | 100% |
There are two clear leaders among the behaviors in the RiskWare and PornWare classes: AdTool (51.33%) and Porn-Dialer (31.48%).
AdTool programs are advertising modules which cannot be classified as AdWare, as they have the attributes of legitimate software e.g. license agreements, they clearly show their presence in the system and inform the user of their actions. The leading position taken by AdTool was to be expected given the number of programs exhibiting this behavior which were added to the antivirus databases all at once (see above).
Porn-Dialer programs contact premium-rate numbers, which often leads to legal disputes between subscribers and the telephone companies.
The figure for Monitor programs, which led the rankings in 2007, shows a significant drop. The Monitor behavior covers legitimate keyloggers, which are developed and sold on an official basis. However, as such programs hide themselves in the system, they can be used as Trojan spy programs. During the first six months of 2008, these programs dropped more than 35% and are now in third place among all potentially unwanted programs.
PSW-Tool and Downloader are still relatively common behaviors. The first is designed to recover forgotten passwords, but can easily be used malicious to extract passwords from a computer without the victim suspecting anything. The second type of program can be used to download malicious content to the victim machine.
It should also be noted that there has been a significant decrease (-6.5%) in the number of RemoteAdmin programs.
Platforms and operating sytems
Last year we started publishing detailed statistics on the distribution of malicious and potentially unwanted programs by operating system.
An operating system or an application can be attacked by a malicious program if it is possible to run a program which is not part of the system itself. All operating systems, many office applications, picture editors, graphics and other packages which have inbuilt scripting languages, make this possible.
During the first six months of 2008, Kaspersky Lab analysts detected malicious and potentially unwanted programs for 41 different operating systems and platforms.
Unsurprisingly, the vast majority of such programs are designed to run in the Win32 environment and are binary executables. They made up 98.31% of programs detected.
Programs which target other operating systems and platforms make up less than 2% of all programs detected. In the first half of 2008, the number of malicious and potentially unwanted programs rose by 233% in comparison with the previous six months. The growth rate in programs for other operating systems and platforms was only 39%, less than the equivalent figure (63%) in 2007. This shows that virus writers have not, as was expected, turned their attention from Win32 to other platforms. On the contrary, the growth previously observed in the number of non-Win32 threats ceased, and the number of threats started to decrease. (It should be noted that these made up 4% of all threats in 2007).

Number of new malicious and potentially unwanted programs according to platform targeted
| 2H 2007 | 1H 2008 | Growth | 2007% | 2008% | “+/-” | |
| Win32 | 130131 | 432862 | 232.60% | 96.00% | 98.30% | -2.27% | Other | 5362 | 7449 | 38.90% | 4% | 1.70% | 2.27% | Total | 135493 | 440311 | 225% |
| 1H 2008 | 2H 2007 | Growth | Acad | 6 | 5 | 20% | ALS | 1 | 3 | -67% | ASP | 39 | 135 | -71% | BAT | 765 | 553 | 38% | DOS | 45 | 44 | 2% | HTML | 1103 | 930 | 19% | HWP | 1 | 0 | 0% | Ichitaro | 1 | 0 | 0% | IIS | 1 | 0 | 0% | IRC | 51 | 86 | -41% | J2ME | 41 | 6 | 583% | Java | 17 | 25 | -32% | JS | 3311 | 2240 | 48% | Linux | 28 | 45 | -38% | Mac | 14 | 33 | -58% | MSAccess | 14 | 4 | 250% | MSExcel | 94 | 10 | 840% | MSIL | 327 | 31 | 955% | MSOffice | 7 | 3 | 133% | MSPPoint | 42 | 16 | 163% | MSWord | 135 | 83 | 63% | Multi | 4 | 11 | -64% | MySQL | 1 | 0 | 0% | NSIS | 27 | 17 | 59% | OLE2 | 1 | 0 | 0% | OSX | 6 | 0 | 0% | Perl | 39 | 37 | 5% | PHP | 155 | 186 | -17% | Python | 10 | 9 | 11% | RAR | 7 | 12 | -42% | Ruby | 3 | 5 | -40% | Shell | 5 | 0 | 0% | SWF | 260 | 3 | 8567% | SymbOS | 34 | 30 | 13% | VBS | 820 | 748 | 10% | Win16 | 6 | 7 | -14% | Win32 | 432862 | 130131 | 233% | Win9x | 5 | 3 | 67% | WinCE | 3 | 0 | 0% | WinREG | 15 | 39 | -62% | WMA | 5 | 3 | 67% | Total | 440311 | 135493 | 225% |
As the table above shows, the number of new programs for different operating systems and platforms varies greatly. The most significant changes are detailed below:
- The use of VBS and JS script languages (which were part of the leading group last year) as a “virus” platform has slowed significantly.
- The number of malicious programs for the J2ME platform has grown by 583%. The growth in the number of Trojan-SMS programs, most of which are designed to run on this platform, was noted above.
- The number of malicious programs in the form of XLS files, which generally exploit vulnerabilities in MS EXCEL, has grown by 840%. Several dozen such vulnerabilities have been identified over the past year, and they have all been widely exploited by virus writers, particularly Chinese virus writers.
- Programs written for the .NET platform have increased in number by 955%. This was to be expected, and 2008 saw the beginning of this process. It’s likely in the future that this platform may become the second most commonly attacked, overtaking Java Script. One interesting feature of .NET which is particularly attractive to virus writers is the ability to launch such files not only on computers running Windows but also on mobile devices running Windows Mobile.
- The number of malicious programs in the form of SWF files has risen by more than 8500%. This is due to an extremely dangerous vulnerability having been identified in the processing of such files. Cyber criminals reacted quickly and started using SWF as a new means of delivering malicious programs. As a result, more than 250 variants of malicious SWF files appeared on the Internet in spring this year.
The table below groups all operating systems and platforms attacked during the first six months of 2008 according to the operating system ultimately under attack. For instance, JS and VBS falls into the Windows group, Ruby and Perl into the *nix group and so on.
| Number | % | |
| Nix (Linux, Perl, PHP, Ruby, Shell) | 230 | 0.052% | Mac (OSX, Mac) | 20 | 0.005% | Mobile (J2ME, Symbian, WinCE, Python) | 88 | 0,02 | Other (DOS, IIS, Multi, MySQL) | 51 | 0.012% | Windows | 439922 | 99.912% |
Conclusion
The evolution of threats during the first half of 2008 followed the trends of 2007: virus writers continue not to use sophisticated technologies, preferring to rely on the quantity, rather than the quality, of malicious programs.
The number of new threats is following a geometric progression, with threats detected in the wild having a reduced life span. Out of the thousand new Trojans detected each day, only a few dozen continue to pose a threat to users after a week or a month. All the others are “decommissioned”, being replaced by new modifications which are designed to evade detection by antivirus solutions.
However, the upward trend in the number of new malicious programs has to come to an end – it may be that growth will slow, or even plateau, during this year. Although the figures reached (approximately 500,000 new malicious programs in the space of half a year) will be maintained, the majority of antivirus companies will be capable of dealing with the issues.
Today, the antivirus industry has to solve problems which differ from the problems of the past: specifically, the fact that efforts have to be directed towards the early detection of threats. While in the past it was possible simply to react to new threats in a couple of hours (or sometimes in a couple of days), now the window is counted in minutes. This means that antivirus experts have to identify new malicious code on the Internet – and this could mean at any point around the globe – analyse it, release protection, and deliver it to the end user.
From the same authors


In the same category


Kaspersky Security Bulletin 2008: Malware Evolution January – June 2008