
Q3 in figures
- According to KSN data, Kaspersky Lab products detected and neutralized 1,347,231,728 threats in Q3 2012.
- 28% of all mobile devices attacked run Android OS version 2.3.6, which was released in September 2011.
- 56% of exploits blocked in Q3 use Java vulnerabilities.
- A total of 91.9 million URLs serving malicious code were detected, a 3% increase compared to Q2 2012.
Overview
Mobile malware and operating systems
During Q3 2012, over 9,000 new malicious .dex files were added to our malware collection. This is 5,000 files fewer than last quarter but 3,500 more than in Q1 2012.
This is due to the fact that in Q2 files that had been detected heuristically for some time were added to our malware collection. (Note that one heuristic is used to detect a large number of different programs.) In Q3, the situation was standard and the number of new files added to our collection was in line with the trend we have seen since the beginning of the year.

The number of malware modifications targeting Android OS
It is curious to see which Android versions become targets for cyber-attacks most often.
Distribution of the malware detected by Android OS version, Q3 2012
Android 2.3.6 “Gingerbread”, which accounts for 28% of all blocked attempts to install malware, was the most commonly attacked version. It is not new: it was released in September 2011. However, due to the considerable segmentation of the Android device market, it remains one of the most popular versions.
To find out whether there is a good correlation between the distribution of Android OS versions on mobile devices and the distribution of OS versions on devices attacked by cybercriminals, we need to compare our data to the official Android OS version distribution figures from developer.android.com. Below we provide the percentage distribution of OS versions for the last two weeks of September:
Source: http://developer.android.com/about/dashboards/index.html
Compare this to our data for the same period:
Distribution of malware detected in the last 14 days of September 2012, by Android OS version
As we can see, there are significant differences between the diagrams: in 48% of all cases victims of cybercriminals used Gingerbread, which was installed on 55% of all devices, while in 43% of all cases the victims had Ice Cream Sandwich, the latest version of Android OS, which is installed on 23.7% of all devices.
It is obvious that the devices with the later versions of operating systems installed on them are better suited to actively working online. Unfortunately, more active web surfing often leads users to sites hosting malicious content.
Below, we use the KSN statistics for mobile devices to determine what kinds of programs most commonly attack user devices.
Distribution of malware targeting Android OS detected on user devices by behavior, Q3 2012*
More than one half of all malware detected on user smartphones turned out to be SMS Trojans, i.e. malicious programs that steal money from victims’ mobile accounts by sending SMS messages to premium rate numbers.

Distribution of the Android OS malware detected on user devices by family, Q3 2012*
* Detection verdicts returned by the Kaspersky Mobile Security file scanning module. Information provided by those users of KL products who have expressly agreed to provide statistical data.
The OpFake family has become the most widespread (38.3% of all the malicious programs for Android detected) among all the mobile malware families. All the programs in this family disguise themselves as Opera Mini. Third place in the ranking was taken by the FakeInst family, whose members pretend to be installers for popular programs (17%). These two types of malware are mostly distributed via so-called alternative app stores created by cybercriminals.
A fifth of the malicious programs detected on user devices are versatile Trojans, most of which belong to the Plangton family. After being installed on a device, these Trojans collect service data on the telephone, send it to the command server and wait for the cybercriminals’ commands. Specifically, malicious programs in this family can stealthily change bookmarks and the home page.
5% – not-a-virus:RiskTool.AndroidOS.SMSreg, which subscribes the user to expensive services. Programs in this family target users from such countries as the US, the Netherlands, Great Britain and Malaysia. We have written about these programs in our blog.
4% – the Exploit.AndroidOS.Lotoor family. To gain control of a device, cybercriminals need to perform a jailbreak (i.e. to bypass the telephone’s protection in order to gain full access to the file system). Malware belonging to this family is used to obtain root privileges, which offer virtually unlimited possibilities related to manipulating the system.
Various advertising programs detected as AdWare together also account for 4% of mobile malware. The most ‘popular’ of these belong to the Hamob family and show advertising built into applications.
To summarize, attacks of cybercriminals in Q3 most commonly targeted Android versions 2.3.6 Gingerbread and 4.0.4 Ice Cream Sandwich. Attackers are sufficiently good at bypassing restrictions on installing software from untrusted sources, primarily using social engineering techniques. In the wild, Trojans that use a variety of methods to steal money from mobile users’ accounts are the most widespread, although they are clearly being gradually replaced by more sophisticated versatile Trojans.
Exploits: Java vulnerabilities are used in more than half of all attacks
Online attacks primarily involve various exploits that allow attackers to download malware onto victims’ computers during drive-by attacks without having to resort to social engineering. The successful use of exploits is reliant on the presence of vulnerabilities in the code of popular applications installed on user machines.
The diagram below shows which vulnerable applications were targeted by exploits in Q3. This quarter, we changed the methodology and included exploits detected heuristically in the statistics.
Applications with vulnerabilities targeted by web exploits, Q3 2012
Java vulnerabilities were exploited in more than 50% of all attacks. According to Oracle, different versions of this virtual machine are installed on more than 1.1 billion computers. Importantly, updates for this software are installed on demand rather than automatically, increasing the lifetime of vulnerabilities. In addition, Java exploits are sufficiently easy to use under any Windows version and, with some additional work by cybercriminals, as in the case of Flashfake, cross-platform exploits can be created. This explains the special interest of cybercriminals in Java vulnerabilities. Naturally, most detections are triggered by various exploit packs.
A number of vulnerabilities that cybercriminals were quick to take advantage of were discovered in Q3. CVE-2012-1723, discovered in July, is an error in the HotSpot component, by exploiting which attackers can execute their class, bypassing the sandbox provided by the Java virtual machine. Another vulnerability, CVE-2012-4681, was found in late August. Exploits for this vulnerability were first used in targeted attacks, but were quickly included in popular exploit packs. Kaspersky Lab products successfully detected them using the Advanced Exploit Protection technology. More information about this can be found in our blog.
Attacks via Adobe Reader rank second, accounting for a quarter of all attacks blocked. The popularity of exploits for Adobe Reader is gradually declining due to a realtively simple mechanism that ensures their detection, as well as to automated updates introduced in the latest versions of the Reader.
Exploits targeting vulnerabilities in the Windows Help and Support Center, as well as various Internet Explorer (IE) flaws, accounted for 3% of all attacks. Specifically, a new vulnerability (CVE-2012-1876) was discovered in Q3 in IE versions 6-9. A vulnerable browser does not properly handle objects in memory, which allows remote attackers to attempt to access a non-existent object, leading to a heap overflow. Curiously, the vulnerability was exploited during the Pwn2Own contest at the CanSecWest 2012 conference in March.
Our advice is that users should install updates of popular programs as they are released and use up-to-date protection against exploits, and companies should also use Patch Management technologies.
Cyber-espionage: Gauss, Madi and others
Q3 saw a plethora of espionage-related incidents. The most significant of these were related to the activity of Madi, Gauss and Flame malware, which were distributed primarily in the Middle East.
One campaign related to penetrating computer systems went on for almost a year and targeted users primarily in Iran, Israel and Afghanistan. We conducted a joint detailed study of this malware with our partner, an Israeli company called Seculert. The malicious program was named “Madi” based on the strings and identifiers used by the cybercriminals in their malware. The malicious components were distributed via attacks that were based on a set of well-known unsophisticated technologies. This indicates that the victims’ awareness of Internet security left much to be desired.
These attacks involved installing backdoors coded in Delphi on victim machines. They could have been created by an amateur programmer or else by a professional developer who was extremely short of time. The campaign targeted the critically important infrastructure of engineering firms, government organizations, banks and universities in the Middle East. Victims were chosen among users within these organizations whose communications had been under close surveillance for extended periods of time.
The Gauss malware was discovered in the course of an investigation initiated by the International Telecommunication Union (ITU) after the discovery of the Flame malware. Essentially, Gauss is a nation-state sponsored “banking” Trojan. In addition to stealing a variety of data from infected Windows machines, it includes malicious payload which is encrypted and the purpose of which is not yet known. The malicious program activates only on systems with certain configurations. Gauss is based on the Flame platform and shares some features with Flame, such as routines for infecting USB drives.
Our experts were also able to gain new information on Flame command-and-control (C&C) servers. A study conducted by Kaspersky Lab experts in cooperation with our partners – Symantec, ITU-IMPACT and CERT-Bund/BSI – has enabled us to make a number of important conclusions. First, the development of code for C&C servers based on the platform began as far back as December 2006. Judging by the comments left in the source code, the project was developed by at least four programmers. The C&C code supports three communication protocols. A major finding is that it handles requests from four malicious programs, codenamed by the authors as SP, SPE, FL and IP.
Of these four malicious programs, only two are known at this time: Flame and SPE (a.k.a. miniFlame).
Based on the data collected from the study, we can state that the cyber-espionage story looks set to continue in the near future. The objective of the work performed by Kaspersky Lab is to mitigate the risks which have arisen with the emergence of cyber weapons.
Statistics
Below, we will review the statistics obtained from the operation of various malware protection components. All statistical data used in the report has been obtained with the help of the cloud-based Kaspersky Security Network (KSN). The statistics were acquired from KSN users who consented to share their local data. Millions of users of Kaspersky Lab products in 213 countries take part in the global information exchange on malicious activity.
Online threats
The statistics in this section are derived from the web-based antivirus solution that protects users as soon as malicious code is uploaded from an infected web page. Infections can be found on web pages where users are allowed to create their own content (e.g. forums) and even on legitimate pages which have been compromised by hackers.
Detectable online objects
In Q3 2012, 511 269 302 attacks were neutralized. These had been launched from online resources located in various countries around the world. A total of 165 732 unique modifications of malicious and potentially unwanted programs were detected in these incidents.
TOP 20 malicious programs detected on the Internet
| Rank | Name* | % of all attacks** |
| 1 | % of all attacks** | 90,70% |
| 2 | Trojan.Script.Generic | 2,30% |
| 3 | Trojan.Script.Iframer | 1,60% |
| 4 | Trojan-Downloader.SWF.Voleydaytor.h | 0,40% |
| 5 | Trojan.Win32.Generic | 0,40% |
| 6 | Exploit.Script.Blocker | 0,30% |
| 7 | AdWare.Win32.IBryte.x | 0,20% |
| 8 | Trojan-Downloader.JS.Iframe.cyq | 0,20% |
| 9 | Exploit.Script.Generic | 0,20% |
| 10 | Trojan-Downloader.JS.Agent.gsv | 0,20% |
| 11 | Trojan-Downloader.JS.JScript.bp | 0,20% |
| 12 | Hoax.HTML.FraudLoad.i | 0,20% |
| 13 | Trojan-Downloader.Script.Generic | 0,10% |
| 14 | Trojan.HTML.Redirector.am | 0,10% |
| 15 | Trojan-Downloader.Win32.Generic | 0,10% |
| 16 | Trojan-Downloader.JS.Iframe.czo | 0,10% |
| 17 | AdWare.Win32.ScreenSaver.e | 0,10% |
| 18 | Backdoor.MSIL.Agent.gtx | 0,10% |
| 19 | Trojan.JS.Popupper.aw | 0,10% |
| 20 | Exploit.Java.CVE-2012-4681.gen | 0,10% |
*These statistics represent detection verdicts of the web-based antivirus module and were submitted by the users of Kaspersky Lab products who consented to share their local data.
**The total number of unique incidents recorded by web-based antivirus on user computers.
First place in this ranking is still occupied by malicious links from our denylist. They now trigger 90% of all antivirus alerts, 5 percentage points more than in the previous quarter. Of these, 4% of malicious linked were blocked as a result of instant cloud-based updates; the links are to newly compromised sites, or freshly-made cybercriminal pages. Users without antivirus protection installed would face a drive-by attack as soon as they visited these pages.
Trojan-Downloader.SWF.Voleydaytor.h takes third place. It is detected on various adult content sites. While claiming to update a video playback program, various malicious programs are delivered to user computers.
In seventh place we see the adware program AdWare.Win32.IBryte.x, which spreads as a downloader of popular freeware. Once started, it downloads the freeware program required by the user, and simultaneously installs an adware module. It’s just as easy to download the programs you need from their official sites, saving you the trouble of removing adware later. A recent study suggests this problem mostly affects Internet Explorer users.
Hoax.HTML.FraudLoad.i (in 12th place) is interesting. This threat mostly affects users who like downloading films and software for free. From web pages detected under this heading, users purportedly can download content, but are first required to send a paid message. Users who do so don’t receive the required file, but either a TXT file containing advice on how to use search engines, or a malicious program.
The Top 20 is completed by Exploit.Java.CVE-2012-4681.gen, an exploit detected in late August that simultaneously uses two Java vulnerabilities. Java exploits are especially popular with cybercriminals as there are more than three billion devices in the world that have this virtual machine installed on them. This exploit is interesting in that it has been used both in targeted attacks (APT) and as part of mass infection exploit kits.
12 positions in the ranking are taken up by malicious programs and components which deliver Trojans to the user’s computer in conjunction with exploits.
Countries where web resources are seeded with malware
These figures show where sites hosting malicious programs are physically located. The geographic sources of web attacks were determined by comparing the domain name with the actual IP address where a specific domain is located, and determining the location of that IP address (GEOIP).
Just 10 countries worldwide host 86% of the web resources used to spread malware. For the second quarter running this figure has climbed by a single percentage point.
A distribution of online resources seeded with malicious code, by country.
Q3 2012
There is a new leader among countries hosting malicious content: Russia (23.2%) has overtaken the USA (20.3%). In the last three months, the proportion of malicious hosts in Russia has dramatically increased (+8.6 percentage points); at the same time, the fall in the US share (-9.7 percentage points) has almost mirrored Russia’s rise. The number of malicious hosts in the Netherlands has also risen (+5.8 percentage points). 60% of all malicious content is located in the top three countries – Russia, the USA and the Netherlands. Without effective action from law enforcement agencies and hosting providers, this situation is likely to continue for several more months.
There were no significant changes among the other countries in the Top 10, apart from the UK’s share falling by 2.6 percentage points.
Countries where users faced the greatest risk of infection via the Internet
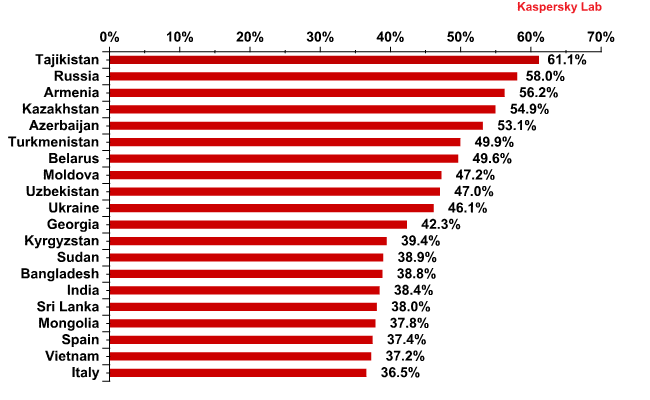
In order to assess a user’s infection risk in any given country, Kaspersky Lab calculated the frequency of web antivirus detections in different countries throughout the quarter. These figures are based on the raw number of web antivirus alerts on computers in each country and are not adjusted to reflect the number of KSN users in each country.
Top 20 countries* for online infection risks** in Q3 2012
*When calculating, we excluded those countries in which the number of Kaspersky Lab product users is relatively small (less than 10,000).
**The percentage of unique users in the country with computers running Kaspersky Lab products that blocked web-borne threats.
In the previous quarter, the top 20 consisted exclusively of countries from the former Soviet Union, Africa and SE Asia. This time, two Southern European countries are on the list, namely Italy (36.5%) and Spain (37.4%).
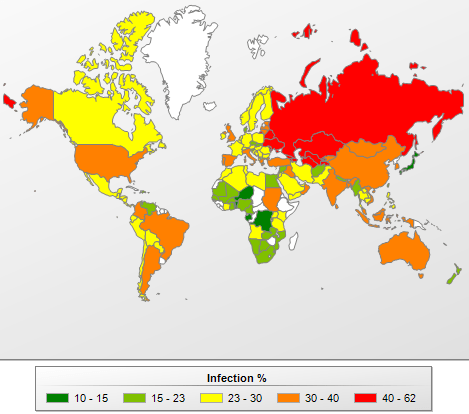
All these countries can be divided into four groups.
- The Maximum risk group includes countries where more than 60% of users encountered malware at least once while online. In Q3, Tajikistan (61.1%) found itself in this category, displacing Russia (58%) from the leader’s position.
- The High risk group includes countries where 41% to 60% of users encountered online malware at least once. This group includes ten countries from the TOP 20, eight countries fewer than in the last quarter. Along with Russia (58%), this group includes Kazakhstan (54.9%), Belarus (49.6%) and Ukraine (46.1%)
- The Moderate risk group (21-40%) includes 99 countries, including India (38.4%), Spain (37.4%), Italy (36.5%), Lithuania (33.5%), China (33.4%), Turkey (33.3%), the USA (32.4%), Brazil (32.9%), the UK (30.2%), Belgium (28.3%) and France (28.2%).
- The Low risk group includes 27 countries where between 10.6% and 21% of users have encountered online malware
The safest surfing was in Japan (13.6%), Denmark (17.7%), Taiwan (15.4%), Hong Kong (19.3%), Luxembourg (19.7%), Slovakia (20.7%) and Singapore (20.9%).
The risk of online infection around the world, Q3 2012
It should be noted that African countries are in the safest web surfing group. In our opinion, the low level of online attacks is due to the fact that Internet usage remains underdeveloped in these countries. This hypothesis is supported by the fact that the situation with local infections in these countries is far from healthy (see below).
On average in Q3 2012, 36.7% of KSN users’ computers were attacked at least once while surfing online. That average is 3 percentage points less than the previous quarter.
Local threats
This section of the report contains an analysis of statistics based on data obtained from the on-access scanner and scanning statistics for different disks, including removable media (the on-demand scanner).
Malicious objects detected on users’ computers
In Q3 2012, Kaspersky Lab’s security solutions successfully blocked 882 545 490 local infection attempts on computers participating in Kaspersky Security Network.
A total of 328 804 unique modifications of malicious and potentially unwanted programs were blocked by on-access scanners while attempting to launch on user computers.
Top 20 malicious objects detected on users’ computers
| Rank | Name | %% of individual users* |
| 1 | Trojan.Win32.Generic | 17,1% |
| 2 | DangerousObject.Multi.Generic | 15,6% |
| 3 | Trojan.Win32.AutoRun.gen | 14,5% |
| 4 | Trojan.Win32.Starter.yy | 7,6% |
| 5 | Virus.Win32.Virut.ce | 5,5% |
| 6 | Net-Worm.Win32.Kido.ih | 4,8% |
| 7 | Virus.Win32.Sality.aa | 3,9% |
| 8 | HiddenObject.Multi.Generic | 3,9% |
| 9 | Virus.Win32.Generic | 3,7% |
| 10 | Virus.Win32.Nimnul.a | 3,2% |
| 11 | Trojan.WinLNK.Runner.bl | 2,5% |
| 12 | Worm.Win32.AutoRun.hxw | 1,8% |
| 13 | Virus.Win32.Sality.ag | 1,5% |
| 14 | Trojan.Win32.Patched.dj | 0,7% |
| 15 | Email-Worm.Win32.Runouce.b | 0,5% |
| 16 | AdWare.Win32.BHO.awvu | 0,4% |
| 17 | Trojan-Dropper.Script.Generic | 0,4% |
| 18 | AdWare.Win32.GoonSearch.b | 0,4% |
| 19 | Backdoor.Win64.Generic | 0,3% |
| 20 | AdWare.Win32.RelevantKnowledge.a | 0,3% |
These statistics are compiled from the malware detection verdicts generated by the on-access and on-demand scanner modules on the computers of those users running Kaspersky Lab products that have consented to submit their statistical data.
* The percentage of individual users on whose computers the antivirus module detected these objects as a percentage of all individual users of Kaspersky Lab products on whose computers a malicious program was detected.
Trojan.Win32.Generic (17.1%) takes first place in the rankings – this is the verdict given by the heuristic analyzer when proactively detecting a wide variety of malicious programs.
Malicious programs detected with the help of cloud technologies (DangerousObject.Multi.Generic, 15.6%) moved up one position to second spot. Cloud technologies work when neither signature-based nor heuristic methods are immediately able to detect a malicious program, but information about the object already exists in the cloud. In essence, this is the verdict given to the most recent malicious programs.
16th, 18th and 20th places are occupied by adware programs. The Q3 newcomer is the malware family AdWare.Win32.RelevantKnowledge (0.3%). Programs belonging to this family integrate into the web browser and periodically display a user query window.
Countries where users run the most serious risk of local infection
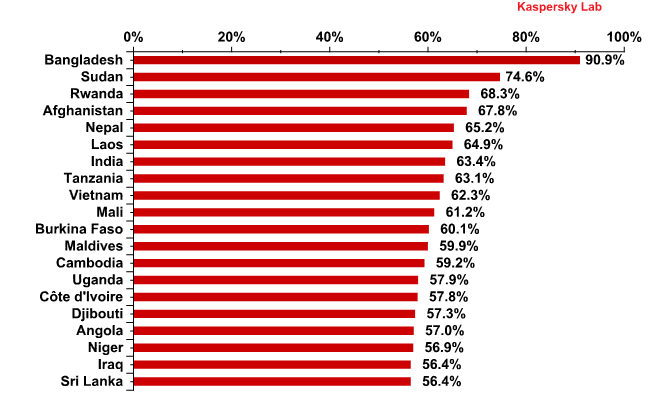
The figures below show the average rate of computer infection in different countries. KSN users who provide information for us had at least one malicious file detected on every third computer (32.5%) – either on the hard drive or on removable media connected to it. This is 3.9 percentage points less compared to the last quarter.
Computer infection levels by country* – TOP 20 rating**
Q3 2012
*The percentage of unique users in the country with computers running Kaspersky Lab products that blocked web-borne threats.
**When calculating, we excluded those countries where there are fewer than 10,000 Kaspersky Lab users.
Local infection rates can also be categorized into separate categories in terms of infection level.
- Maximum level of local infection (over 60%): this group now features nine fewer countries and consists of 11 Asian countries (India, Vietnam, Nepal etc.), Middle East countries (Afghanistan) and Africa (Sudan, Mali, Tanzania etc.).
- High level of local infection (41-60%): 39 countries, including Indonesia (53.5%), Egypt (46%), Thailand (42.3%), China (41.4%) and the Philippines (44.3%).
- Moderate level of local infection (21-40%): 56 countries, including Turkey, Mexico, Israel, Latvia, Portugal, Italy, Russia and Spain.
- Lowest level of local infection (under 21%): this group now includes newcomers, comprising 31 countries, including the USA, Australia, Canada, New Zealand, Puerto Rico, 19 European countries (including Norway, Estonia and France) and two Asian countries: Japan and Hong Kong.
The risk of local infection around the world, Q3 2012The 10 countries where users faced the lowest risk of local infection were:
Rank Country % of unique users 1 Denmark 10,5 2 Japan 10,6 3 Luxembourg 13,8 4 Switzerland 14,3 5 Sweden 14,7 6 Germany 15 7 Finland 15,1 8 Netherlands 15,1 9 Czech Republic 15,2 10 Ireland 15,5 Ireland is a newcomer to this rating, appearing at number 10 with 15.5% of computers blocking malicious programs from various media carriers.
Vulnerabilities
In the third quarter of Q3 2012 a total of 30 749 066 vulnerable programs and files were detected on the computers of KSN users – with an average of eight different vulnerabilities on each affected computer.
The Top 10 vulnerabilities are listed in the table below.
№ Secunia ID – Unique vulnerability number Vulnerability name and link to description What the vulnerability lets malicious users do Percentage of users on whose computers the vulnerability was detected* Date of latest change Rating 1 SA 49472 Oracle Java Multiple Vulnerabilities DoS-attack
Gain access to a system and execute arbitrary code with local user privileges
Cross-Site Scripting
Gain access to sensitive data
Manipulate data35,00% 20.08.2012 Highly Critical 2 SA 50133 Oracle Java Three Vulnerabilities Gain access to a system and execute arbitrary code with local user privileges 21,70% 31.08.2012 Extremely Critical 3 SA 50354 Adobe Flash Player Multiple Vulnerabilities Gain access to a system and execute arbitrary code with local user privileges Gain access to sensitive data
19,00% 25.09.2012 Highly Critical 4 SA 49388 Adobe Flash Player Multiple Vulnerabilities Gain access to a system and execute arbitrary code with local user privileges Bypass security systems
18,80% 18.06.2012 Highly Critical 5 SA 47133 Adobe Reader/Acrobat Multiple Vulnerabilities Gain access to a system and execute arbitrary code with local user privileges 14,70% 11.01.2012 Extremely Critical 6 SA 47447 Apple QuickTime Multiple Vulnerabilities Gain access to a system and execute arbitrary code with local user privileges 13,80% 23.08.2012 Highly Critical 7 SA 49489 Apple iTunes Multiple Vulnerabilities Gain access to a system and execute arbitrary code with local user privileges 11,70% 10.07.2012 Highly Critical 8 SA 46624 Winamp AVI / IT File Processing Vulnerabilities Gain access to a system and execute arbitrary code with local user privileges 10,90% 03.08.2012 Highly Critical 9 SA
50283Adobe Shockwave Player Multiple Vulnerabilities Gain access to a system and execute arbitrary code with local user privileges 10,80% 14.08.2012 Highly Critical 10 SA
41917Adobe Flash Player Multiple Vulnerabilities Gain access to a system and execute arbitrary code with local user privileges Bypass security systems
Gain access to sensitive data
9,70% 09.11.2010 Extremely Critical *Percentage of all users on whose computers at least one vulnerability was detected
The first two spots are taken by Oracle Java vulnerabilities, which were found on 35% and 21.7% of vulnerable computers respectively.
Five common vulnerabilities affect Adobe products: Flash Reader and Shockwave players and Reader, a popular PDF reader for documents.
The rating now also includes two Apple programs – QuickTime player and iTunes and the popular Nullsoft Winamp media-player.

Vendors of products with the Top 10 vulnerabilities, Q3 2012Any of the top 10 vulnerabilities can jeopardize a computer’s security because they all allow cybercriminals to gain full control of the system using exploits. As in Q2, three vulnerabilities enable attackers to gain access to sensitive data. Both Flash Player vulnerabilities enable cybercriminals to bypass security systems integrated into the application. The top 10 also features vulnerabilities that enable attackers to manipulate data and conduct DDoS and XSS attacks.

Distribution of Top 10 vulnerabilities by type of system impact, Q3 2012Microsoft products no longer feature among the Top 10 products with vulnerabilities. This is because the automatic updates mechanism has now been well developed in recent versions of Windows OS.
IT Threat Evolution: Q3 2012








Gabriel Annang Gogo
Great piece