

Authors
IT threat evolution Q2 2020. Review
IT threat evolution Q2 2020. Mobile statistics
These statistics are based on detection verdicts of Kaspersky products received from users who consented to provide statistical data.
Quarterly figures
According to Kaspersky Security Network, in Q2:
- Kaspersky solutions blocked 899,744,810 attacks launched from online resources in 191 countries across the globe.
- As many as 286,229,445 unique URLs triggered Web Anti-Virus components.
- Attempted infections by malware designed to steal money via online access to bank accounts were logged on the computers of 181,725 unique users.
- Ransomware attacks were defeated on the computers of 154,720 unique users.
- Our File Anti-Virus detected 80,993,511 unique malware and potentially unwanted objects.
Financial threats
Financial threat statistics
In Q2 2020, Kaspersky solutions blocked attempts to launch one or more types of malware designed to steal money from bank accounts on the computers of 181,725 users.

Number of unique users attacked by financial malware, Q2 2020 (download)
Geography of attacks
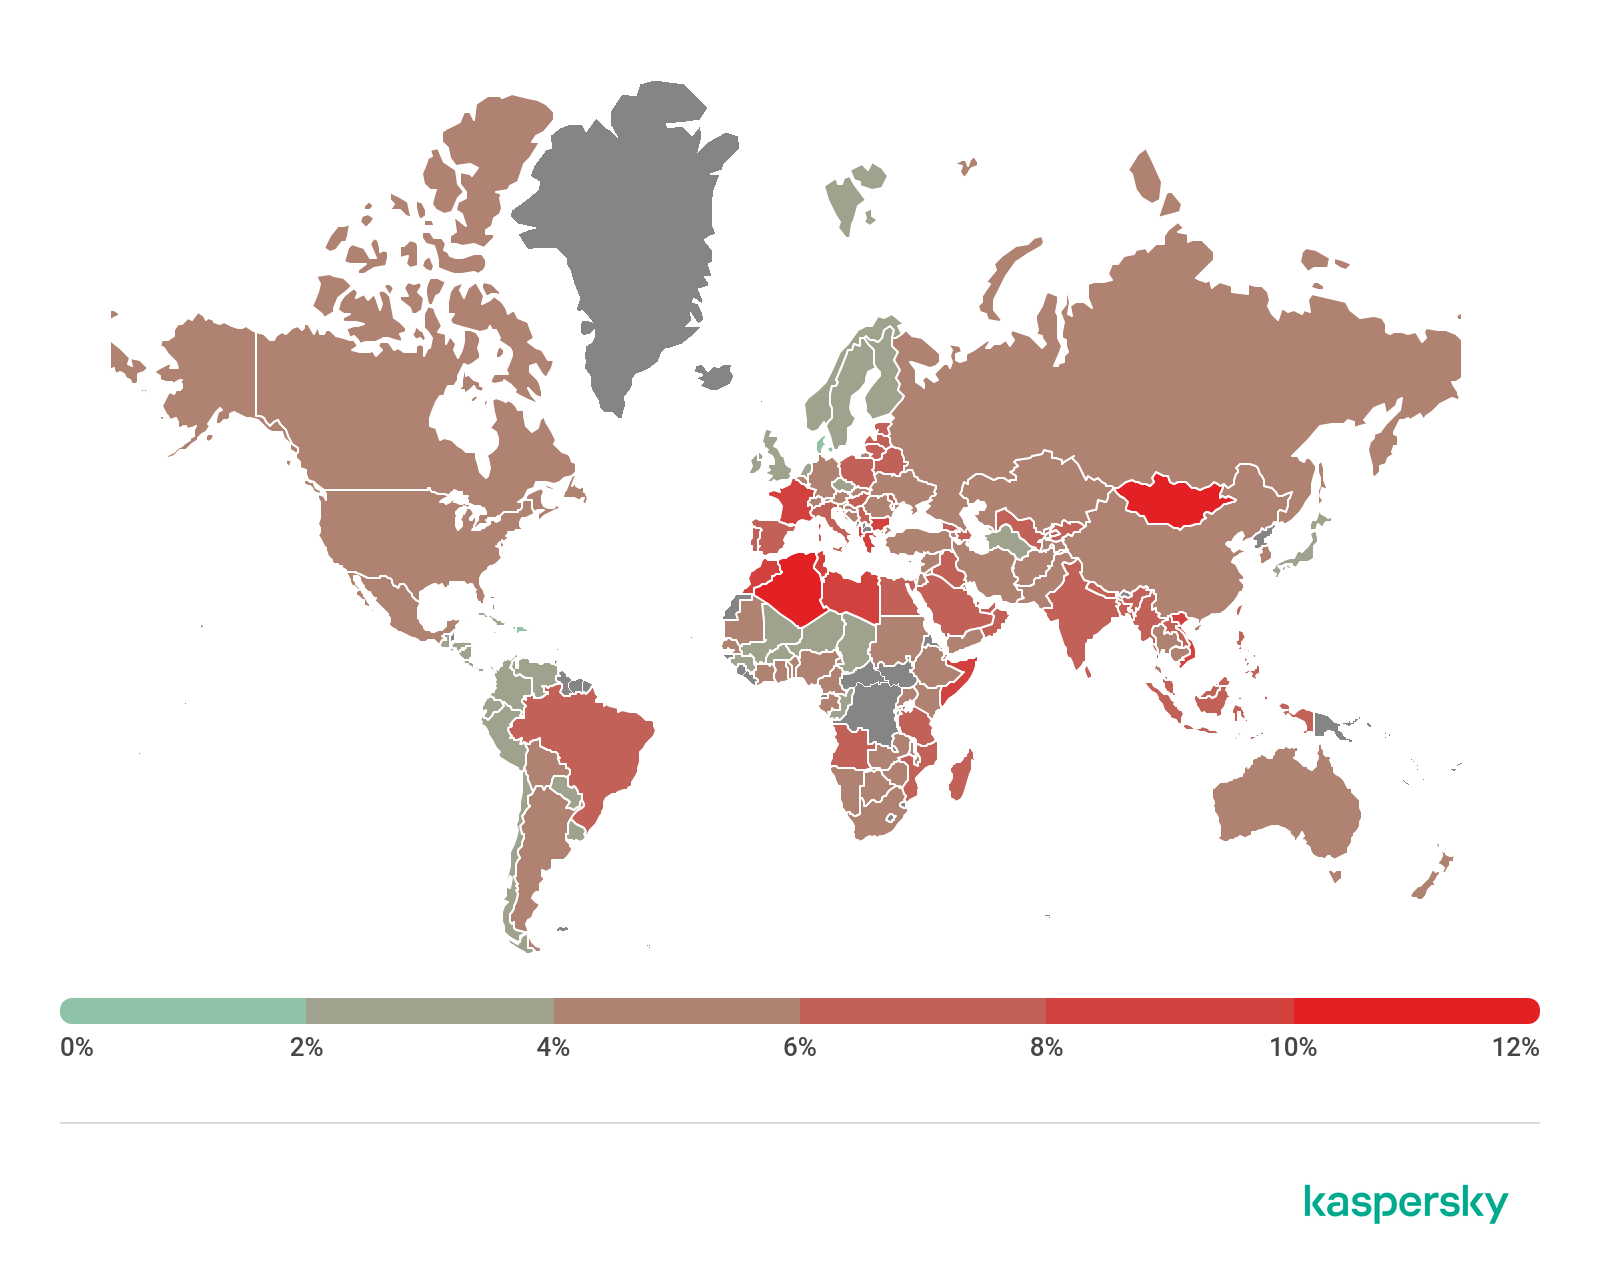
To evaluate and compare the risk of being infected by banking Trojans and ATM/POS malware worldwide, for each country we calculated the share of users of Kaspersky products that faced this threat during the reporting period out of all users of our products in that country.

Geography of financial malware attacks, Q2 2020 (download)
Top 10 countries by share of attacked users
| Country* | %** | |
| 1 | Turkmenistan | 7.5 |
| 2 | Uzbekistan | 5.7 |
| 3 | Tajikistan | 5.6 |
| 4 | Afghanistan | 2.6 |
| 5 | Macedonia | 2.6 |
| 6 | Yemen | 2.2 |
| 7 | Syria | 1.9 |
| 8 | Kazakhstan | 1.7 |
| 9 | Cyprus | 1.7 |
| 10 | Iran | 1.5 |
* Excluded are countries with relatively few Kaspersky product users (under 10,000).
** Unique users of Kaspersky products whose computers were targeted by financial malware as a share of all unique users of Kaspersky products in the country.
Among the banking Trojan families, the share of Backdoor.Win32.Emotet decreased markedly from 21.3% to 6.6%. This botnet’s activity decreased at the end of Q1 2020, but the results only became clear in the second quarter. However, as we prepared this report, we noticed that Emotet was gradually recovering.
Top 10 banking malware families
| Name | Verdicts | %* | ||
| 1 | Zbot | Trojan.Win32.Zbot | 24.8 | |
| 2 | RTM | Trojan-Banker.Win32.RTM | 18.6 | |
| 3 | CliptoShuffler | Trojan-Banker.Win32.CliptoShuffler | 15.4 | |
| 4 | Emotet | Backdoor.Win32.Emotet | 6.6 | |
| 5 | Trickster | Trojan.Win32.Trickster | 4.7 | |
| 6 | Nimnul | Virus.Win32.Nimnul | 4.3 | |
| 7 | Danabot | Trojan-Banker.Win32.Danabot | 3.4 | |
| 8 | SpyEye | Trojan-Spy.Win32.SpyEye | 3.0 | |
| 9 | Nymaim | Trojan.Win32.Nymaim | 2.5 | |
| 10 | Neurevt | Trojan.Win32.Neurevt | 1.4 |
** Unique users attacked by this malware family as a percentage of all users attacked by financial malware.
Ransomware programs
Quarterly trend highlights
The attackers behind the Shade ransomware announced that they had ceased to distribute the Trojan. In addition, they published keys to decrypt files affected by all of its versions. The number of keys that had been accumulated over the years exceeded 750,000, and we updated our ShadeDecryptor utility to help Shade victims to regain access to their data.
Ransomware written in Go began surfacing more often than before. Examples of recently discovered Trojans include Sorena, Smaug, Hydra, Satan/M0rphine, etc. What is this: hackers showing an interest in new technology, ease of development or an attempt at making researchers’ work harder? No one knows for sure.
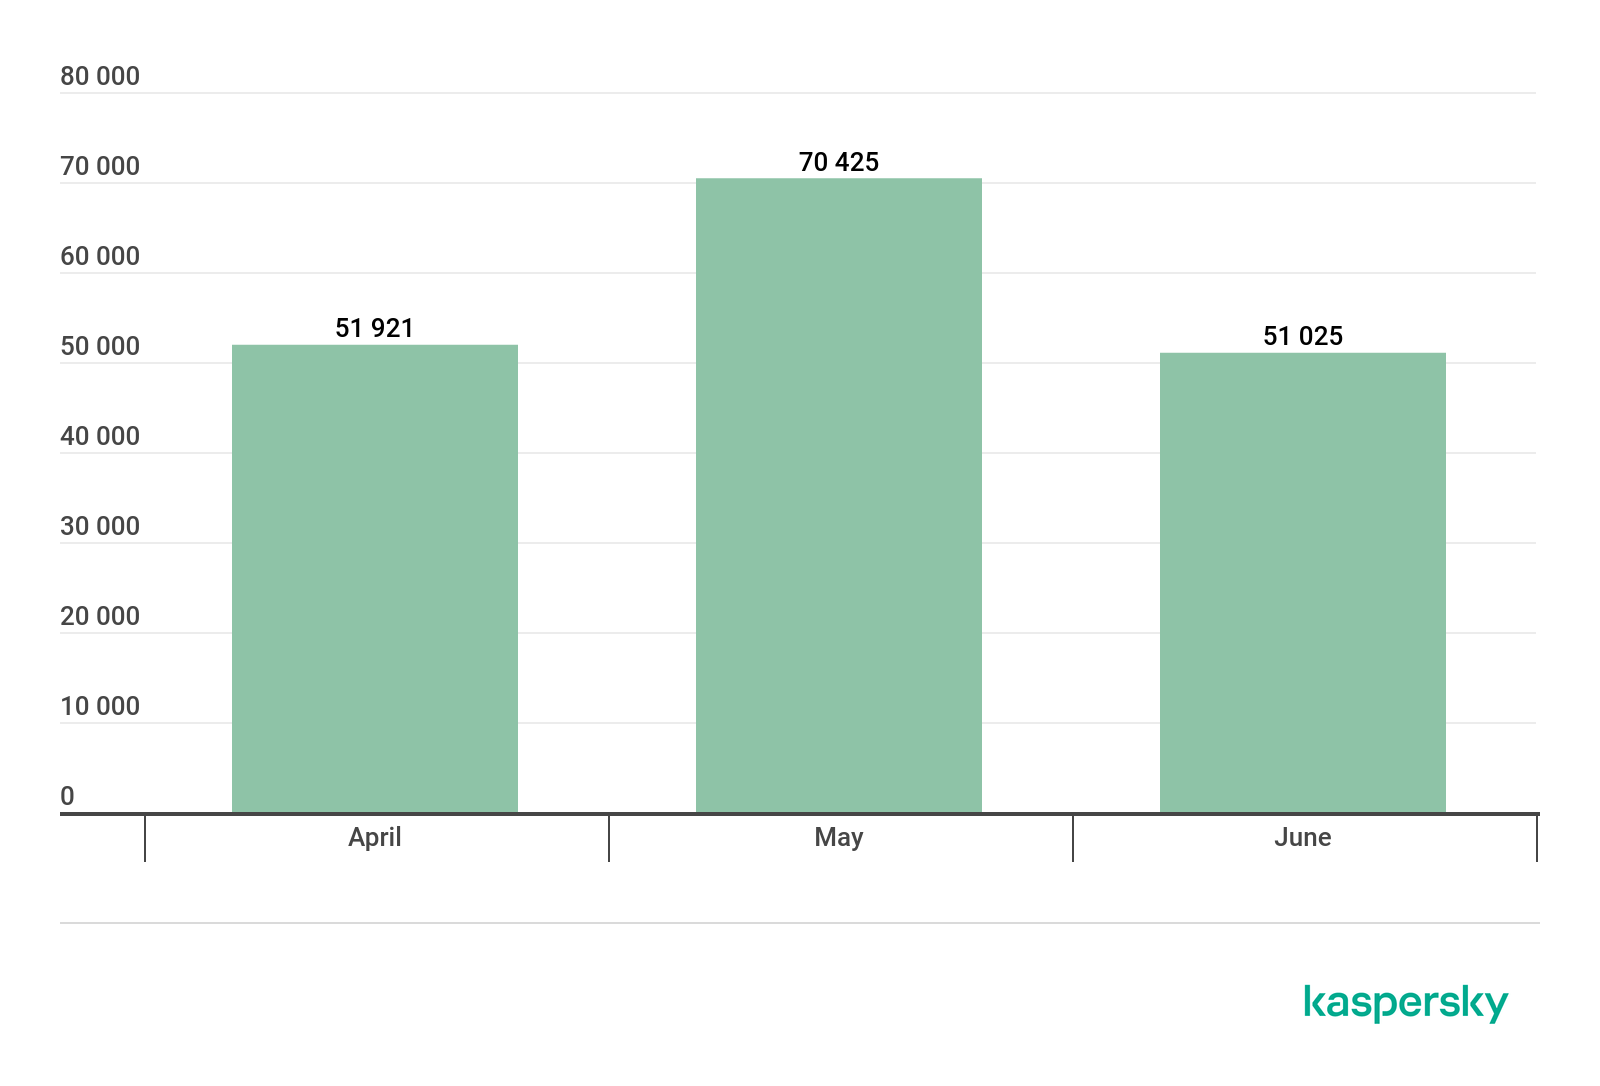
Number of new modifications
We detected five new ransomware families and 4,406 new modifications of these malware programs in Q2 2020.

Number of new ransomware modifications detected, Q2 2019 – Q1 2020 (download)
Number of users attacked by ransomware Trojans
Kaspersky products and technologies protected 154,720 users from ransomware attacks in Q2 2020.
Number of unique users attacked by ransomware Trojans, Q2 2020 (download)
Geography of attacks

Geography of attacks by ransomware Trojans, Q2 2020 (download)
Top 10 countries attacked by ransomware Trojans
| Country* | %** | |
| 1 | Bangladesh | 1.69% |
| 2 | Mozambique | 1.16% |
| 3 | Uzbekistan | 1.14% |
| 4 | Egypt | 0.97% |
| 5 | Ethiopia | 0.94% |
| 6 | China | 0.74% |
| 7 | Afghanistan | 0.67% |
| 8 | Pakistan | 0.57% |
| 9 | Vietnam | 0.55% |
| 10 | Mongolia | 0.49% |
* Excluded are countries with relatively few Kaspersky users (under 50,000).
** Unique users whose computers were attacked by Trojan encryptors as a share of all unique users of Kaspersky products in the country.
Top 10 most common families of ransomware Trojans
| Name | Verdicts | %* | |||
| 1 | WannaCry | Trojan-Ransom.Win32.Wanna | 14.74% | ||
| 2 | (generic verdict) | Trojan-Ransom.Win32.Gen | 9.42% | ||
| 3 | (generic verdict) | Trojan-Ransom.Win32.Generic | 7.47% | ||
| 4 | (generic verdict) | Trojan-Ransom.Win32.Encoder | 7.11% | ||
| 5 | Stop | Trojan-Ransom.Win32.Stop | 7.06% | ||
| 6 | GandCrab | Trojan-Ransom.Win32.GandCrypt | 4.68% | ||
| 7 | (generic verdict) | Trojan-Ransom.Win32.Crypren | 4.28% | ||
| 8 | (generic verdict) | Trojan-Ransom.Win32.Phny | 3.29% | ||
| 9 | Cerber | Trojan-Ransom.Win32.Zerber | 2.19% | ||
| 10 | Crysis/Dharma | Trojan-Ransom.Win32.Crusis | 2.16% | ||
* Unique Kaspersky users attacked by the specified family of ransomware Trojans as a percentage of all users attacked by ransomware Trojans.
Miners
Number of new modifications
Kaspersky solutions detected 3,672 new miner modifications in Q2 2020, which is several dozen times fewer than in the previous quarter.

Number of new miner modifications, Q2 2020 (download)
The difference can be explained by thousands of modifications of one miner family, which were detected in the first quarter. In the quarter under review, that miner’s activity dwindled, which is reflected in the statistics.
Number of users attacked by miners
We detected miner attacks on the computers of 440,095 unique Kaspersky users worldwide in Q2 2020. This type of threats shows a clear downward trend.

Number of unique users attacked by miners, Q2 2020 (download)
Geography of attacks

Geography of miner attacks, Q2 2020 (download)
Top 10 countries attacked by miners
| Country* | %** | |
| 1 | Afghanistan | 4.08% |
| 2 | Ethiopia | 4.04% |
| 3 | Uzbekistan | 2.68% |
| 4 | Tanzania | 2.57% |
| 5 | Vietnam | 2.17% |
| 6 | Rwanda | 2.11% |
| 7 | Kazakhstan | 2.08% |
| 8 | Sri Lanka | 1.97% |
| 9 | Mozambique | 1.78% |
| 10 | Belarus | 1.41% |
* Excluded are countries with relatively few Kaspersky product users (under 50,000).
** Unique users whose computers were attacked by miners as a share of all unique users of Kaspersky products in the country.
Vulnerable applications used by cybercriminals during cyberattacks
Exploit distribution statistics for Q2 2020, as before, show that vulnerabilities in the Microsoft Office suite are the most common ones. However, their share decreased to 72% in the last quarter. The same vulnerabilities we had seen before still topped the list. CVE-2017-8570, which allows inserting a malicious script into an OLE object placed inside an Office document, was the most commonly exploited vulnerability. It was followed by the Q1 favorite, CVE-2017-11882. This vulnerability exploits a stack overflow error in the Equation Editor component of the Office suite. CVE-2017-8570, a vulnerability similar to CVE-2017-0199, came third. The remaining positions on the TOP 5 list were occupied by CVE-2018-0802 and CVE-2017-8759.
The second category (exploits for popular browsers) accounted for about 12% in Q2, its share increasing slightly when compared to the previous period. During the reporting period, cybercriminals attacked Firefox using the CVE-2020-6819 vulnerability, which allows malicious code to be executed when an HTTP header is parsed incorrectly. Exploits that use the vulnerabilities in the ReadableStream interface, such as CVE-2020-6820, have been observed as well. No major vulnerability exploited to spread malware was observed during the reporting period for any of the other popular browsers: Google Chrome, Microsoft Edge, or Internet Explorer. However, fixes for a number of vulnerabilities that could potentially have been used for creating exploits, but were detected by researchers in time, were announced to software manufacturers.

Distribution of exploits used by cybercriminals, by type of attacked application, Q2 2020 (download)
The first quarter set a trend for researching font and other graphic primitives subsystems in Windows. In Q2, two vulnerabilities were discovered in Windows Codecs Library, assigned CVE-2020-1425 and CVE-2020-1457 codes. Both were fixed, and neither is known to have been exploited in the wild. Another interesting vulnerability fixed in the last quarter is CVE-2020-1300. It allows for remote execution of code due to incorrect processing of Cabinet files, for example, if the user is trying to run a malicious CAB file pretending to be a printer driver. Notably, the CVE-2020-1299 vulnerability allowed the attacker to execute arbitrary code with the user’s privileges by generating a specially formatted LNK file.
The trend for brute-forcing of Remote Desktop Services, Microsoft SQL Services and SMB access passwords persisted in Q2 2020. No full-on network attacks that exploited new vulnerabilities in network exchange protocols were detected. However, software developers did discover and fix several vulnerabilities in popular network services. Among the most interesting ones were CVE-2020-1301 for SMBv1, which allowed the attacker to execute code remotely on a target system. CVE-2020-0796 (SmbGhost), a popular SMBv3 vulnerability among researchers, received unexpected follow-up in the form of an exploit that allowed compromising the system without interacting with the user. The same protocol version was found to contain an error, designated as CVE-2020-1206 and known as the SMBleed vulnerability, which allowed the attacker to get a portion of the Windows kernel memory. The researchers even published several exploit versions that used a bundle of SMBleed and SMBGhost to execute the code with system privileges. In that mode, the attacker can install any software and access any information on the computer.
Attacks on Apple macOS
In Q2 2020, we discovered new versions of previously known threats and one new backdoor, which received the verdict of Backdoor.OSX.Lador.a. The malware is notable for being written in Go, a language gaining popularity as a means to create malware aimed at the macOS platform. If you compare the size of the Lador file with any backdoor created in Objective C, the difference will be very significant: the size of a Lador file is 5.5 megabytes, i.e. many times larger. And all this for the sake of remote access to the infected machine and execution of arbitrary code downloaded from the control center.
Top 20 threats for macOS
| Verdict | %* | |
| 1 | Monitor.OSX.HistGrabber.b | 17.39 |
| 2 | Trojan-Downloader.OSX.Shlayer.a | 12.07 |
| 3 | AdWare.OSX.Pirrit.j | 9.10 |
| 4 | AdWare.OSX.Bnodlero.at | 8.21 |
| 5 | AdWare.OSX.Cimpli.k | 7.32 |
| 6 | AdWare.OSX.Pirrit.o | 5.57 |
| 7 | Trojan-Downloader.OSX.Agent.h | 4.19 |
| 8 | AdWare.OSX.Ketin.h | 4.03 |
| 9 | AdWare.OSX.Pirrit.x | 4.00 |
| 10 | AdWare.OSX.Spc.a | 3.98 |
| 11 | AdWare.OSX.Amc.c | 3.97 |
| 12 | Backdoor.OSX.Lador.a | 3.91 |
| 13 | AdWare.OSX.Pirrit.v | 3.22 |
| 14 | RiskTool.OSX.Spigot.a | 2.89 |
| 15 | AdWare.OSX.Bnodlero.t | 2.87 |
| 16 | AdWare.OSX.Cimpli.f | 2.85 |
| 17 | AdWare.OSX.Adload.g | 2.60 |
| 18 | AdWare.OSX.Pirrit.aa | 2.54 |
| 19 | AdWare.OSX.MacSearch.d | 2.44 |
| 20 | AdWare.OSX.Adload.h | 2.35 |
* Unique users attacked by this malware as a percentage of all users of Kaspersky security solutions for macOS that were attacked.
The rankings of the most common threats for the macOS platform has not changed much compared to the previous quarter and is still largely made up of adware. As in Q1 2020, Shlayer (12.07%) was the most common Trojan. That malware loads adware from the Pirrit, Bnodlero and Cimpli families, which populate our TOP 20.
The Lador.a backdoor, which we mentioned above, entered the rankings along with adware.
Finally, in Q2 2020, a group of potentially unwanted programs collectively detected as HistGrabber.b joined the rankings. The main purpose of such software is to unpack archives, but HistGrabber.b also quietly uploaded the user’s browsing history to the developer’s servers. This is nothing new: all applications that steal browsing history have long been withdrawn from the App Store, and servers that could receive the data, disabled. Nevertheless, we deem it necessary to inform users of any such software discovered on their devices.
Threat geography

Threat geography for the macOS platform, Q2 2020 (download)
TOP 10 countries
| Country* | %** | |
| 1 | Spain | 9.82% |
| 2 | France | 7.73% |
| 3 | Mexico | 6.70% |
| 4 | Italy | 6.54% |
| 5 | India | 6.47% |
| 6 | Canada | 6.34% |
| 7 | Brazil | 6.25% |
| 8 | USA | 5.99% |
| 9 | United Kingdom | 5.90% |
| 10 | Russia | 5.77% |
* Excluded from the rating are countries with relatively few users of Kaspersky security solutions for MacOS (under 5,000).
** Unique users attacked in the country as a percentage of all users of Kaspersky security solutions for MacOS in the same country.
The most common threats in all the countries on the list without exception bundled various adware with the Shlayer Trojan.
IoT attacks
IoT threat statistics
Q2 2020 saw no dramatic change in cybercriminal activity targeting IoT devices: attackers most frequently ran Telnet login and password brute-force campaigns.
| Telnet | 80.83% |
| SSH | 19.17% |
Distribution of attacked services by number of unique IP addresses of attacking devices, Q2 2020
Further communication with IoT devices that pretended to be infected (and actually traps), was much more often conducted via Telnet.
| Telnet | 71.52% |
| SSH | 28.48% |
Distribution of cybercriminals’ working sessions with Kaspersky traps, Q2 2020

Geography of IP addresses of device from which attacks on Kaspersky Telnet traps originated, Q2 2020 (download)
TOP 10 countries by location of devices from which Telnet-based attacks were carried out on Kaspersky traps
| Country | %* |
| China | 12.75% |
| Brazil | 11.88% |
| Egypt | 8.32% |
| Taiwan | 6.58% |
| Iran | 5.17% |
| India | 4.84% |
| Russia | 4.76% |
| Vietnam | 3.59% |
| Greece | 3.22% |
| USA | 2.94% |
* Share of devices from which attacks were carried out in the country out of the total number of devices
The three countries with the most devices that launched attacks on Kaspersky Telnet traps remained virtually unchanged. China (12.75%) was first, while Brazil (11.88%) and Egypt (8.32%) swapped positions.

Geography of IP addresses of device from which attacks on Kaspersky SSH traps originated, Q2 2020 (download)
TOP 10 countries by location of devices from which SSH-based attacks were carried out on Kaspersky traps
| Country | %* |
| China | 22.12% |
| USA | 10.91% |
| Vietnam | 8.20% |
| Brazil | 5.34% |
| Germany | 4.68% |
| Russia | 4.44% |
| France | 3.42% |
| India | 3.01% |
| Egypt | 2.77% |
| Singapore | 2.59% |
* Share of devices from which attacks were carried out in the country out of the total number of devices
As with Telnet, the three countries where the most attacks on SSH traps originated remained unchanged from Q1 2020: China (22.12%), U.S. (10.91%) and Vietnam (8.20%).
Threats loaded into traps
| Verdict | %* |
| Trojan-Downloader.Linux.NyaDrop.b | 32.78 |
| Backdoor.Linux.Mirai.b | 17.47 |
| HEUR:Backdoor.Linux.Mirai.b | 12.72 |
| HEUR:Backdoor.Linux.Gafgyt.a | 9.76 |
| Backdoor.Linux.Mirai.ba | 7.99 |
| HEUR:Backdoor.Linux.Mirai.ba | 4.49 |
| Backdoor.Linux.Gafgyt.bj | 2.23 |
| HEUR:Trojan-Downloader.Shell.Agent.p | 1.66 |
| Backdoor.Linux.Mirai.cn | 1.26 |
| HEUR:Backdoor.Linux.Mirai.c | 0.73 |
* Share of the malware type in the total amount of malware downloaded to IoT devices following a successful attack.
As in the first quarter, the NyaDrop Trojan led by the number of loads onto traps. The Mirai Trojan family retained its relevance in Q2 2020, occupying half of our IoT threat rankings.
Attacks via web resources
The statistics in this section are based on Web Anti-Virus, which protects users when malicious objects are downloaded from malicious/infected web pages. Malicious websites are specially created by cybercriminals; web resources with user-created content (for example, forums), as well as hacked legitimate resources, can be infected.
Countries that are sources of web-based attacks: TOP 10
The following statistics show the distribution by country of the sources of Internet attacks blocked by Kaspersky products on user computers (web pages with redirects to exploits, sites containing exploits and other malicious programs, botnet C2 centers, etc.). Any unique host could be the source of one or more web-based attacks.
To determine the geographical source of web-based attacks, domain names are matched against their actual domain IP addresses, and then the geographical location of a specific IP address (GEOIP) is established.
In Q2 2020, Kaspersky solutions defeated 899,744,810 attacks launched from online resources located in 191 countries across the globe. A total of 286,229,445 unique URLs were recognized as malicious by Web Anti-Virus components.

Distribution of web-based attack sources by country, Q2 2020 (download)
Countries where users faced the greatest risk of online infection
To assess the risk of online infection faced by users in different countries, for each country we calculated the share of Kaspersky users on whose computers Web Anti-Virus was triggered during the quarter. The resulting data provides an indication of the aggressiveness of the environment in which computers operate in different countries.
This rating only includes attacks by malicious objects that fall under the Malware class; it does not include Web Anti-Virus triggers in response to potentially dangerous or unwanted programs, such as RiskTool or adware.
| Country* | % of attacked users** | |
| 1 | Algeria | 11.2052 |
| 2 | Mongolia | 11.0337 |
| 3 | Albania | 9.8699 |
| 4 | France | 9.8668 |
| 5 | Tunisia | 9.6513 |
| 6 | Bulgaria | 9.5252 |
| 7 | Libya | 8.5995 |
| 8 | Morocco | 8.4784 |
| 9 | Greece | 8.3735 |
| 10 | Vietnam | 8.2298 |
| 11 | Somalia | 8.0938 |
| 12 | Georgia | 7.9888 |
| 13 | Malaysia | 7.9866 |
| 14 | Latvia | 7.8978 |
| 15 | UAE | 7.8675 |
| 16 | Qatar | 7.6820 |
| 17 | Angola | 7.5147 |
| 18 | Réunion | 7.4958 |
| 19 | Laos | 7.4757 |
| 20 | Mozambique | 7.4702 |
* Excluded are countries with relatively few Kaspersky users (under 10,000).
** Unique users targeted by Malware-class attacks as a share of all unique Kaspersky users in the country.
These statistics are based on detection verdicts returned by the Web Anti-Virus module that were received from users of Kaspersky products who consented to provide statistical data.
On average, 5.73% of Internet user computers worldwide experienced at least one Malware-class attack.
Geography of malicious web-based attacks, Q2 2020 (download)
Local threats
In this section, we analyze statistical data obtained from the OAS and ODS modules in Kaspersky products. It takes into account malicious programs that were found directly on users’ computers or removable media connected to computers (flash drives, camera memory cards, phones, external hard drives), or which initially made their way onto the computer in non-open form (for example, programs included in complex installers, encrypted files, etc.).
In Q2 2020, our File Anti-Virus detected 80,993,511 malware and potentially unwanted objects.
Countries where users faced the highest risk of local infection
For each country, we calculated the percentage of Kaspersky users on whose computers File Anti-Virus was triggered during the reporting period. These statistics reflect the level of personal computer infection in different countries.
Note that the rating includes only Malware-class attacks; it does not include File Anti-Virus triggers in response to potentially dangerous or unwanted programs, such as RiskTool or adware.
| Country* | % of attacked users** | |
| 1 | Turkmenistan | 48.0224 |
| 2 | Uzbekistan | 42.2632 |
| 3 | Tajikistan | 42.1279 |
| 4 | Ethiopia | 41.7213 |
| 5 | Afghanistan | 40.6278 |
| 6 | Myanmar | 39.1377 |
| 7 | Burkina Faso | 37.4560 |
| 8 | Benin | 37.4390 |
| 9 | China | 36.7346 |
| 10 | Kyrgyzstan | 36.0847 |
| 11 | Vietnam | 35.4327 |
| 12 | Mauritania | 34.2613 |
| 13 | Laos | 34.0350 |
| 14 | Mongolia | 33.6261 |
| 15 | Burundi | 33.4323 |
| 16 | Belarus | 33.0937 |
| 17 | Guinea | 33.0097 |
| 18 | Mali | 32.9902 |
| 19 | Togo | 32.6962 |
| 20 | Cameroon | 32.6347 |
* Excluded are countries with relatively few Kaspersky users (under 10,000).
** Unique users on whose computers Malware-class local threats were blocked, as a share of all unique users of Kaspersky products in the country.
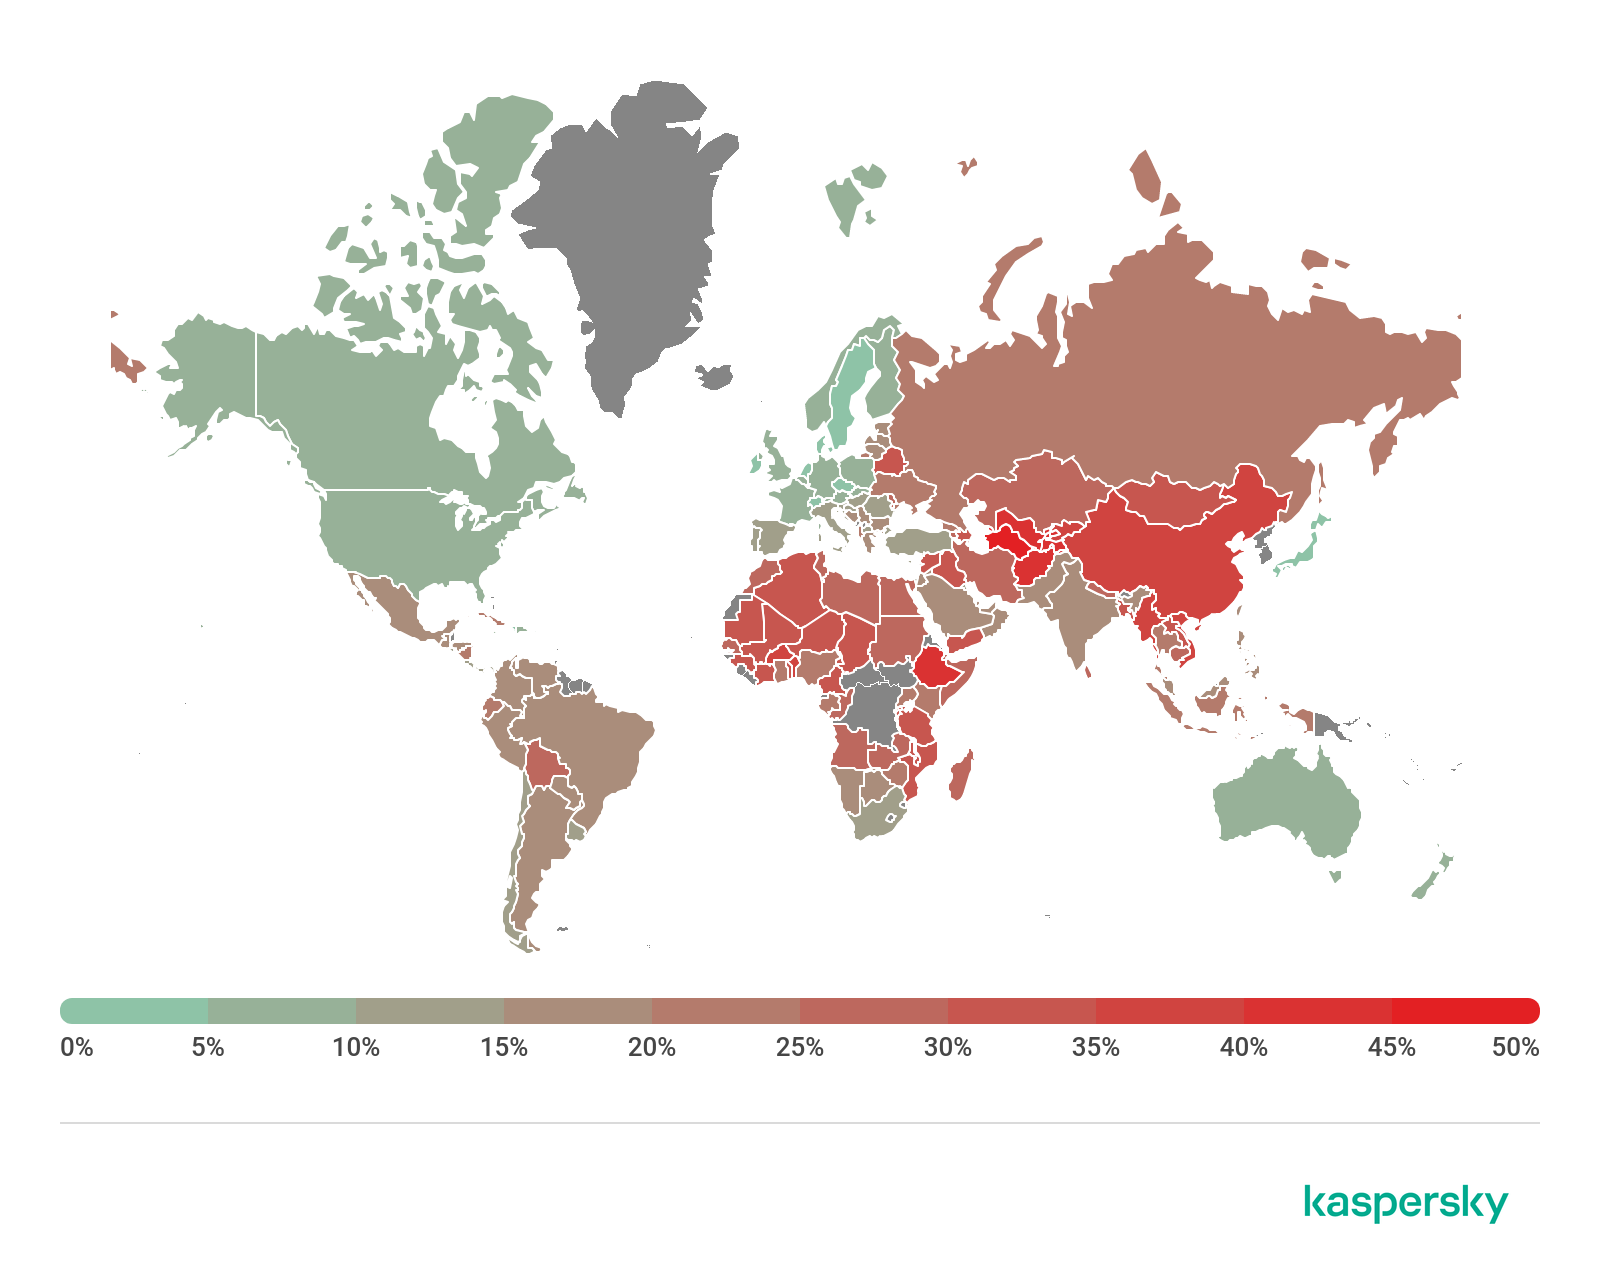
Geography of local infection attempts, Q2 2020 (download)
Overall, 17.05% of user computers globally faced at least one Malware-class local threat during Q2 2020.
Table of Contents
- Quarterly figures
- Financial threats
- Ransomware programs
- Quarterly trend highlights
- Number of new modifications
- Number of users attacked by ransomware Trojans
- Geography of attacks
- Top 10 most common families of ransomware Trojans
- Miners
- Vulnerable applications used by cybercriminals during cyberattacks
- Attacks on Apple macOS
- IoT attacks
- Attacks via web resources
- Countries that are sources of web-based attacks: TOP 10
- Countries where users faced the greatest risk of online infection
- Local threats
From the same authors


In the same category


IT threat evolution Q2 2020. PC statistics