

Q1 figures
According to KSN:
- Kaspersky Lab solutions blocked 796,806,112 attacks launched from online resources located in 194 countries across the globe.
- 282,807,433 unique URLs were recognized as malicious by Web Anti-Virus components.
- Attempted infections by malware designed to steal money via online access to bank accounts were logged on the computers of 204,448 users.
- Ransomware attacks were registered on the computers of 179,934 unique users.
- Our File Anti-Virus logged 187,597,494 unique malicious and potentially unwanted objects.
- Kaspersky Lab products for mobile devices detected:
- 1,322,578 malicious installation packages
- 18,912 installation packages for mobile banking Trojans
- 8,787 installation packages for mobile ransomware Trojans
Mobile threats
Q1 events
In Q1 2018, DNS-hijacking, a new in-the-wild method for spreading mobile malware on Android devices, was identified. As a result of hacked routers and modified DNS settings, users were redirected to IP addresses belonging to the cybercriminals, where they were prompted to download malware disguised, for example, as browser updates. That is how the Korean banking Trojan Wroba was distributed.
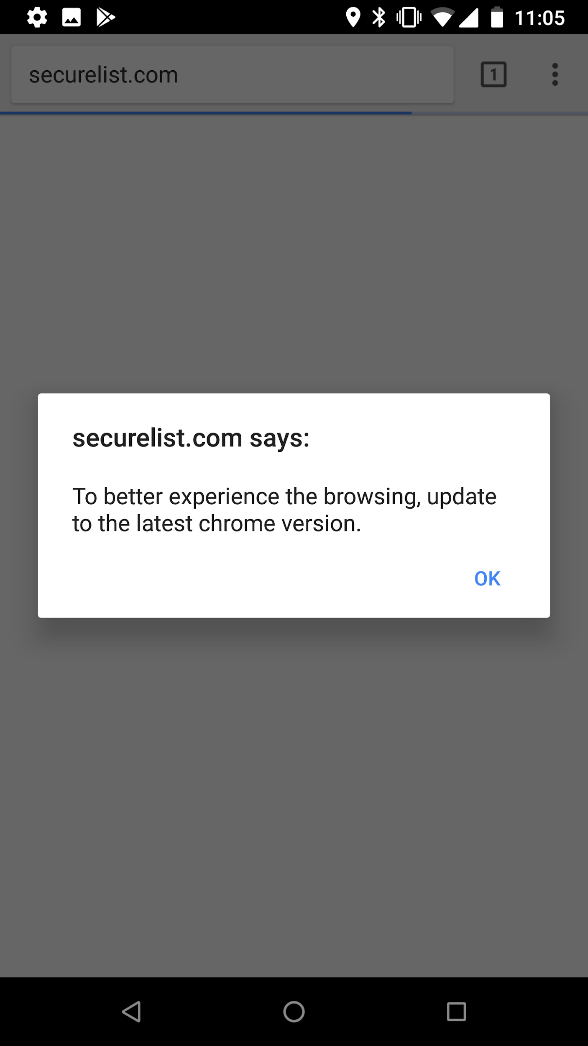
This malicious resource shows a fake window while displaying the legitimate site in the address bar
It wasn’t a drive-by-download case, since the success of the attack largely depended on actions by the victim, such as installing and running the Trojan. But it’s interesting to note that some devices (routers) were used to attack other devices (smartphones), all sprinkled with social engineering to make it more effective.
However, a far greater splash in Q1 was caused by the creators of a seemingly legitimate app called GetContact.
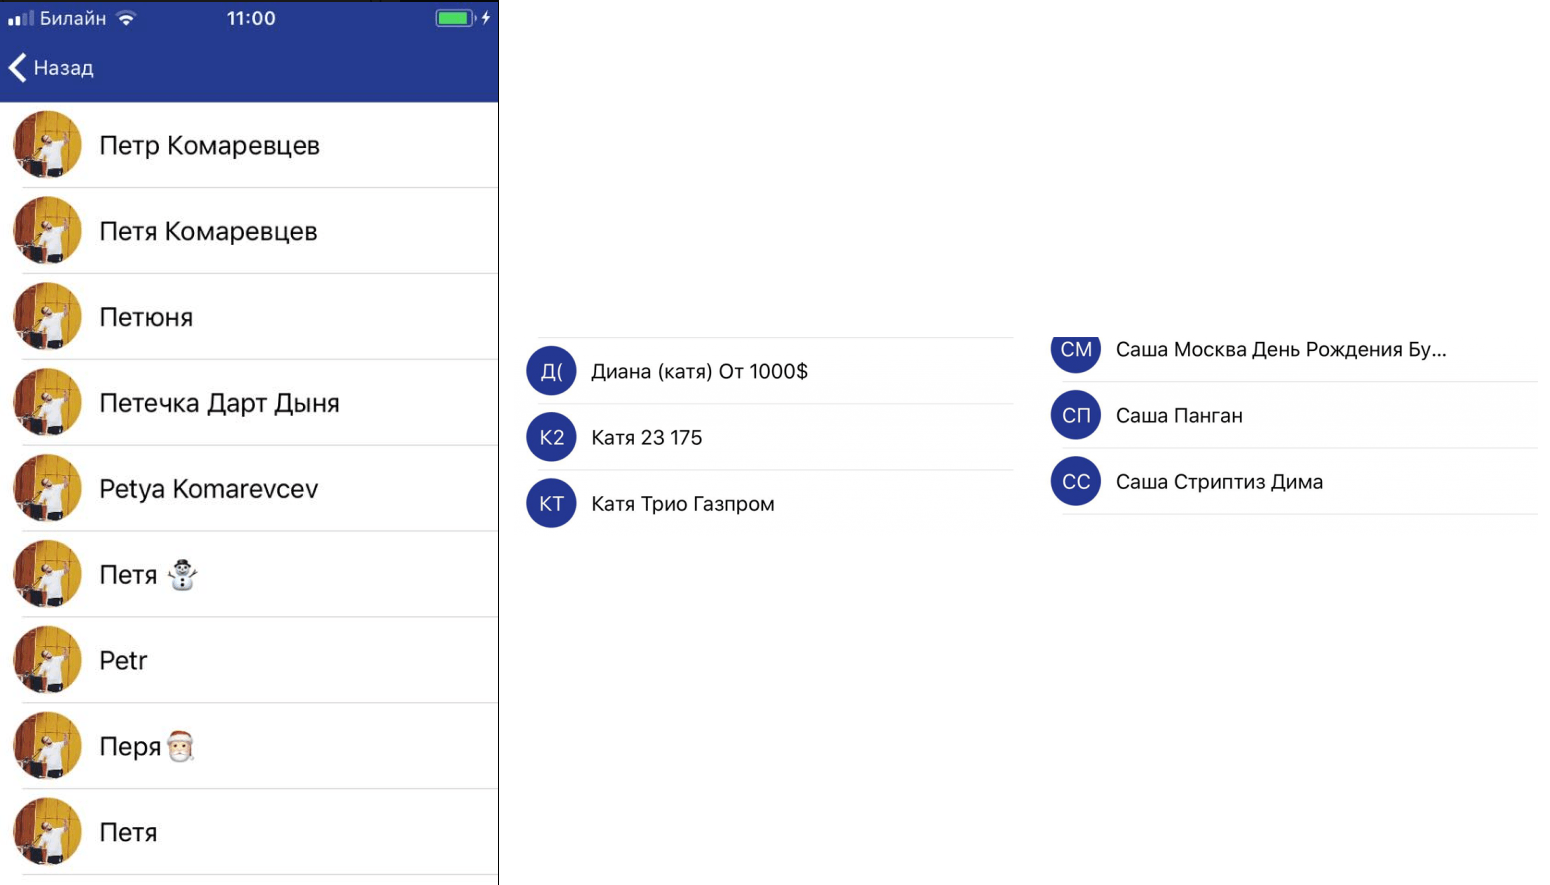
Some backstory to begin with. Various families and classes of malicious apps are known to gather data from infected devices: it could be a relatively harmless IMEI number, phone book contents, SMS correspondence, or even WhatsApp chats. All the above (and much more besides) is personal information that only the mobile phone owner should have control over. However, the creators of GetContact concocted a license agreement giving them the right to download the user’s phone book to their servers and grant all their subscribers access to it. As a result, anyone could find out what name GetContact users had saved their phone number under, often with sad consequences. Let’s hope that the app creators had the noble intention of protecting users from telephone spam and fraudulent calls, but simply chose the wrong means to do so.
Mobile threat statistics
In Q1 2018, Kaspersky Lab detected 1,322,578 malicious installation packages, down 11% against the previous quarter.

Number of detected malicious installation packages, Q2 2017 – Q1 2018
Distribution of detected mobile apps by type

Distribution of newly detected mobile apps by type, Q4 2017 and Q1 2018
Among all the threats detected in Q1 2018, the lion’s share belonged to potentially unwanted RiskTool apps (49.3%); compared to the previous quarter, their share fell by 5.5%. Members of the RiskTool.AndroidOS.SMSreg family contributed most to this indicator.
Second place was taken by Trojan-Dropper threats (21%), whose share doubled. Most detected files of this type came from the Trojan-Dropper.AndroidOS.Piom family.
Advertising apps, which ranked second in Q4 2017, dropped a place—their share decreased by 8%, accounting for 11% of all detected threats.
On a separate note, Q1 saw a rise in the share of mobile banking threats. This was due to the mass distribution of Trojan-Banker.AndroidOS.Faketoken.z.
TOP 20 mobile malware
Note that this malware rating does not include potentially dangerous or unwanted programs such as RiskTool and Adware.
| Verdict | %* | |
| 1 | DangerousObject.Multi.Generic | 70.17 |
| 2 | Trojan.AndroidOS.Boogr.gsh | 12.92 |
| 3 | Trojan.AndroidOS.Agent.rx | 5.55 |
| 4 | Trojan-Dropper.AndroidOS.Lezok.p | 5.23 |
| 5 | Trojan-Dropper.AndroidOS.Hqwar.ba | 2.95 |
| 6 | Trojan.AndroidOS.Triada.dl | 2.94 |
| 7 | Trojan-Dropper.AndroidOS.Hqwar.i | 2.51 |
| 8 | Trojan.AndroidOS.Piom.rfw | 2.13 |
| 9 | Trojan-Dropper.AndroidOS.Lezok.t | 2.06 |
| 10 | Trojan.AndroidOS.Piom.pnl | 1.78 |
| 11 | Trojan-Dropper.AndroidOS.Agent.ii | 1.76 |
| 12 | Trojan-SMS.AndroidOS.FakeInst.ei | 1.64 |
| 13 | Trojan-Dropper.AndroidOS.Hqwar.gen | 1.50 |
| 14 | Trojan-Ransom.AndroidOS.Zebt.a | 1.48 |
| 15 | Trojan.AndroidOS.Piom.qmx | 1.47 |
| 16 | Trojan.AndroidOS.Dvmap.a | 1.40 |
| 17 | Trojan-SMS.AndroidOS.Agent.xk | 1.35 |
| 18 | Trojan.AndroidOS.Triada.snt | 1.24 |
| 19 | Trojan-Dropper.AndroidOS.Lezok.b | 1.22 |
| 20 | Trojan-Dropper.AndroidOS.Tiny.d | 1.22 |
* Unique users attacked by the relevant malware as a percentage of all users of Kaspersky Lab’s mobile antivirus that were attacked.
As before, first place in our TOP 20 went to DangerousObject.Multi.Generic (70.17%), the verdict we use for malware detected using cloud technologies. Cloud technologies work when the anti-virus databases lack data for detecting a piece of malware, but the cloud of the anti-virus company already contains information about the object. This is basically how the latest malicious programs are detected.
In second place was Trojan.AndroidOS.Boogr.gsh (12.92%). This verdict is given to files recognized as malicious by our system based on machine learning.
Third was Trojan.AndroidOS.Agent.rx (5.55%). Operating in background mode, this Trojan’s task is to covertly visit web pages as instructed by its C&C.
Fourth and fifth places went to the Trojan matryoshkas Trojan-Dropper.AndroidOS.Lezok.p (5.2%) and Trojan-Dropper.AndroidOS.Hqwar.ba (2.95%), respectively. Note that in Q1 threats like Trojan-Dropper effectively owned the TOP 20, occupying eight positions in the rating. The main tasks of such droppers are to drop a payload on the victim, avoid detection by security software, and complicate the reverse engineering process. In the case of Lezok, an aggressive advertising app acts as the payload, while Hqwar can conceal a banking Trojan or ransomware.
Sixth place in the rating was taken by the unusual Trojan Triada.dl (2.94%) from the Trojan.AndroidOS.Triada family of modular-designed malware, which we have written about many times. The Trojan was notable for its highly sophisticated attack vector: it modified the main system library libandroid_runtime.so so that malicious code started when any debugging output was written to the system event log. Devices with the modified library ended up on store shelves, thus ensuring that the infection began early. The capabilities of Triada.dl are almost limitless: it can be embedded in apps already installed and pinch data from them, and it can show the user fake data in “clean” apps.
The Trojan ransomware Trojan-Trojan-Ransom.AndroidOS.Zebt.a (1.48%) finished 14th. It features a quaint set of functions, including hiding the icon at startup and requesting device administrator rights to counteract deletion. Like other such mobile ransomware, the malware is distributed under the guise of a porn app.
Another interesting resident in the TOP 20 is Trojan-SMS.AndroidOS.Agent.xk (1.35%), which operates like the SMS Trojans of 2011. The malware displays a welcome screen offering various services, generally access to content. At the bottom in fine print it is written that the services are fee-based and subscription to them is via SMS.
Geography of mobile threats
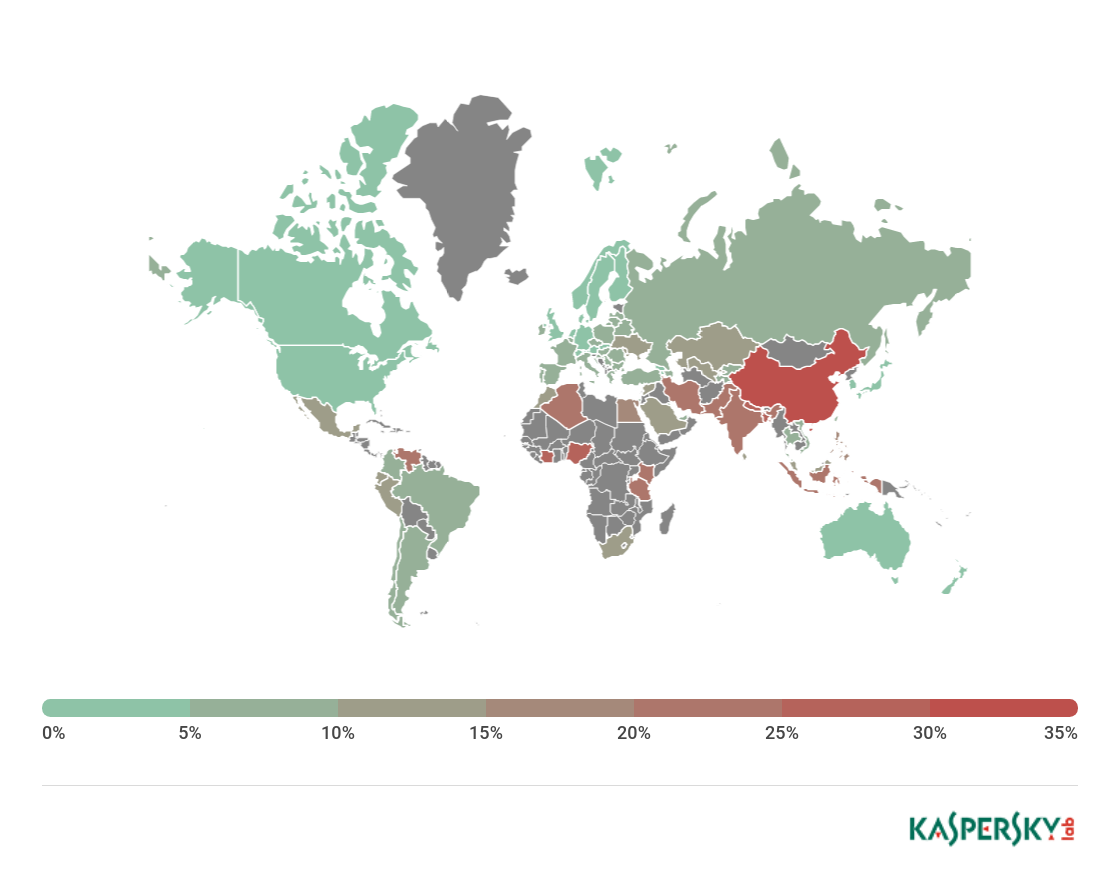
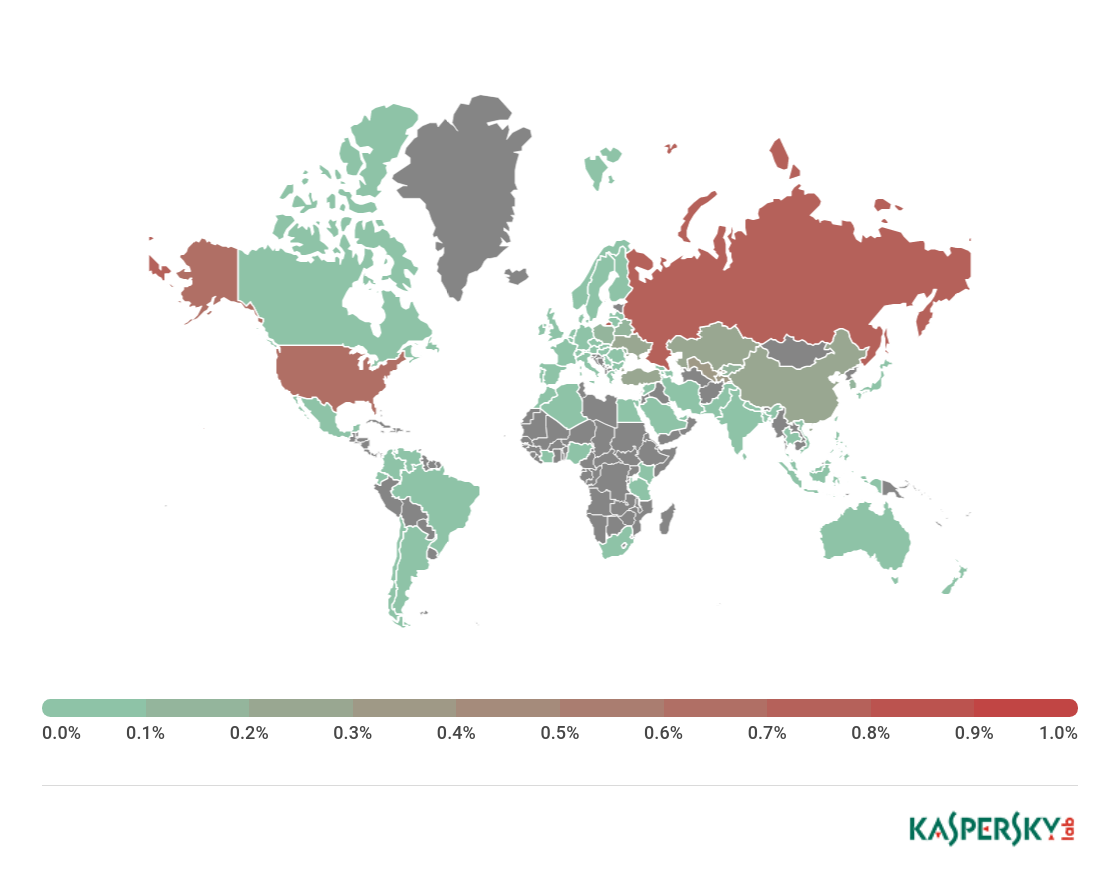
Map of attempted infections using mobile malware in Q1 2018 (percentage of attacked users in the country)
TOP 10 countries by share of users attacked by mobile malware:
| Country* | %** | |
| 1 | China | 34.43 |
| 2 | Bangladesh | 27.53 |
| 3 | Nepal | 27.37 |
| 4 | Ivory Coast | 27.16 |
| 5 | Nigeria | 25.36 |
| 6 | Algeria | 24.13 |
| 7 | Tanzania | 23.61 |
| 8 | India | 23.27 |
| 9 | Indonesia | 22.01 |
| 10 | Kenya | 21.45 |
* Excluded from the rating are countries with relatively few users of Kaspersky Lab’s mobile antivirus (under 10,000).
** Unique users attacked in the country as a percentage of all users of Kaspersky Lab’s mobile antivirus in the country.
In Q1 2018, China (34.43%) topped the list by share of mobile users attacked. Note that China is a regular fixture in the TOP 10 rating by number of attacked users: It came sixth in 2017, and fourth in 2016. As in 2017, second place was claimed by Bangladesh (27.53%). The biggest climber was Nepal (27.37%), rising from ninth place last year to third.
Russia (8.18%) this quarter was down in 39th spot, behind Qatar (8.22%) and Vietnam (8.48%).
The safest countries (based on proportion of mobile users attacked) are Denmark (1.85%) and Japan (1%).
Mobile banking Trojans
In the reporting period, we detected 18,912 installation packages for mobile banking Trojans, which is 1.3 times more than in Q4 2017.
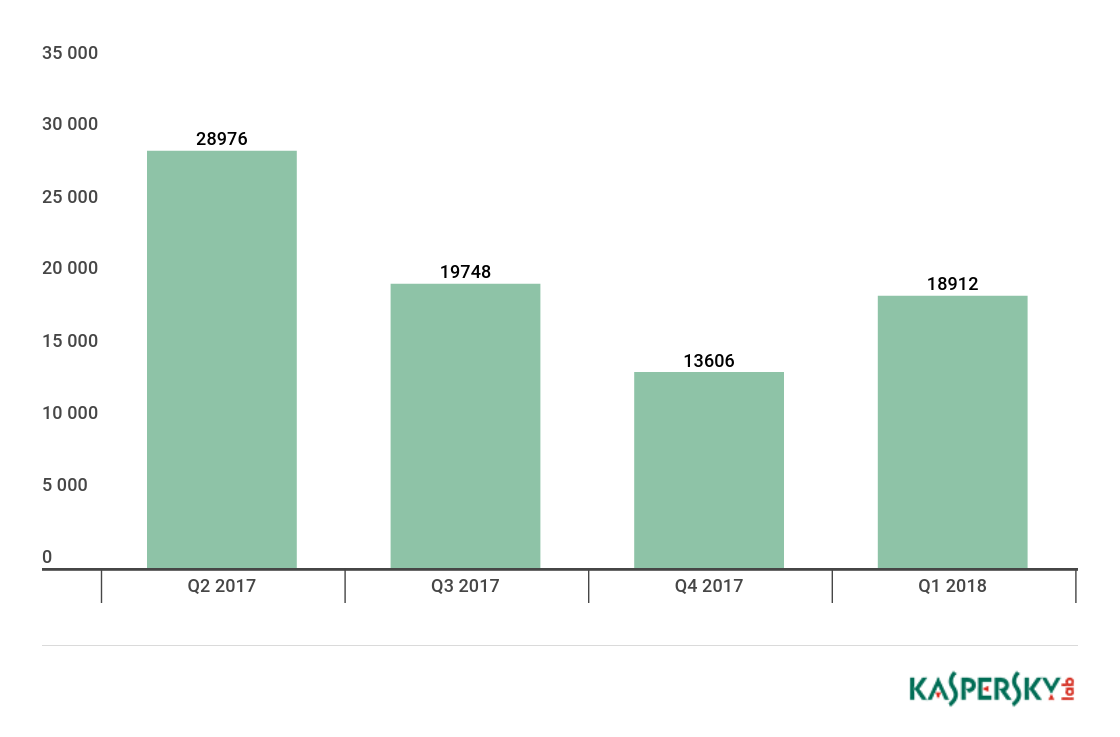
Number of installation packages for mobile banking Trojans detected by Kaspersky Lab, Q2 2017 – Q1 2018
| Verdict | %* | |
| 1 | Trojan-Banker.AndroidOS.Asacub.bj | 12.36 |
| 2 | Trojan-Banker.AndroidOS.Svpeng.q | 9.17 |
| 3 | Trojan-Banker.AndroidOS.Asacub.bk | 7.82 |
| 4 | Trojan-Banker.AndroidOS.Svpeng.aj | 6.63 |
| 5 | Trojan-Banker.AndroidOS.Asacub.e | 5.93 |
| 6 | Trojan-Banker.AndroidOS.Hqwar.t | 5.38 |
| 7 | Trojan-Banker.AndroidOS.Faketoken.z | 5.15 |
| 8 | Trojan-Banker.AndroidOS.Svpeng.ai | 4.54 |
| 9 | Trojan-Banker.AndroidOS.Agent.di | 4.31 |
| 10 | Trojan-Banker.AndroidOS.Asacub.ar | 3.52 |
* Unique users attacked by the relevant malware as a percentage of all users of Kaspersky Lab’s mobile antivirus that were attacked by banking threats.
The most popular mobile banking Trojan in Q1 was Asacub.bj (12.36%), nudging ahead of second-place Svpeng.q (9.17%). Both these Trojans use phishing windows to steal bank card and authentication data for online banking. They also steal money through SMS services, including mobile banking.
Note that the TOP 10 mobile banking threats in Q1 is largely made up of members of the Asacub (4 out of 10) and Svpeng (3 out of 10) families. However, Trojan-Banker.AndroidOS.Faketoken.z also entered the list. This Trojan has extensive spy capabilities: it can install other apps, intercept incoming messages (or create them on command), make calls and USSD requests, and, of course, open links to phishing pages.
Geography of mobile banking threats in Q1 2018 (percentage of attacked users)
TOP 10 countries by share of users attacked by mobile banking Trojans
| Country* | %** | |
| 1 | Russia | 0.74 |
| 2 | USA | 0.65 |
| 3 | Tajikistan | 0.31 |
| 4 | Uzbekistan | 0.30 |
| 5 | China | 0.26 |
| 6 | Turkey | 0.22 |
| 7 | Ukraine | 0.22 |
| 8 | Kazakhstan | 0.22 |
| 9 | Poland | 0.17 |
| 10 | Moldova | 0.16 |
* Excluded from the rating are countries with relatively few users of Kaspersky Lab’s mobile antivirus (under 10,000).
** Unique users attacked by mobile banking Trojans in the country as a percentage of all users of Kaspersky Lab’s mobile antivirus in this country.
The Q1 2018 rating was much the same as the situation observed throughout 2017: Russia (0.74%) remained top.
The US (0.65%) and Tajikistan (0.31%) took silver and bronze, respectively. The most popular mobile banking Trojans in these countries were various modifications of the Trojan-Banker.AndroidOS.Svpeng family, as well Trojan-Banker.AndroidOS.Faketoken.z.
Mobile ransomware Trojans
In Q1 2018, we detected 8,787 installation packages for mobile ransomware Trojans, which is just over half the amount seen in the previous quarter and 22 times less than in Q2 2017. This significant drop is largely because attackers began to make more use of droppers in an attempt to hinder detection and hide the payload. As a result, such malware is detected as a dropper (for example, from the Trojan-Dropper.AndroidOS.Hqwar family), even though it may contain mobile ransomware or a “banker.”

Number of installation packages for mobile ransomware Trojans detected by Kaspersky Lab (Q2 2017 – Q1 2018)
Note that despite the decline in their total number, ransomware Trojans remain a serious threat — technically they are now far more advanced and dangerous. For instance, Trojan-Trojan-Ransom.AndroidOS.Svpeng acquires device administrator rights and locks the smartphone screen with a PIN if an attempt is made to remove them. If no PIN is set (could also be a graphic, numeric, or biometric lock), the device is locked. In this case, the only way to restore the smartphone to working order is to reset the factory settings.
The most widespread mobile ransomware in Q1 was Trojan-Ransom.AndroidOS.Zebt.a — it was encountered by more than half of all users. In second place was Trojan-Ransom.AndroidOS.Fusob.h, having held pole position for a long time. The once popular Trojan-Ransom.AndroidOS.Svpeng.ab only managed fifth place, behind Trojan-Ransom.AndroidOS.Egat.d and Trojan-Ransom.AndroidOS.Small.snt. Incidentally, Egat.d is a pared-down version of Zebt.a, both have the same creators.
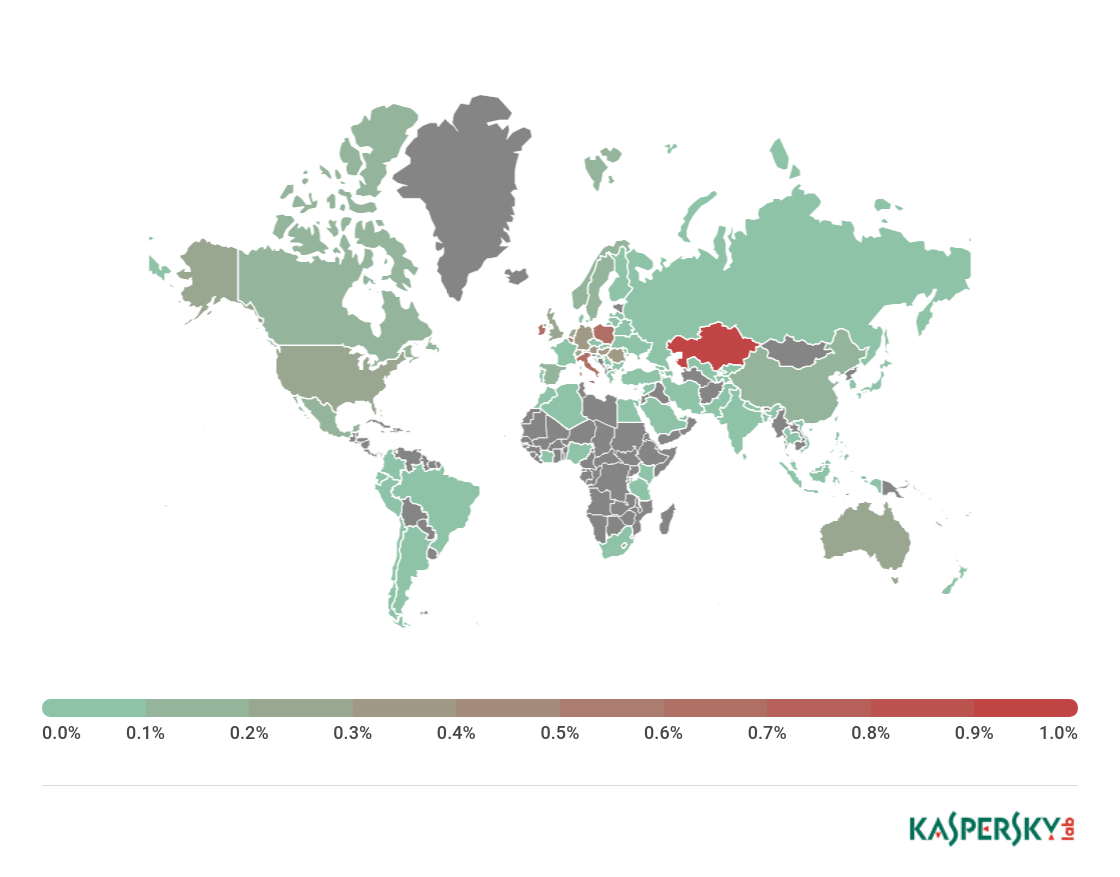
Geography of mobile ransomware Trojans in Q1 2018 (percentage of attacked users)
TOP 10 countries by share of users attacked by mobile ransomware Trojans:
| Country* | %** | |
| 1 | Kazakhstan | 0.99 |
| 2 | Italy | 0.64 |
| 3 | Ireland | 0.63 |
| 4 | Poland | 0.61 |
| 5 | Belgium | 0.56 |
| 6 | Austria | 0.38 |
| 7 | Romania | 0.37 |
| 8 | Hungary | 0.34 |
| 9 | Germany | 0.33 |
| 10 | Switzerland | 0.29 |
* Excluded from the rating are countries where the number of users of Kaspersky Lab’s mobile antivirus is relatively small (fewer than 10,000)
** Unique users in the country attacked by mobile ransomware Trojans as a percentage of all users of Kaspersky Lab’s mobile antivirus in the country.
First place in the TOP 10 again went to Kazakhstan (0.99%); the most active family in this country was Trojan-Ransom.AndroidOS.Small. Second came Italy (0.64%), where most attacks were the work of Trojan-Ransom.AndroidOS.Zebt.a, which is also the most popular mobile ransomware in third-place Ireland (0.63%).
Vulnerable apps used by cybercriminals
In Q1 2018, we observed some major changes in the distribution of exploits launched against users. The share of Microsoft Office exploits (47.15%) more than doubled compared with the average for 2017. This is also twice the quarterly score of the permanent leader in recent years — browser exploits (23.47%). The reason behind the sharp increase is clear: over the past year, so many different vulnerabilities have been found and exploited in Office applications, that it can only be compared to amount of Adobe Flash vulnerabilities found in the past. But lately the share of Flash exploits has been decreasing (2.57% in Q1), since Adobe and Microsoft are doing all they can to hinder the exploitation of Flash Player.
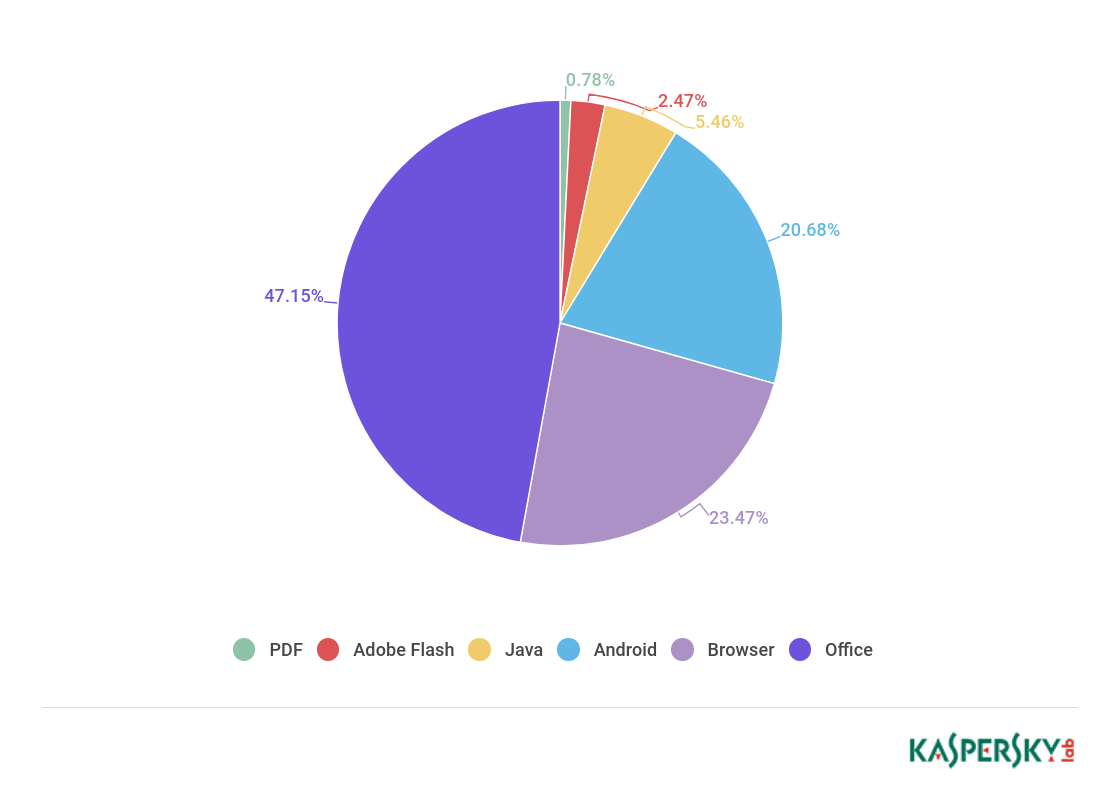
Distribution of exploits used in attacks by type of application attacked, Q1 2018
The most frequently used vulnerability in Microsoft Office in Q1 was CVE-2017-11882 — a stack overflow-type vulnerability in Equation Editor, a rather old component in the Office suite. Attacks using this vulnerability make up approximately one-sixth of all exploit-based attacks. This is presumably because CVE-2017-11882 exploitation is fairly reliable. Plus, the bytecode processed by Equation Editor allows the use of various obfuscations, which increases the chances of bypassing the protection and launching a successful attack (Kaspersky Lab’s Equation file format parser easily handles all currently known obfuscations). Another vulnerability found in Equation Editor this quarter was CVE-2018-0802. It too is exploited, but less actively. The following exploits for logical vulnerabilities in Office found in 2017 were also encountered: CVE-2017-8570, CVE-2017-8759, CVE-2017-0199. But even their combined number of attacks does not rival CVE-2017-11882.
As for zero-day exploits in Q1, CVE-2018-4878 was reported by a South Korean CERT and several other sources in late January. This is an Adobe Flash vulnerability originally used in targeted attacks (supposedly by the Scarcruft group). At the end of the quarter, an exploit for it appeared in the widespread GreenFlash Sundown, Magnitude, and RIG exploit kits. In targeted attacks, a Flash object with the exploit was embedded in a Word document, while exploit kits distribute it via web pages.
Large-scale use of network exploits using vulnerabilities patched by the MS17-010 update (those that exploited EternalBlue and other vulnerabilities from the Shadow Brokers leak) also continued throughout the quarter. MS17-010 exploits account for more than 25% of all network attacks that we registered.
Malicious programs online (attacks via web resources)
The statistics in this chapter are based on Web Anti-Virus, which protects users when malicious objects are downloaded from malicious/infected web pages. Malicious websites are specially created by cybercriminals; web resources with user-created content (for example, forums), as well as hacked legitimate resources, can be infected.
Online threats in the financial sector
Q1 events
In early 2018, the owners of the Trojan Dridex were particularly active. Throughout its years-long existence, this malware has acquired a solid infrastructure. Today, its main line of activity is compromising credentials for online banking services with subsequent theft of funds from bank accounts. Its accomplice is fellow banking Trojan Emotet. Discovered in 2014, this malware also belongs to a new breed of banking Trojans developed from scratch. However, it was located on the same network infrastructure as Dridex, suggesting a close link between the two families. But now Emotet has lost its banking functions and is used by attackers as a spam bot and loader with Dridex as the payload. Early this year, it was reported that the encryptor BitPaymer (discovered last year) was developed by the same group behind Dridex. As a result, the malware was rebranded FriedEx.
Q1 saw the arrest of the head of the criminal group responsible for the Carbanak and Cobalt malware attacks, it was reported by Europol. Starting in 2013, the criminal group attacked more than 40 organizations, causing damage to the financial industry estimated at more than EUR 1 billion. The main attack vector was to penetrate the target organization’s network by sending employees spear-phishing messages with malicious attachments. Having penetrated the internal network via the infected computers, the cybercriminals gained access to the ATM control servers, and through them to the ATMs themselves. Access to the infrastructure, servers, and ATMs allowed the cybercriminals to dispense cash without the use of bank cards, transfer money from the organisation to criminal accounts, and inflate bank balances with money mules being used to collect the proceeds.
Financial threat statistics
These statistics are based on detection verdicts of Kaspersky Lab products received from users who consented to provide statistical data. As of Q1 2017, the statistics include malicious programs for ATMs and POS terminals, but do not include mobile threats.
In Q1 2018, Kaspersky Lab solutions blocked attempts to launch one or more malicious programs designed to steal money from bank accounts on the computers of 204,448 users.

Number of unique users attacked by financial malware, Q1 2018
Geography of attacks
To evaluate and compare the risk of being infected by banking Trojans and ATM/POS malware worldwide, for each country we calculated the share of users of Kaspersky Lab products that faced this threat during the reporting period out of all users of our products in that country.
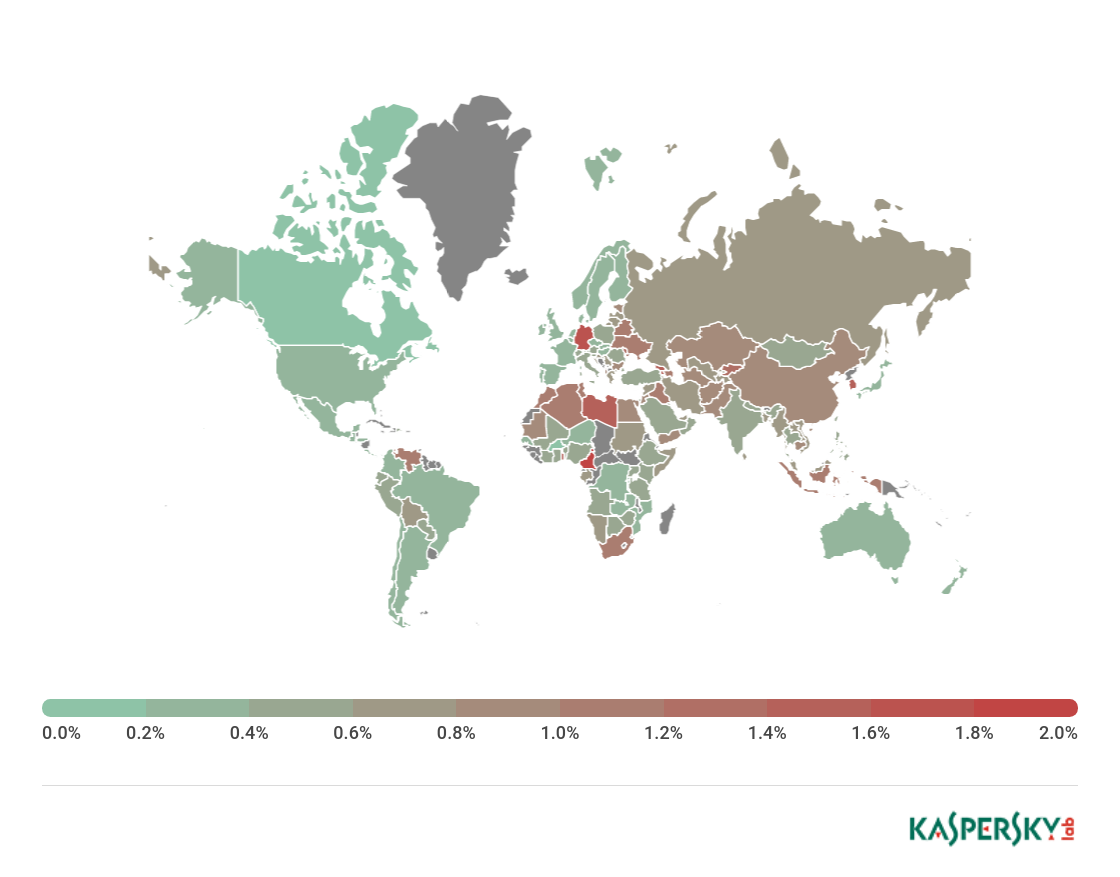
Geography of banking malware attacks in Q1 2018 (percentage of attacked users)
TOP 10 countries by percentage of attacked users
| Country* | % of users attacked** | |
| 1 | Cameroon | 2.1 |
| 2 | Germany | 1.7 |
| 3 | South Korea | 1.5 |
| 4 | Libya | 1.5 |
| 5 | Togo | 1.5 |
| 6 | Armenia | 1.4 |
| 7 | Georgia | 1.4 |
| 8 | Moldova | 1.2 |
| 9 | Kyrgyzstan | 1.2 |
| 10 | Indonesia | 1.1 |
These statistics are based on Anti-Virus detection verdicts received from users of Kaspersky Lab products who consented to provide statistical data.
Excluded are countries with relatively few Kaspersky Lab’ product users (under 10,000).
** Unique users whose computers were targeted by banking Trojans as a percentage of all unique users of Kaspersky Lab products in the country.
TOP 10 banking malware families
TOP 10 malware families used to attack online banking users in Q1 2018 (by share of attacked users):
| Name | Verdicts* | % of attacked users** | ||
| 1 | Zbot | Trojan.Win32. Zbot | 28.0% | |
| 2 | Nymaim | Trojan.Win32. Nymaim | 20.3% | |
| 3 | Caphaw | Backdoor.Win32. Caphaw | 15.2% | |
| 4 | SpyEye | Backdoor.Win32. SpyEye | 11.9% | |
| 5 | NeutrinoPOS | Trojan-Banker.Win32.NeutrinoPOS | 4.5% | |
| 6 | Emotet | Backdoor.Win32. Emotet | 2.4% | |
| 7 | Neurevt | Trojan.Win32. Neurevt | 2.3% | |
| 8 | Shiz | Backdoor.Win32. Shiz | 2.1% | |
| 9 | Gozi | Trojan.Win32. Gozi | 1.9% | |
| 10 | ZAccess | Backdoor.Win32. ZAccess | 1.3% |
* Detection verdicts of Kaspersky Lab products. The information was provided by Kaspersky Lab product users who consented to provide statistical data.
** Unique users attacked by this malware as a percentage of all users attacked by financial malware.
In Q1 2018, TrickBot departed the rating to be replaced by Emotet (2.4%), also known as Heodo. Trojan.Win32.Zbot (28%) and Trojan.Win32.Nymaim (20.3%) remain in the lead, while Trojan.Win32.Neurevt (2.3%), also known as Betabot, suffered a major slide. Meanwhile, Caphaw (15.2%) and NeutrinoPOS (4.5%) climbed significantly, as did their Q1 activity.
Cryptoware programs
Q1 events
Q1 2018 passed without major incidents or mass cryptoware epidemics. The highlight was perhaps the emergence and widespread occurrence of a new Trojan called GandCrab. Notable features of the malware include:
- Use of C&C servers in the .bit domain zone (this top-level domain is supported by an alternative decentralized DNS system based on Namecoin technology)
- Ransom demand in the cryptocurrency Dash
GandCrab was first detected in January. The cybercriminals behind it used spam emails and exploit kits to deliver the cryptoware to victim computers.
The RaaS (ransomware as a service) distribution model continues to attract malware developers. In February, for example, there appeared a new piece of ransomware called Data Keeper, able to be distributed by any cybercriminal who so desired. Via a special resource on the Tor network, the creators of Data Keeper made it possible to generate executable files of the Trojan for subsequent distribution by “affilate program” participants. A dangerous feature of this malware is its ability to automatically propagate inside a local network. Despite this, Data Keeper did not achieve widespread distribution in Q1.
One notable success in the fight against cryptoware came from Europe: with the assistance of Kaspersky Lab, Belgian police managed to locate and confiscate a server used by the masterminds behind the Trojan Cryakl. Following the operation, Kaspersky Lab was given several private RSA keys required to decrypt files encrypted with certain versions of the Trojan. As a result, we were able to develop a tool to assist victims.
Number of new modifications
In Q1 2018, there appeared several new cryptors, but only one, GandCrab, was assigned a new family in our classification. The rest, which are not widely spread, continue to be detected with generic verdicts.

Number of new cryptoware modifications, Q2 2017 – Q1 2018
The number of new modifications fell sharply against previous quarters. The trend indicates that cybercriminals using this type of malware are becoming less active.
Number of users attacked by Trojan cryptors
During the reporting period, Kaspersky Lab products blocked cryptoware attacks on the computers of 179,934 unique users. Despite fewer new Trojan modifications, the number of attacked users did not fall against Q3.
Number of unique users attacked by cryptors, Q1 2018
Geography of attacks

TOP 10 countries attacked by Trojan cryptors
| Country* | % of users attacked by cryptors** | |
| 1 | Uzbekistan | 1.12 |
| 2 | Angola | 1.11 |
| 3 | Vietnam | 1.04 |
| 4 | Venezuela | 0.95 |
| 5 | Indonesia | 0.95 |
| 6 | Pakistan | 0.93 |
| 7 | China | 0.87 |
| 8 | Azerbaijan | 0.75 |
| 9 | Bangladesh | 0.70 |
| 10 | Mongolia | 0.64 |
* Excluded are countries with relatively few Kaspersky Lab users (under 50,000).
** Unique users whose computers were attacked by Trojan cryptors as a percentage of all unique users of Kaspersky Lab products in the country.
The makeup of the rating differs markedly from 2017. That said, most positions were again filled by Asian countries, while Europe did not have a single representative in the TOP 10 countries attacked by cryptors.
Despite not making the TOP 10 last year, Uzbekistan (1.12%) and Angola (1.11%) came first and second. Vietnam (1.04%) moved from second to third, Indonesia (0.95%) from third to fifth, and China (0.87%) from fifth to seventh, while Venezuela (0.95%) climbed from eighth to fourth.
TOP 10 most widespread cryptor families
| Name | Verdicts* | % of attacked users** | |||
| 1 | WannaCry | Trojan-Ransom.Win32.Wanna | 38.33 | ||
| 2 | PolyRansom/VirLock | Virus.Win32.PolyRansom | 4.07 | ||
| 3 | Cerber | Trojan-Ransom.Win32.Zerber | 4.06 | ||
| 4 | Cryakl | Trojan-Ransom.Win32.Cryakl | 2.99 | ||
| 5 | (generic verdict) | Trojan-Ransom.Win32.Crypren | 2.77 | ||
| 6 | Shade | Trojan-Ransom.Win32.Shade | 2.61 | ||
| 7 | Purgen/GlobeImposter | Trojan-Ransom.Win32.Purgen | 1.64 | ||
| 8 | Crysis | Trojan-Ransom.Win32.Crusis | 1.62 | ||
| 9 | Locky | Trojan-Ransom.Win32.Locky | 1.23 | ||
| 10 | (generic verdict) | Trojan-Ransom.Win32.Gen | 1.15 | ||
* Statistics are based on detection verdicts of Kaspersky Lab products. The information was provided by Kaspersky Lab product users who consented to provide statistical data.
** Unique Kaspersky Lab users attacked by a particular family of Trojan cryptors as a percentage of all users attacked by Trojan cryptors.
This quarter, the rating is again topped by WannaCry (38.33%), extending its already impressive lead. Second place was claimed by PolyRansom (4.07%), also known as VirLock, a worm that’s been around for a while. This malware substitutes user files with modified instances of its own body, and places victim data inside these copies in an encrypted format. Statistics show that a new modification detected in December immediately began to attack user computers.
The remaining TOP 10 positions are taken by Trojans already known from previous reports: Cerber, Cryakl, Purgen, Crysis, Locky, and Shade.
Countries that are sources of web-based attacks: TOP 10
The following statistics show the distribution by country of the sources of Internet attacks blocked by Kaspersky Lab products on user computers (web pages with redirects to exploits, sites containing exploits and other malicious programs, botnet C&C centers, etc.). Any unique host could be the source of one or more web-based attacks.
To determine the geographical source of web-based attacks, domain names are matched against their actual domain IP addresses, and then the geographical location of a specific IP address (GEOIP) is established.
In Q1 2018, Kaspersky Lab solutions blocked 796,806,112 attacks launched from Internet resources located in 194 countries worldwide. 282,807,433 unique URLs were recognized as malicious by Web Anti-Virus components. These indicators are significantly higher than in previous quarters. This is largely explained by the large number of triggers in response to attempts to download web miners, which came to prominence towards the end of last year and continue to outweigh other web threats.
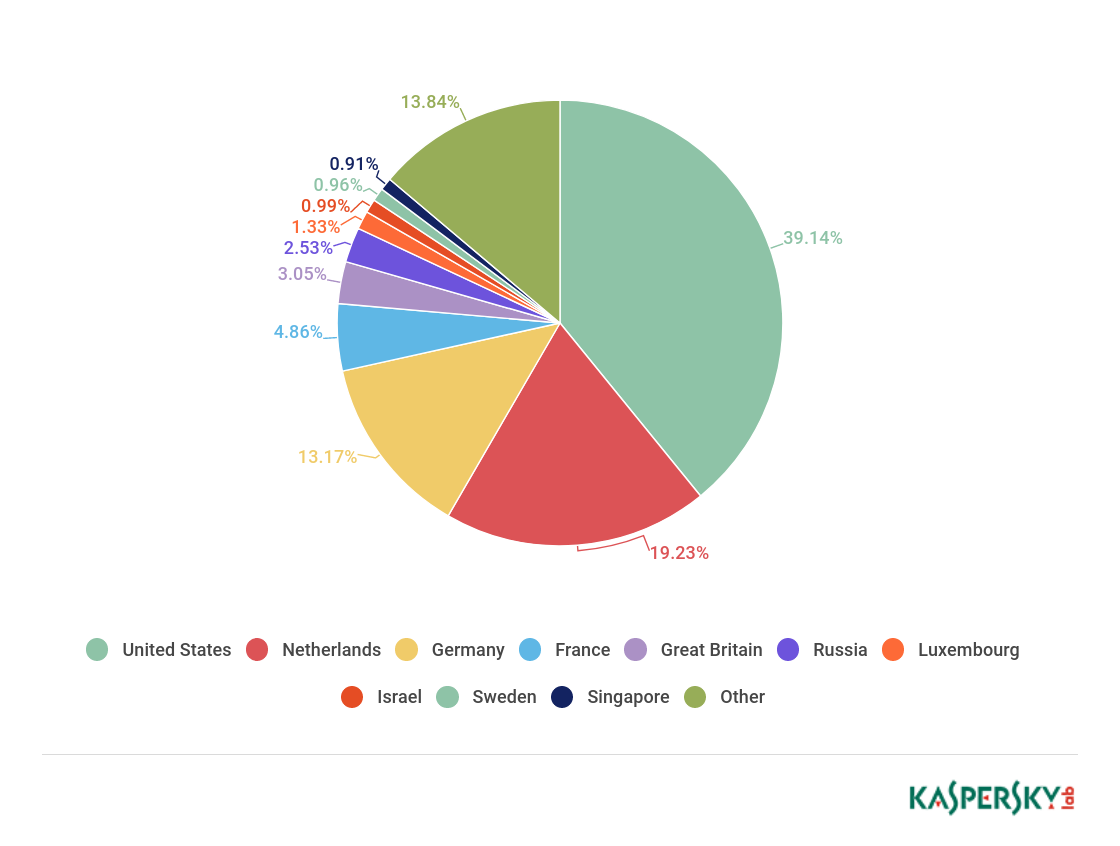
Distribution of web attack sources by country, Q1 2018
This quarter, Web Anti-Virus was most active on resources located in the US (39.14%). Canada, China, Ireland, and Ukraine dropped out of TOP 10 to be replaced by Luxembourg (1.33%), Israel (0.99%), Sweden (0.96%), and Singapore (0.91%).
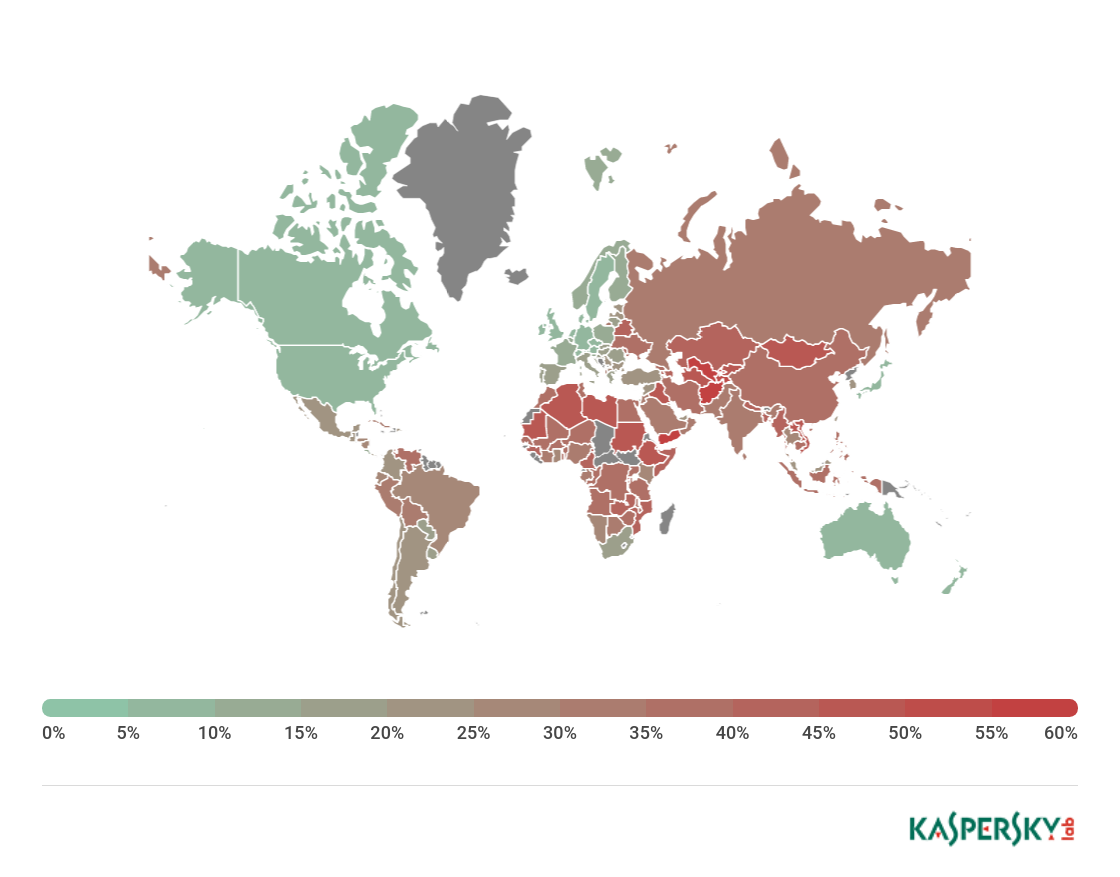
Countries where users faced the greatest risk of online infection
To assess the risk of online infection faced by users in different countries, for each country we calculated the percentage of Kaspersky Lab users on whose computers Web Anti-Virus was triggered during the quarter. The resulting data provides an indication of the aggressiveness of the environment in which computers operate in different countries.
This rating only includes attacks by malicious programs that fall under the Malware class; it does not include Web Anti-Virus detections of potentially dangerous or unwanted programs such as RiskTool or adware.
| Country* | % of attacked users** | |
| 1 | Belarus | 40.90 |
| 2 | Ukraine | 40.32 |
| 3 | Algeria | 39.69 |
| 4 | Albania | 37.33 |
| 5 | Moldova | 37.17 |
| 6 | Greece | 36.83 |
| 7 | Armenia | 36.78 |
| 8 | Azerbaijan | 35.13 |
| 9 | Kazakhstan | 34.64 |
| 10 | Russia | 34.56 |
| 11 | Kyrgyzstan | 33.77 |
| 12 | Venezuela | 33.10 |
| 13 | Uzbekistan | 31.52 |
| 14 | Georgia | 31.40 |
| 15 | Latvia | 29.85 |
| 16 | Tunisia | 29.77 |
| 17 | Romania | 29.09 |
| 18 | Qatar | 28.71 |
| 19 | Vietnam | 28.66 |
| 20 | Serbia | 28.55 |
These statistics are based on detection verdicts returned by the Web Anti-Virus module that were received from users of Kaspersky Lab products who consented to provide statistical data.
* Excluded are countries with relatively few Kaspersky Lab users (under 10,000).
** Unique users targeted by Malware-class attacks as a percentage of all unique users of Kaspersky Lab products in the country.
On average, 23.69% of Internet user computers worldwide experienced at least one Malware-class attack.

Geography of malicious web attacks in Q1 2018 (percentage of attacked users)
The countries with the safest surfing environments included Iran (9.06%), Singapore (8.94%), Puerto Rico (6.67%), Niger (5.14%), and Cuba (4.44%).
Local threats
Local infection statistics for user computers are a very important indicator: they reflect threats that have penetrated computer systems by infecting files or removable media, or initially got on the computer in an encrypted format (for example, programs integrated in complex installers, encrypted files, etc.).
Data in this section is based on analyzing statistics produced by Anti-Virus scans of files on the hard drive at the moment they were created or accessed, and the results of scanning removable storage media.
In Q1 2018, our File Anti-Virus detected 187,597,494 malicious and potentially unwanted objects.
Countries where users faced the highest risk of local infection
For each country, we calculated the percentage of Kaspersky Lab product users on whose computers File Anti-Virus was triggered during the reporting period. These statistics reflect the level of personal computer infection in different countries.
The rating includes only Malware-class attacks. It does not include File Anti-Virus detections of potentially dangerous or unwanted programs such as RiskTool or adware.
| Country* | % of attacked users** | |
| 1 | Uzbekistan | 57.03 |
| 2 | Afghanistan | 56.02 |
| 3 | Yemen | 54.99 |
| 4 | Tajikistan | 53.08 |
| 5 | Algeria | 49.07 |
| 6 | Turkmenistan | 48.68 |
| 7 | Ethiopia | 48.21 |
| 8 | Mongolia | 46.84 |
| 9 | Kyrgyzstan | 46.53 |
| 10 | Sudan | 46.44 |
| 11 | Vietnam | 46.38 |
| 12 | Syria | 46.12 |
| 13 | Rwanda | 46.09 |
| 14 | Laos | 45.66 |
| 15 | Libya | 45.50 |
| 16 | Djibouti | 44.96 |
| 17 | Iraq | 44.65 |
| 18 | Mauritania | 44.55 |
| 19 | Kazakhstan | 44.19 |
| 20 | Bangladesh | 44.15 |
These statistics are based on detection verdicts returned by OAS and ODS Anti-Virus modules received from users of Kaspersky Lab products who consented to provide statistical data. The data include detections of malicious programs located on user computers or removable media connected to computers, such as flash drives, camera and phone memory cards, or external hard drives.
* Excluded are countries with relatively few Kaspersky Lab users (under 10,000).
** Unique users on whose computers Malware-class local threats were blocked, as a percentage of all unique users of Kaspersky Lab products in the country.
On average, 23.39% of computers globally faced at least one Malware-class local threat in Q1.
The figure for Russia was 30.92%.
The safest countries in terms of infection risk included Estonia (15.86%), Singapore (11.97%), New Zealand (9.24%), Czech Republic (7.89%), Ireland (6.86%), and Japan (5.79%).
Table of Contents
- Q1 figures
- Mobile threats
- Vulnerable apps used by cybercriminals
- Malicious programs online (attacks via web resources)
- Online threats in the financial sector
- Cryptoware programs
- Countries that are sources of web-based attacks: TOP 10
- Countries where users faced the greatest risk of online infection
- Local threats
From the same authors


In the same category


IT threat evolution Q1 2018. Statistics