
Q1 in figures
- According to KSN data, Kaspersky Lab products detected and neutralized 1 345 570 352 threats in Q1 2013.
- A total of 22,750 new modifications of malicious programs targeting mobile devices were detected this past quarter — that’s more than half of the total number of modifications detected in all of 2012.
- Some 40% of the exploits seen in the first quarter of this year target vulnerabilities in Adobe products.
- Nearly 60% of all malicious hosts are located in three countries: the US, Russia, and the Netherlands.
Overview
The first quarter of 2013 turned out to be a busy time in IT security. This report will address the most significant events.
Cyberespionage and cyberweapons
Red October
At the very beginning of the year, Kaspersky Lab published a significant report with the results of a study on the global cyberespionage operation known as Red October. These attacks targeted various government agencies, diplomatic organizations and companies around the world. Analyzing the files and reconstructing the structure of the attack took several months. However, after a labor-intensive study, we were able to determine several key facts.
The attackers have been active over the past five years. The multifunctional platform that they used helped them quickly use new, expanded modules to collect information. In order to control and manage infected systems, they created more than 60 different domain names and several servers hosted in different countries. The command sever infrastructure is comprised of a chain of proxy servers.
In addition to traditional targeted attacks on workstations, Red October is also capable of stealing data from mobile devices, collecting data from network equipment, collecting files from USB drives, stealing email databases from local Outlook archives or from remote POP/IMAP servers, and extracting files from local FTP servers on the Internet.
MiniDuke
In February, FireEye published an analysis of a new malicious program that penetrates systems using a 0-day vulnerability in Adobe Reader (CVE-2013-0640). This became the first exploit capable of bypassing the Acrobat Reader sandbox. It downloaded a backdoor meant to steal data from an infected system. After obtaining examples of this malicious program for analysis, we gave it the name ItaDuke.
In time, we discovered several similar incidents targeting the very same vulnerability, only with different threats. The malicious program used by the cybercriminals was dubbed MiniDuke. An investigation into these incidents was conducted by the Hungarian company CrySys Lab. MiniDuke’s victims turned out to be government agencies located in Ukraine, Belgium, Portugal, Romania, the Czech Republic and Ireland, as well as a research organization in Hungary, in addition to a research institute, two scientific research centers and a medical facility in the US. In total, we detected 59 victims in 23 countries.
One of the most interesting characteristics of the MiniDuke attacks was the combination of a threat with code written using a complex, ‘old school’ approach, and relatively new, yet tried-and-true, exploit technologies targeting Adobe Reader vulnerabilities.
The attackers sent out malicious PDF documents with exploits targeting versions 9 through 11 of Adobe Reader. The documents contained information about a seminar on human rights (ASEM), news about Ukraine’s foreign policy, and the plans of NATO countries. If an exploit was successful, the victim’s computer would be infiltrated by a unique backdoor, small at just 20 KB, written in Assembler.
The cybercriminals used Twitter in this attack: in order to obtain C&C server addresses and subsequently download new malicious modules, the backdoor sought out special tweets from previously created accounts. As soon as the infected system established a connection with the command server, it would begin to receive encrypted modules (backdoors) bundled with GIF files. These modules had relatively simple functions: copying, moving and deleting files, creating directories, and downloading new malicious programs.
APT1
In February, Mandiant published a large PDF report on the attacks launched by a certain group of Chinese hackers going by the name of APT1. The term APT (Advanced Persistent Threat) is still a buzz word. Yet sometimes it refers to threats or attacks that aren’t exactly “advanced”. However, in the case of APT1, “advanced” is no exaggeration — this campaign run by Chinese hackers is large-scale and not to be taken lightly.
The Mandiant reports starts off by stating that APT1 appears to be a division of the Chinese army. The company even included a possible physical address for the division, and estimated the number of people involved and the infrastructure used. Mandiant believes that APT1 has been operating since 2006, and that over the course of 6 years it has managed to steal terabytes of data from at least 141 organizations. The victim organizations are primarily located in English-speaking countries. No doubt these massive attacks would not have been possible without real support from hundreds of people and a developed, modern infrastructure.
This is definitely not the first time that China has faced accusations of its involvement of cyberattacks against government agencies and organizations in countries around the world. And there is nothing particularly surprising about the Chinese government’s firm rejection of the assertions made in the Mandiant report.
Note that up till now, no country has ever claimed responsibility for any cyberespionage attack, or has admitted to involvement in cyberespionage under pressure from public or agency evidence.
TeamSpy
In March 2013, information was published about the latest in a line of complex attacks targeting high-ranking politicians and human rights advocates in the CIS and Eastern Europe. The operation was dubbed “TeamSpy,” as the remote admin program TeamViewer was used by the attackers to control victim computers. The main objective of this attack was to gather information from user computers, starting with screenshots and ending with copies of .pgp files, including passwords and encryption keys.
Even though the tools used in the TeamSpy operation — and even the operation itself — didn’t seem all that sophisticated or professional compared to the Red October operation, the TeamSpy attacks were also successful.
Stuxnet 0.5
Incidents that require months of persistent effort to investigate are relatively rare in the antivirus industry. Even rarer are events that remain relevant even three years after they take place — like the detection of Stuxnet, for example. Although this worm has been studied by numerous antivirus companies, there are still many modules that have barely been examined, if at all. It is important to remember that there were several version of Stuxnet, and that the earliest of them appeared back in 2009. Experts suggested several times that there were (or still are) even earlier versions of this worm, although there was no hard evidence.
But in the end, those assertions were confirmed. In late February, Symantec published a study on a new “old” version of the worm — Stuxnet 0.5. This version turned out to be the earliest known modification of Stuxnet, and was active between 2007 and 2009. Furthermore, this version had some very interesting characteristics:
- First of all, it was created on the same platform as Flame, not Tilded like subsequent Stuxnet modifications.
- Second, the worm spread using infected files generated with Simatic Step 7, and did not contain any exploits for Microsoft products.
- Third, Stuxnet 0.5 was no longer proliferated after July 4, 2009.
- Finally, it was Stuxnet 0.5 that featured complete compatibility with Siemens 417 PLC (later versions of the work did not have this feature in full).
The results of the study of Stuxnet version 0.5 have provided more information about this malicious program in general. It’s likely that we will find out even more information in the future. The same can be said about examples of cyberweapons detected after Stuxnet, as well as malware used in cyberespionage — there’s a lot we still don’t know.
Targeted attacks
Attacks against Tibetan and Uyghur activists
In the first quarter of 2013, targeted attacks continued against Tibetan and Uyghur activists. In order to achieve their goals, the attackers used everything at their disposal, and users of Mac OS X, Windows, and Android were subjected to attacks.
In January-February, Kaspersky Lab detected a substantial increase in the number of targeted attacks on Uyghurs using Mac OS X. All of these attacks used the CVE-2009-0562 vulnerability, which was patched by Microsoft nearly four years ago. The exploit for this vulnerability was sent out in MS Office documents, which were easy to recognize from the “captain” author tag. If the exploit was successfully executed, a backdoor for Mac OS X was downloaded in the form of a Mach-O file. This small backdoor has a very specific function: it installs another backdoor and a program that steals personal data (contacts).
Kaspersky Lab recorded the attacks against the Tibetan activists in mid-March 2013. This time, the attackers used the exploit mentioned above (CVE-2013-0640 — previously used in ItaDuke attacks) to get around the sandbox in Acrobat Reader X and infect the targeted computers.
In late March 2013, users of Android devices also fell victim to this wave of attacks. After the inbox of a well-known Tibetan activist was hacked, mailings from his address started coming out with an APK file attachment, which turned out to be a malicious program for Android (Kaspersky Lab products have labeled it Backdoor.AndroidOS.Chuli.a). This threat stealthily notifies its command server of a successful infection, and then begins to collect data stored on the device: contacts, call logs, text messages, GPS data and device information. Then the malware encrypts the stolen data using Base64 and uploads it to the command server. Kaspersky Lab’s investigation of the command server shows that the attackers speak Chinese.
Just a few days after the results of our study were published, research organization The Citizen Lab published the results of its study of a similar incident. The target of the attack were people who were in one way or another associated with Tibet or Tibetan activists, and the malicious program that was used has a similar function (stealing personal information), but is an infected version of the Kakao Talk messenger.
Hacking corporate networks
Unfortunately, the first quarter of the year turned out to be chock full of incidents involving hacked corporate infrastructures and password leakages. Victims included Apple, Facebook, Twitter, and Evernote, among others.
In early February, Twitter made an official announcement that malicious users had managed to steal user data (including hash passwords) from 250,000 members of the social network. Two weeks later, Facebook issued a statement that the computers of several of the company’s staff members had been infected by exploits during visits to a mobile developer site. Facebook described this as a sophisticated, targeted attack, noting that the goal was to penetrate Facebook’s corporate network. Luckily, company representatives stated that Facebook was able to avoid any leakage of user information.
Just a few days later, Apple announced that several company employees had fallen victim to the very same attack while visiting a website for mobile developers. Apple’s data showed that no data leakages had taken place. In early March, Evernote reported that their internal network had been hacked and that malicious users had attempted to gain access to their data.
In 2011, we witnessed mass hacking of various companies and mass user data leakages. It might seem like these attacks all came to nothing — but not so! Malicious users remain as interested as ever in hacking large companies and getting their hands on confidential data, including user information.
Mobile threats
Kaspersky Lab’s report on the evolution of threats targeting smartphones, tablets, and other mobile devices in 2012 was published in February 2013. Our data shows that in 2012 Android became the number-one target among virus writers, and that the number of threats over the course of the year grew steadily. Has this upswing in the number of mobile threats continued in 2013 so far? Indeed it has.
A few numbers
January is traditionally a quiet month for mobile virus writers — “only” 1,262 new modifications appeared in the first month of the year. But over the past few months, Kaspersky Lab has detected over 20,000 new mobile malware modifications. In February, we detected 12,044 mobile malware modifications, and another 9,443 in March. To compare — a total of 40,059 modifications of malicious programs targeting mobile devices were detected over the whole of 2012.
SMS Trojans, which send unauthorized text messages to short, premium-rate numbers, are still the most prevalent category of mobile threats and currently represent 63.6% of all attacks.
A total of 99.9% of new mobile threat detections target the Android platform.
According to KSN data, the Top 20 most commonly used malicious or potentially unwanted programs for Android are:
| Rank | Name | % of all attacks |
| 1 | Trojan-SMS.AndroidOS.FakeInst.a | 29,45% |
| 2 | Trojan.AndroidOS.Plangton.a | 18,78% |
| 3 | Trojan-SMS.AndroidOS.Opfake.a | 12,23% |
| 4 | Trojan-SMS.AndroidOS.Opfake.bo | 11,49% |
| 5 | Trojan-SMS.AndroidOS.Agent.a | 3,43% |
| 6 | Trojan-SMS.AndroidOS.Agent.u | 2,54% |
| 7 | RiskTool.AndroidOS.AveaSMS.a | 1,79% |
| 8 | Monitor.AndroidOS.Walien.a | 1,60% |
| 9 | Trojan-SMS.AndroidOS.FakeInst.ei | 1,24% |
| 10 | Trojan-SMS.AndroidOS.Agent.aq | 1,10% |
| 11 | Trojan-SMS.AndroidOS.Agent.ay | 1,08% |
| 12 | Trojan.AndroidOS.Fakerun.a | 0,78% |
| 13 | Monitor.AndroidOS.Trackplus.a | 0,75% |
| 14 | Adware.AndroidOS.Copycat.a | 0,69% |
| 15 | Trojan-Downloader.AndroidOS.Fav.a | 0,66% |
| 16 | Trojan-SMS.AndroidOS.FakeInst.ee | 0,55% |
| 17 | HackTool.AndroidOS.Penetho.a | 0,54% |
| 18 | RiskTool.AndroidOS.SMSreg.b | 0,52% |
| 19 | Trojan-SMS.AndroidOS.Agent.aa | 0,48% |
| 20 | HackTool.AndroidOS.FaceNiff.a | 0,43% |
First place this past quarter goes to Trojan-SMS.AndroidOS.FakeInst.a (29.45%). This threat targets primarily Russian speaking Internet users attempting to download software for Android devices from dubious sites. Often, cybercriminals use these websites to spread malware under the guise of useful software.
(18.78%), an adware Trojan ranked second. This threat is seen primarily in European countries, where it is used by the developers of free software to monetize products by displaying ads.
Third and fourth place both went to SMS Trojans from the Opfake family: Trojan-SMS.AndroidOS.Opfake.a (12.23%) and Trojan-SMS.AndroidOS.Opfake.bo (11.49%). The first modifications of the Opfake family of threats were disguised as the latest version of Opera, a popular mobile browser. Today, the malicious programs in this family are disguised as new versions of other popular apps (Skype, Angry Birds, etc.).
Incidents
We would like to touch on two of the most interesting virus incidents of the first quarter this year:
- a new threat going by the name of Perkele or Perkel, which hunts for mTANs,
- and the MTK botnet.
Another important event that took place this past quarter was the targeted attacks against Android users that we addressed above.
Perkel
During the first two weeks of March, the well-known journalist Brian Krebs detected information on underground Russian-language forums about a new banking Trojan targeting mobile devices and allegedly affecting users in 69 countries. As rumor had it, the new threat had already infected no small number of devices. Krebs suggested that this Trojan was created by Russian speaking virus writers, since the combination of tools used to create it are made available on Russian-language forums.
This news naturally drew the attention of antivirus professionals, but no examples of the software were available for a while.
Several days later, the first modifications of Perkel were detected. After Kaspersky Lab performed an analysis, it became clear that there were some new additions to the family of malicious programs designed to steal text messages containing mTANs. The functions seen in the Perkel family are typical of this group, with two exceptions:
- Perkel tends to use text messages rather than HTTP to communicate with the command server and upload stolen data (in addition to text messages with mTANs, the threat also collects information about the infected device).
- The threat is capable of performing self-updates by downloading a new copy of itself from a remote server.
The MTK Botnet
In mid-January, word came out about the existence of a botnet that had infected up to one million Android devices owned primarily by Chinese users. As it turned out, the spread of a malicious program in China was at the root of the botnet (Kaspersky Lab has dubbed this malicious program Trojan.AndroidOS.MTK). It spread via unofficial Chinese app stores with popular, cracked games. In addition to stealing information about the infected smartphone, user contact data and messages, threats in this family also hype up a variety of apps. To do so, the Trojans stealthily download and install apps on the victim’s mobile device, and then give that app the highest possible rating in the app store. Then, they report their actions to a remote server. The number of apps for Android is constantly on the rise, and it is often a challenge to gain popularity with users — which is why these illegitimate tactics are becoming all the more common.
TurkTrust’s certificates revoked
In the first quarter of 2013, we saw yet another incident involving root certificates. Microsoft, Mozilla, and Google all revoked two root certificates issued by the certificate authority TurkTrust, thus removing them from their respective browser databases.
As it turned out, TurkTrust had released redundant root certificates to two organizations in place of typical SSL certificates. They could be used to make SSL certificates for any resource on the Internet, and the browsers used to access these resources would accept these certificates as ‘trusted’.
In December, Google found that one of the certificates issued by TurkTrust SSL for *.google.com had been involved in a “man-in-the-middle” type attack. Naturally, the fact that Google had been attacked meant that the certificates issued in the same way could be involved in attacks against other companies.
This latest in a line of major incidents related to root certificates and trust issues has shown that the malicious use of legitimate certificates remains a critical problem. However, the malicious usage of these types of certificates has only ever been identified after the fact, as currently there are no effective means of preventing these types of incidents at this time.
Statistics
em>All statistical data used in the report has been obtained from the cloud-based Kaspersky Security Network (KSN). The statistics were acquired from KSN users who consented to share their local data. Millions of users of Kaspersky Lab products in 213 countries take part in the global information exchange on malicious activity.
Online threats
The statistics in this section were derived from web antivirus components which protect users when malicious code attempts to download from infected websites. Infected websites might be created by malicious users, or they could also be made up of user-contributed content (such as forums) and legitimate resources that have been hacked.
Detectable online threats
In the first quarter this year, Kaspersky Lab solutions neutralized 821 379 647 attacks launched from online resources around the world.
The Top 20 detectable online threats
| Rank | Name* | % of all attacks** |
| 1 | Malicious URL | 91,44% |
| 2 | Trojan.Script.Generic | 2,79% |
| 3 | AdWare.Win32.Bromngr.b | 1,91% |
| 4 | Trojan.Script.Iframer | 0,73% |
| 5 | Exploit.Script.Blocker | 0,70% |
| 6 | Trojan.JS.Redirector.xa | 0,33% |
| 7 | Hoax.SWF.FakeAntivirus.i | 0,22% |
| 8 | Trojan.Win32.Generic | 0,17% |
| 9 | AdWare.Win32.MegaSearch.am | 0,13% |
| 10 | Trojan-Downloader.Win32.Generic | 0,09% |
| 11 | Exploit.Script.Blocker.u | 0,07% |
| 12 | AdWare.Win32.IBryte.heur | 0,05% |
| 13 | Exploit.JS.Retkid.a | 0,05% |
| 14 | Exploit.Script.Generic | 0,05% |
| 15 | Hoax.HTML.FraudLoad.i | 0,04% |
| 16 | Exploit.Win32.CVE-2011-3402.c | 0,04% |
| 17 | Packed.Multi.MultiPacked.gen | 0,04% |
| 18 | Trojan-Clicker.HTML.Agent.bt | 0,04% |
| 19 | WebToolbar.Win32.BetterInstaller.gen | 0,03% |
| 20 | Trojan.JS.Redirector.xb | 0,03% |
*These statistics represent detection verdicts of the web-based antivirus module and were submitted by the users of Kaspersky Lab products who consented to share their local data.
**The total number of unique incidents recorded by web-based antivirus on user computers.
First place on this past quarter’s Top 20 detectable online threats was once again taken by denylisted malicious links. Their share rose 0.5 percentage points from Q4 2012 and overall these links represented 91.4% of all web-based antivirus detections. Incidentally, the use of KSN tools to deliver instant updates to user computers via the cloud helped Kaspersky Lab products block 6.6% of malicious links. These links led to recently hacked websites, or websites that were specially created by malicious users that users had started to visit.
Once again, Trojan.Script.Generic (2nd place) and Trojan.Script.Iframer (4th) made the Top 5. These threats are blocked during attempted drive-by attacks, which are one of the most common methods used to infect user computers these days.
The Top 20 has featured Hoax.HTML. FraudLoad.i for several months now, and in Q1 2013 this threat was in 15th place. This malicious program is encountered primarily by users who download movies, TV shows, and software from questionable sources. Hoax.HTML.FraduLoad is detected on websites that users can visit to allegedly download certain content, but in order to do so, users must first send a paid text message or enter their cell phone number to fill out a paid subscription form. If the user meets all of the requirements, then he will receive the contents he wanted either in the form of a text file with instructions for using search engines, or worse — a malicious program.
Exploit.Win32.CVE-2011-3402.c was in 16th place this time around. This threat exploits a vulnerability in the win32k.sys registry (the TrueType Font Parsing Vulnerability). This was the same vulnerability used to spread the Duqu worm.
Countries where online resources are seeded with malware
This statistic highlights the countries where websites are physically located and which are seeded with malicious programs. In order to determine the geographical source of web-based attacks, a method was used by which domain names were matched up against actual domain IP addresses, and then the geographical location of a specific IP address (GEOIP) was established.
Some 81% of online resources used to spread malicious programs are located in 10 countries. Over the past six months, that indicator has fallen by 5 percentage points – 3 percentage points in the first quarter of 2013, and by 2 percentage points in Q4 2012.
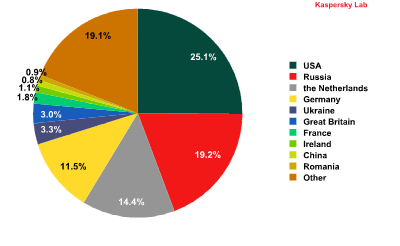
The distribution of online resources seeded with malicious programs, Q1 2013
This time around, Russia (19%, -6 percentage points) and the US (25%, +3 percentage points) once again switched places in the ratings in terms of malicious hosting services — the US won back first place after losing it last quarter. The percentages represented by other countries are more or less unchanged since Q4 2012.
Countries where users faced the greatest risk of online infection
In order to assess the risk level for online infection that user computers face in different countries, we calculated just how often users with Kaspersky Lab products encountered web-based antivirus detections during the first three months of the year.
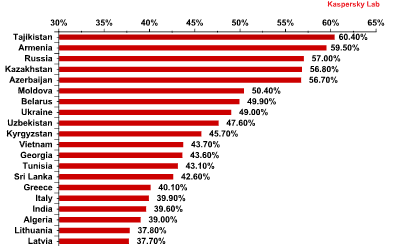
Top 20 countries* for online infection risks** in Q1 2013
*For the purposes of these calculations, we excluded countries where the number of Kaspersky Lab product users is relatively small (less than 10,000).
**The percentage of unique users in the country with computers running Kaspersky Lab products that blocked web-borne threats.
The Top 10 countries where users most frequently encounter malicious programs barely changed since the last quarter of 2012 and still includes countries from the FSU. Russia (57%) is in third place on the list. However, there were some changes in the Top 20: during the first three months of this year, Tunisia (43.1%) and Algeria (39%) both joined the Top 20. The only Western European country to make in into the Top 20 was Italy (39.9%, 16th place).
All of the countries can be divided into four basic groups.
- Maximum risk: This group includes countries where more than 60% of users encountered malware at least once while online during the reporting period. In the first three months of 2013, Tajikistan was the lone member of this group with 60.4%.
- High risk: This group includes countries where 41 – 60% of users encountered online malware at least once. Over this reporting period, 13 countries from the Top 20 (the same number as in Q4 2012) were in this category. With the exception of Vietnam, Tunisia, and Sri Lanka, most of the members of this group are from the FSU, specifically Armenia (59.5%), Russia (57%), Kazakhstan (56.8%), Azerbaijan (56.7%), Belarus (49.9%), and Ukraine (49%).
- Moderate risk: This group includes countries where 21-40% of Internet users encountered malware — a total of 102 countries in Q1 2013, including Italy (39.9%), Germany (36.6%), France (35.8%), Belgium (33.8%), Sudan (33.1%), Spain (32.5%), Qatar (31.9%), the US (31.6%), Ireland (31.5%), the UK (30.2%), the UAE (28.7%) and the Netherlands (26.9%).
- Low risk: With just 12.5 – 21% of users encountering malware over the reporting period, this group included 28 countries in Q1 2013 and featured primarily African countries, where the Internet is still underdeveloped. Japan (15.6%) and Slovakia (19.9%) were exceptions.
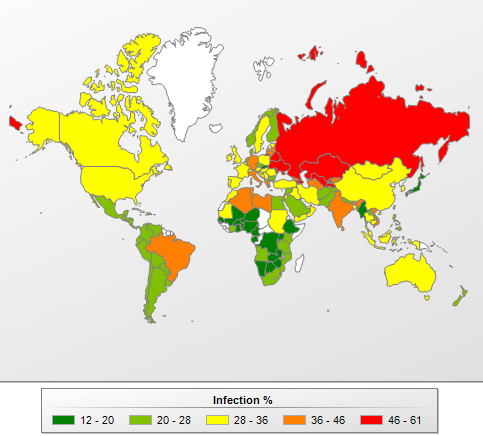
The risk of online infection around the world, Q1 2013
On average, 39.1% of computers connected to KSN were subjected to an attack at least once over the first three months of the year during web surfing. The average percentage of computers attacked in Q1 2013 rose 1.5 percentage points from Q4 2012.
Local threats
This section of the report contains an analysis of statistics based on data obtained from the on-access scanner and scanning statistics for different disks, including removable media (the on-demand scanner).
Threats detected on user computers
In Q1 2013, Kaspersky Lab’s security solutions successfully blocked 490 966 403 attempted local infections on user computers participating in Kaspersky Security Network.
TOP 20 threats detected on user computers
| Rank | Name | % of individual users* |
| 1 | DangerousObject.Multi.Generic | 18,51% |
| 2 | Trojan.Win32.Generic | 16,04% |
| 3 | Trojan.Win32.AutoRun.gen | 13,60% |
| 4 | Virus.Win32.Sality.gen | 8,43% |
| 5 | Exploit.Win32.CVE-2010-2568.gen | 6,93% |
| 6 | Trojan.Win32.Starter.yy | 5,11% |
| 7 | Net-Worm.Win32.Kido.ih | 3,46% |
| 8 | HiddenObject.Multi.Generic | 3,25% |
| 9 | Trojan.Win32.Hosts2.gen | 3,17% |
| 10 | Virus.Win32.Nimnul.a | 3,13% |
| 11 | Virus.Win32.Generic | 3,09% |
| 12 | Net-Worm.Win32.Kido.ir | 2,85% |
| 13 | Trojan.Script.Generic | 2,54% |
| 14 | AdWare.Win32.Bromngr.b | 2,51% |
| 15 | Exploit.Java.CVE-2012-1723.gen | 2,38% |
| 16 | Trojan.Win32.Starter.lgb | 2,38% |
| 17 | Trojan-Downloader.Win32.Generic | 2,13% |
| 18 | AdWare.Win32.Bromngr.h | 2,11% |
| 19 | Hoax.Win32.ArchSMS.gen | 2,09% |
| 20 | Trojan-Dropper.VBS.Agent.bp | 1,97% |
These statistics are compiled from the malware detection verdicts generated by the on-access and on-demand scanner modules on the computers of those users running Kaspersky Lab products that have consented to submit their statistical data.* The proportion of individual users on whose computers the antivirus module detected these objects as a percentage of all individual users of Kaspersky Lab products on whose computers a malicious program was detected.
As before, three verdicts are firmly in the lead in this Top 20.
Malicious programs classified as DangerousObject.Multi.Generic detected using cloud technologies ranked in first place in Q1 2013 with 18.51% (up 1.8 percentage points from Q4 2012). Cloud technologies work when there are still no signatures in antivirus databases, and no heuristics for detecting malicious programs, but Kaspersky Lab’s cloud already has data about the threat. This is essentially how the newest malicious programs are detected.
Second place was taken by Trojan.Win32.Generic with 16% based on verdicts issued by the heuristic analyzer in the proactive detection of numerous malicious programs. Trojan.Win32.AutoRun.gen (13.6%) was in third place, and includes malicious programs that use the autorun feature.
The adware family AdWare.Win32.Bromngr made its debut in the Top 20 at 8th place in Q4 2012. This quarter, it claimed two rankings (14th and 18th). All of the modifications of this adware module are DLL directories that are basically add-ons to commonly used browsers (Internet Explorer, Mozilla Firefox, and Google Chrome). Just like the overwhelming majority of these types of programs, this module changes a user’s search settings, the home page, and periodically displays a variety of advertisements in pop-up windows.
Countries where users run the highest risk of local infection
The figures below show the average rate of infection among user computers in different countries. KSN participants who provide Kaspersky Lab with information had at least one malicious file detected on every third (31.4%) computer, either on their hard drive or a removable disk connected to the computer. This is 0.8 percentage points lower than in the previous quarter.
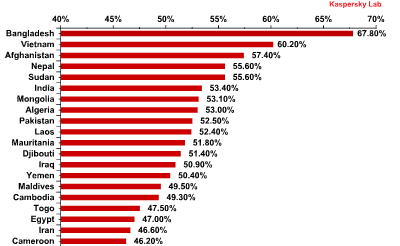
Computer infection levels by country* – TOP 20 ratings** for Q1 2013
*The percentage of unique users in the country with computers running Kaspersky Lab products that blocked web-borne threats.
**When calculating, we excluded countries where there are fewer than 10,000 Kaspersky Lab users.
For the fourth quarter in a row, the Top 20 positions in this category are held by countries in Africa, the Middle East, and South East Asia. The percentage of computers with blocked malicious code is the highest in Bangladesh, which saw another decrease, this time by 11.8 percentage points, leaving it on a total of 67.8% (down from 90.9% in Q3 2012).
Local infection rates can also be put into four groups based on risk level:
- Maximum local infection rate (over 60%): at the close of Q1 2013, this group included just two countries: Bangladesh (67.8%) and Vietnam (60.2%).
- High local infection rate (41-60%): 41 countries, including Iraq (50.9%), Syria (45.5%), Myanmar (44.5%), Angola (42.3%), and Armenia (41.4%).
- Moderate local infection rate (21 – 40%): 60 countries, including China (37.6%), Qatar (34.6%), Russia (34.3%), Ukraine (33.6%), Lebanon (32.4%), Croatia (26.1%), Spain (26%), Italy (23.8%), France (23.4%), and Cyprus (23.3%).
- Lowest local infection rate(up to 21%): 31 countries, including Belgium (19.3%), the US (19%), the UK (18.6%), Australia (17.5%), Germany (17.7%), Estonia (17.8%), the Netherlands(16.2%), Sweden (14.6%), Denmark (12.1%), and Japan (9.1%).
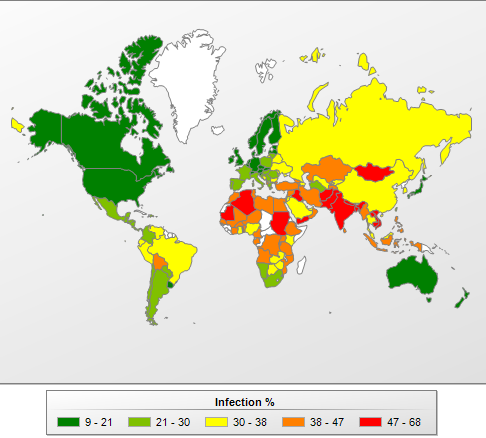
The risk of local infection in different countries, Q1 2013
The Top 10 safest locations in terms of the local infection rate are:
| Japan | 9,10% |
| Denmark | 12,10% |
| Finland | 13,60% |
| Sweden | 14,60% |
| The Czech Republic | 14,80% |
| Switzerland | 15,10% |
| Ireland | 15,20% |
| The Netherlands | 16,20% |
| New Zealand | 16,60% |
| Norway | 16,80% |
Two countries, the Netherlands and Norway, are new to the list this reporting period, pushing out Luxembourg and Puerto Rico.
Vulnerabilities
In the first quarter this year, a total of 30 901 713 vulnerable programs and files were detected on user computers running KSN. On average, eight different vulnerabilities were detected on each vulnerable computer.
The Top 10 most prevalent vulnerabilities are set out in the table below.
| Secunia ID – Unique vulnerability number | Vulnerability name and link to description | What the vulnerability lets malicious users do | Percentage of users on whose computers the vulnerability was detected* | Publication date | Threat rating | |
| 1 | SA 50949 | Oracle Java Multiple Vulnerabilities | DoS attacks, gain access to a system, disclosure of confidential information, and manipulate data | 45,26% | 17.10.2012 | Highly Critical |
| 2 | SA 51771 | Adobe Flash Player / AIR Integer Overflow Vulnerability | Gain access to a system | 22,77% | 08.01.2013 | Highly Critical |
| 3 | SA 51090 | Adobe Shockwave Player Multiple Vulnerabiliti | Gain access to a system | 18,19% | 24.10.2012 | Highly Critical |
| 4 | SA 51280 | Oracle Java Two Code Execution Vulnerabilities | Gain access to a system | 17,15% | 10.01.2013 | Extremely Critical |
| 5 | SA 47133 | Adobe Reader/Acrobat Multiple Vulnerabilities | Gain access to a system | 16,32% | 07.12.2011 | Extremely Critical |
| 6 | SA 51692 | VLC Media Player HTML Subtitle Parsing Buffer Overflow Vulnerabilities | Gain access to a system | 14,58% | 28.12.2012 | Highly Critical |
| 7 | SA 51226 | Apple QuickTime Multiple Vulnerabilities | Gain access to a system | 14,16% | 08.11.2012 | Highly Critical |
| 8 | SA 43853 | Google Picasa Insecure Library Loading Vulnerability | Gain access to a system | 12,85% | 25.03.2011 | Highly Critical |
| 9 | SA 46624 | Winamp AVI / IT File Processing Vulnerabilities | Gain access to a system | 11,30% | 03.08.2012 | Highly Critical |
| 10 | SA 41917 | Adobe Flash Player Multiple Vulnerabilities | Gain access to a system, disclose confidential information, and bypass the security system | 11,21% | 28.10.2010 | Extremely Critical |
*Percentage of all users on whose computers at least one vulnerability was detected.
The most widespread vulnerabilities are found in Java and were detected on 45.26% of all computers. Also in the ratings is a relatively old but very dangerous vulnerability in Adobe Flash Player. This vulnerability was detected back in October 2010, but Kaspersky Lab is still detecting it on 11.21% of vulnerable computers.
The Top 5 vulnerabilities are found in Oracle and Adobe products, and as we noted above, Adobe is at the top of the chart. Sixth to ninth places were taken by vulnerabilities found in software products from a variety of companies.
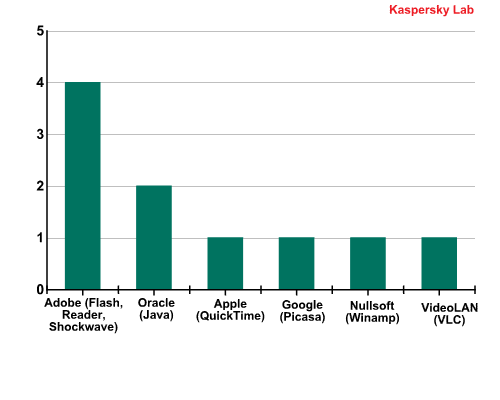
Developers of products with the Top 10 vulnerabilities, Q1 2013
The use of any vulnerability on the Top 10 ultimately leads to the execution of random code in the system.
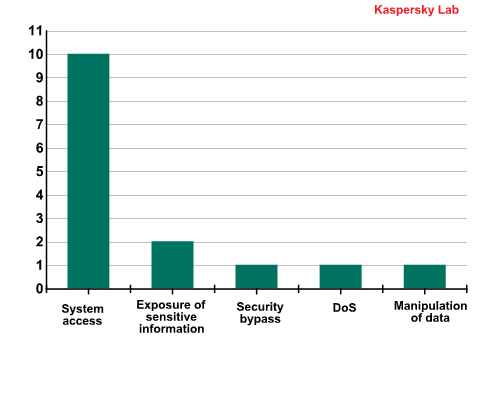
The distribution of Top 10 vulnerabilities by type of system impact, Q1 2013
These vulnerabilities are always a top choice among malicious users and the exploits that target them are more valuable than others on the black market.


IT Threat Evolution: Q1 2013