
News overview
Q3 was relatively calm from a DDoS perspective. There were no headline innovations, although cybercriminals did continue to master techniques and develop malware already familiar to us from the last reporting period. For example, another DDoS botnet joined in the assault on Docker environments. The perpetrators infiltrated the target server, created an infected container, and placed in it the Kaiten bot (also known as Tsunami), paired with a cryptominer.
The Lucifer botnet, which first appeared on researchers’ radar last quarter, and knows all about DDoS attacks and cryptocurrency mining, got an update, and now infects not only Windows, but also Linux devices. In DDoS attacks, the new version can use all major protocols (TCP, UDP, ICMP, HTTP) and spoof the IP address of the traffic source.
Mirai enthusiasts supplemented their brainchild with exploits for new vulnerabilities. In July, our colleagues at Trend Micro told about a variant of the botnet that exploited the bug CVE-2020-10173 in Comtrend VR-3033 routers, allowing sections of the network connected to vulnerable routers to be compromised. Then in August, news broke of a Mirai variant attacking BIG-IP products through the CVE-2020-5902 vulnerability. The BIG-IP family includes firewalls, load management and access control apps, and fraud and botnet protection systems. The vulnerability can be used to execute arbitrary commands, upload and delete files, disable services, and run JavaScript scripts.
On the topic of actual DDoS attacks, Q3 was not that eventful. The most newsworthy were extortion attacks allegedly carried out by actors known for hiding behind variously named APT groups: FancyBear, Armada Collective, Lazarus, and others. The ransomers send bitcoin ransom emails to organizations around the world, demanding from 5 BTC to 20 BTC, and threatening a powerful and sustained DDoS attack in case of non-payment. After that, the victim is flooded with junk traffic to demonstrate that the threats are far from empty.
In August and early September, several organizations in New Zealand were hit, including the New Zealand Stock Exchange (NZX), which was taken offline for several days. Also among the victims were the Indian bank YesBank, PayPal, Worldpay, Braintree, and other financial companies. Another DDoS wave of bitcoin ransom demands affected a number of European ISPs; however, it’s not known for sure whether this was the work of the same group. At the end of September, financial and telecommunications companies in Hungary were rocked by a powerful DDoS attack. According to Magyar Telekom, the junk traffic came from Russia, China, and Vietnam. Whether the cybercriminals sent ransom messages as part of the attack is unknown.
The back end of September saw a series of DDoS attacks on public flight-tracking services. The victims included the Swedish website Flightradar24 and the UK platform Plane Finder, which monitor the movement of aircraft in real time. These services are in great demand: meeters and greeters can check if a flight is on time, and media use the information when reporting on aircraft incidents. As a result, the services worked only intermittently, and their Twitter accounts posted messages that an attack had taken place. A tweet from Flightradar24, for instance, reported that the resource had suffered no fewer than three attacks in a short space of time. US company FlightAware also reported service availability issues, but did not specify whether it was an attack or just a malfunction.
Q3 was not without traditional attacks on the media. Russian TV station Dozhd reported a DDoS incident on August 24. Unknown cyberactors attempted to take the resource offline during daytime and evening news broadcasts. In early September, cybercriminals targeted the news agency UgraPRO. According to media reports, the junk traffic originated from Russian and foreign IP addresses at a rate of more than 5,000 requests per second. In late September, the news portals Chronicles of Turkmenistan and Sputnik Armenia reported attacks on their websites.
Lastly, due to the coronavirus pandemic and related restrictions in Russia, the Unified State Exam, sat by final grade students in Russian schools, was this year postponed to July. This could hardly fail to impact the DDoS landscape: in the middle of the month, the Federal Service for Supervision in Education and Science (Rosobrnadzor) reported an attempt to disrupt the exam results portal. Fortunately, the results had not yet been uploaded, so the attack was a wasted effort.
More school-related attacks were predictably seen at the start of the academic year. For example, in Miami-Dade County, Florida, a DDoS wave swept across the websites of local educational institutions, disrupting online classes. However, one of the juvenile cybercriminals met with near-instant karma: the schools brought in the FBI, and by September 3 the delinquent had been arrested. The other perpetrators are still being traced.
On the topic of the FBI, in Q2 the agency issued two anti-DDoS alerts for businesses. In July, a document was released containing a brief description of new amplification methods, as well as recommendations for detecting attacks and measures to prevent them. And in late August, it published a fairly detailed report on DDoS extortionists activity, again with tips for countering such attacks.
Quarter trends
In Q3, we observed a significant drop in all indicators relative to the previous reporting period. This is more likely due to the anomalous DDoS activity seen in Q2 than any unusual lull this quarter, which becomes clear when comparing the current picture with data for the same period in 2019: total attacks increased by 1.5 times, while the number of smart attacks almost doubled.

Comparative amount of DDoS attacks, Q2/Q3 2020 and Q3 2019. Data for Q3 2019 is taken as the 100% reference value (download)
- Global market stabilization amid the coronavirus pandemic. It is now nine months since the introduction of quarantine measures, and the mass transition to remote working has ceased to be news. Companies have adapted to the new work format, and IT departments have plugged holes in remote infrastructure and strengthened key nodes. As a result, there are fewer targets fit for attack.
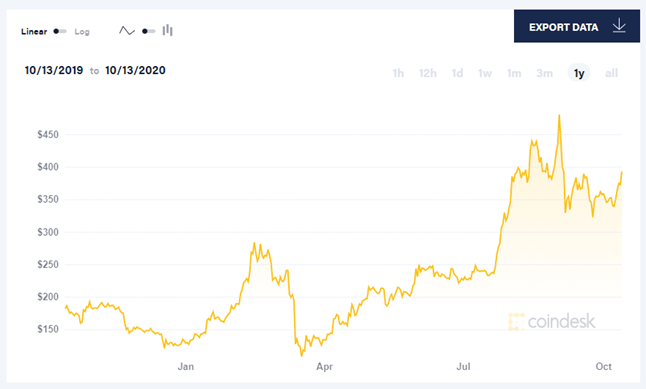
- Cryptocurrency market growth. For instance, the Ethereum price chart (see below) shows a clear jump in Q3. Cryptocurrency mining and DDoS attacks are competing markets. Many botnets can do both, and their operators choose where to direct resources at any particular moment depending on the potential yield. In Q3, some botnets could have been switched over to mining.
Ethereum price dynamics from October 13, 2019, to October 13, 2020. Source: coindesk.com
Quarter statistics
Methodology
Kaspersky has a long history of combating cyber threats, including DDoS attacks of all types and complexity. Company experts monitor botnets using the Kaspersky DDoS Intelligence system.
The DDoS Intelligence system is part of the Kaspersky DDoS Protection solution, and intercepts and analyzes commands sent to bots from C&C servers. The system is proactive, not reactive, meaning that it does not wait for a user device to get infected or a command to be executed.
This report contains DDoS Intelligence statistics for Q3 2020.
In the context of this report, the incident is counted as a single DDoS-attack only if the interval between botnet activity periods does not exceed 24 hours. For example, if the same web resource was attacked by the same botnet with an interval of 24 hours or more, then this is considered as two attacks. Bot requests originating from different botnets but directed at one resource also count as separate attacks.
The geographical location of DDoS victims is determined by their IP addresses. The number of unique targets of DDoS attacks in this report is counted by the number of unique IP addresses in the quarterly statistics.
DDoS Intelligence statistics are limited to botnets detected and analyzed by Kaspersky. Note that botnets are just one of the tools used for DDoS attacks, and that this section does not cover every single DDoS attack that occurred during the review period.
Quarter results
- The TOP 3 by number of attacks and targets remain unchanged: China (71.20 and 72.83%), the US (15.30 and 15.75%), and the Hong Kong Special Administrative Region (4.47 and 4.27%).
- The Netherlands and Vietnam are new faces in the Top 10 by number of attacks.
- As for the ranking by number of targets, there was a noticeable decline of interest in Asia: Hong Kong lost 2.07 p.p. and Singapore 0.3 p.p., while Japan and South Korea did not even show. The exception is China, where the share of targets rose by 6.81 p.p.
- After the Q2 upturn, the number of attacks in Q3 dipped again. What’s more, the difference between the peak (323 attacks per day) and anti-peak (1 registered attack) figures increased sharply.
- In Q3, we observed a two-week drop in late August and early September. During this period, there were three anti-peaks (August 31, September 1/7) with one attack per day, and another five days with fewer than 10.
- DDoS botnet flooding was most active on Thursdays, with a noticeable dip on Fridays.
- Although Q3 lags far behind Q1 in terms of duration, there were two registered attacks of more than 10 days (246 and 245 hours), and the number of attacks lasting 5–9 days (12 attacks lasting 121–236 hours) increased.
- The distribution of attacks by type did not undergo any changes: SYN flooding is still the main tool (94.6%), its share remaining virtually unchanged since the previous quarter. ICMP attacks comprised 3.4%, while HTTP flooding scored less than 0.1% of attacks.
- Linux botnets still dominate over their Windows counterparts, accounting for 95.39% of attacks (up 0.61 p.p. on the previous quarter).
Attack geography
Q3 2020 brought no surprises in terms of the geographical distribution of attacks. The TOP 3 by number of attacks this year is surprisingly stable: China (71.2%, up 6.08 p.p. against Q2), the US (15.3%, down 4.97 p.p.), and Hong Kong (4.47%, down 1.61 p.p.). Despite some fluctuations, the huge gap between China and the US, and Hong Kong’s markedly lower share, remain unchanged. We saw a similar state of play in Q3 2019.
Singapore, Australia, and India all climbed one line higher (from fifth to fourth, sixth to fifth, and seventh to sixth place, respectively), knocking South Africa from fourth to eighth. The reason has less to do with the rising share of attacks in these countries, rather the relative calm in South Africa itself: in July-September, the share of attacks there fell by 0.88 p.p. to 0.4%. At the same time, there were fewer registered attacks in Singapore, in relative terms, than in the previous reporting period: 0.85% of DDoS attacks (-0.28 p.p.). The shares of Australia and India increased by roughly the same amount (+0.27 p.p. and +0.24 p.p., respectively), delivering a 0.65% share for the former and 0.57% for the latter.
In seventh place in the ranking, wedged between India and South Africa, is the Netherlands, absent from the TOP 10 since Q3 2019. In the reporting period, this country accounted for 0.49% of attacks.
The TOP 10 by number of attacks is rounded out by Vietnam and the UK. The share of attacks in the former increased by 0.23 p.p. against Q2, giving Vietnam a TOP 10 finish for the second time this year with 0.39% of attacks (its previous entry was at the start of the year). As for the UK, it remains relatively stable: from 0.18% of attacks in Q2, its share rose only slightly, to 0.25%.
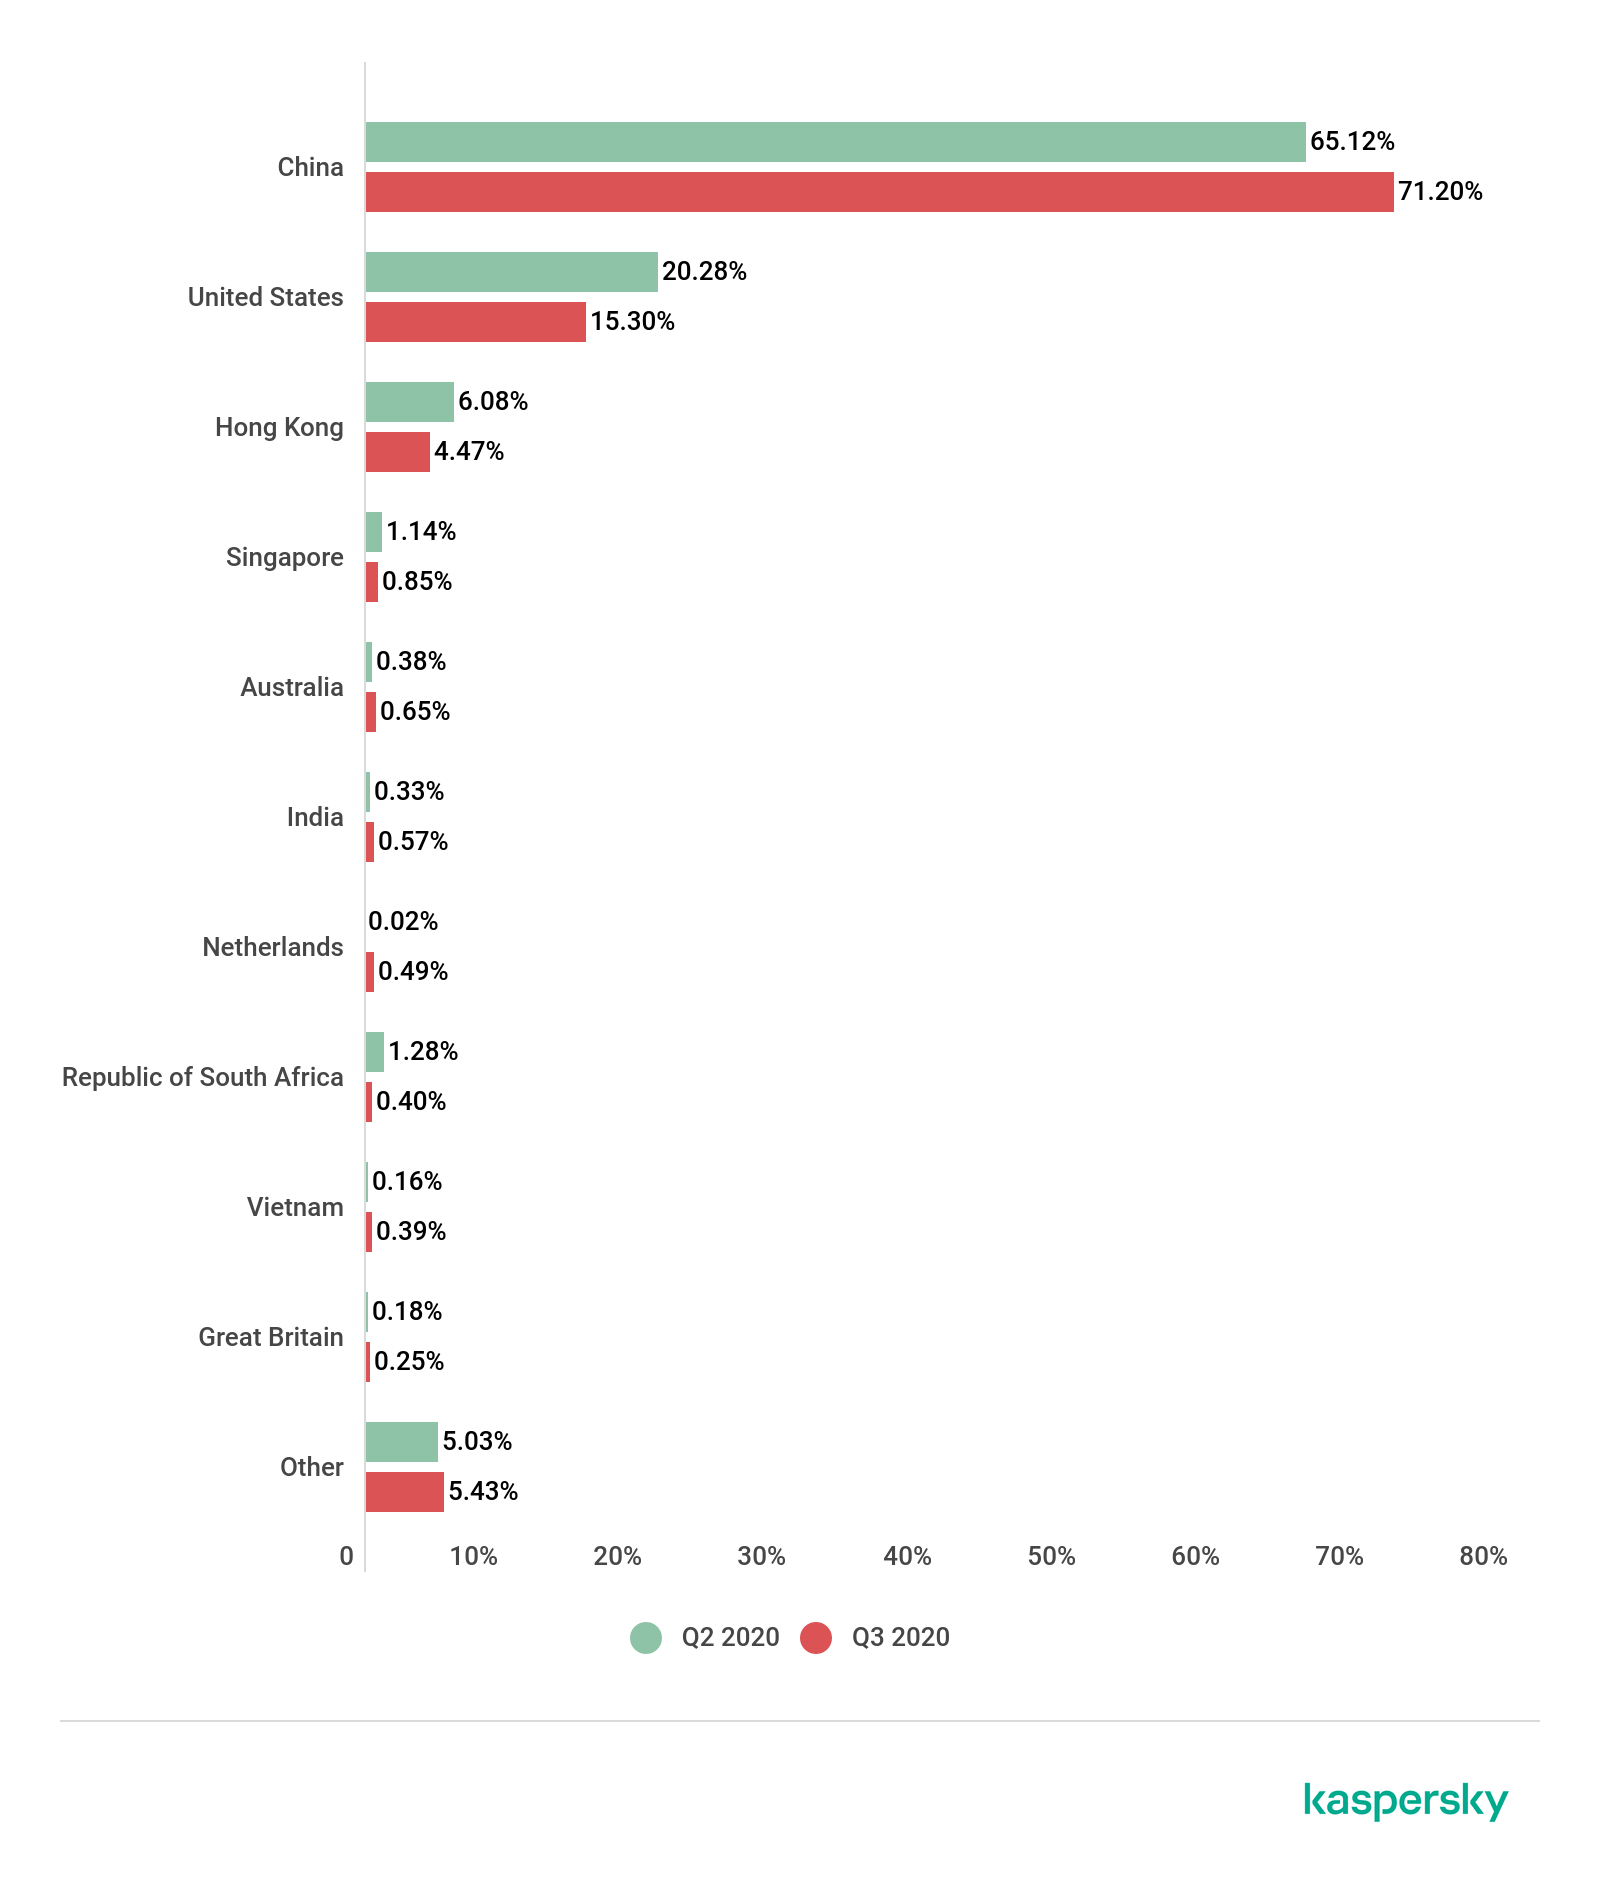
Distribution of DDoS attacks by country, Q2 and Q3 2020 (download)
The TOP 3 remained the same as in the previous quarter: China, the US, Hong Kong. The share of targets in China continues to grow — up 6.81 p.p. against the last reporting period, approaching three-quarters of all registered targets: 72.83%. Having shed 3.57 p.p., the US was left with 15.75% of targets. Hong Kong lost 2.07 p.p., its share of targets falling to 4.27%.
Fourth place was taken by Singapore. Despite the reduced number of targets there (down 0.3 p.p. to 0.74%), it moved up one notch, displacing South Africa. In fifth position was Vietnam with 0.5% of registered targets (in the previous reporting period it ranked seventh). The already mentioned South Africa claimed sixth place with 0.47% of targets.
The next two positions, seventh and eighth, went to a couple of newbies: the UK (0.35%) and the Netherlands (0.27%). It was their first inclusion in the ranking since Q4 and Q3 2019, respectively. These European countries ousted Asia’s Japan and South Korea, which had occupied the bottom two lines in last quarter’s TOP 10 countries by number of targets. In Q3, these lines were filled by Australia (0.25%) and India (0.23%), which had previously sat in sixth and eighth position, respectively.
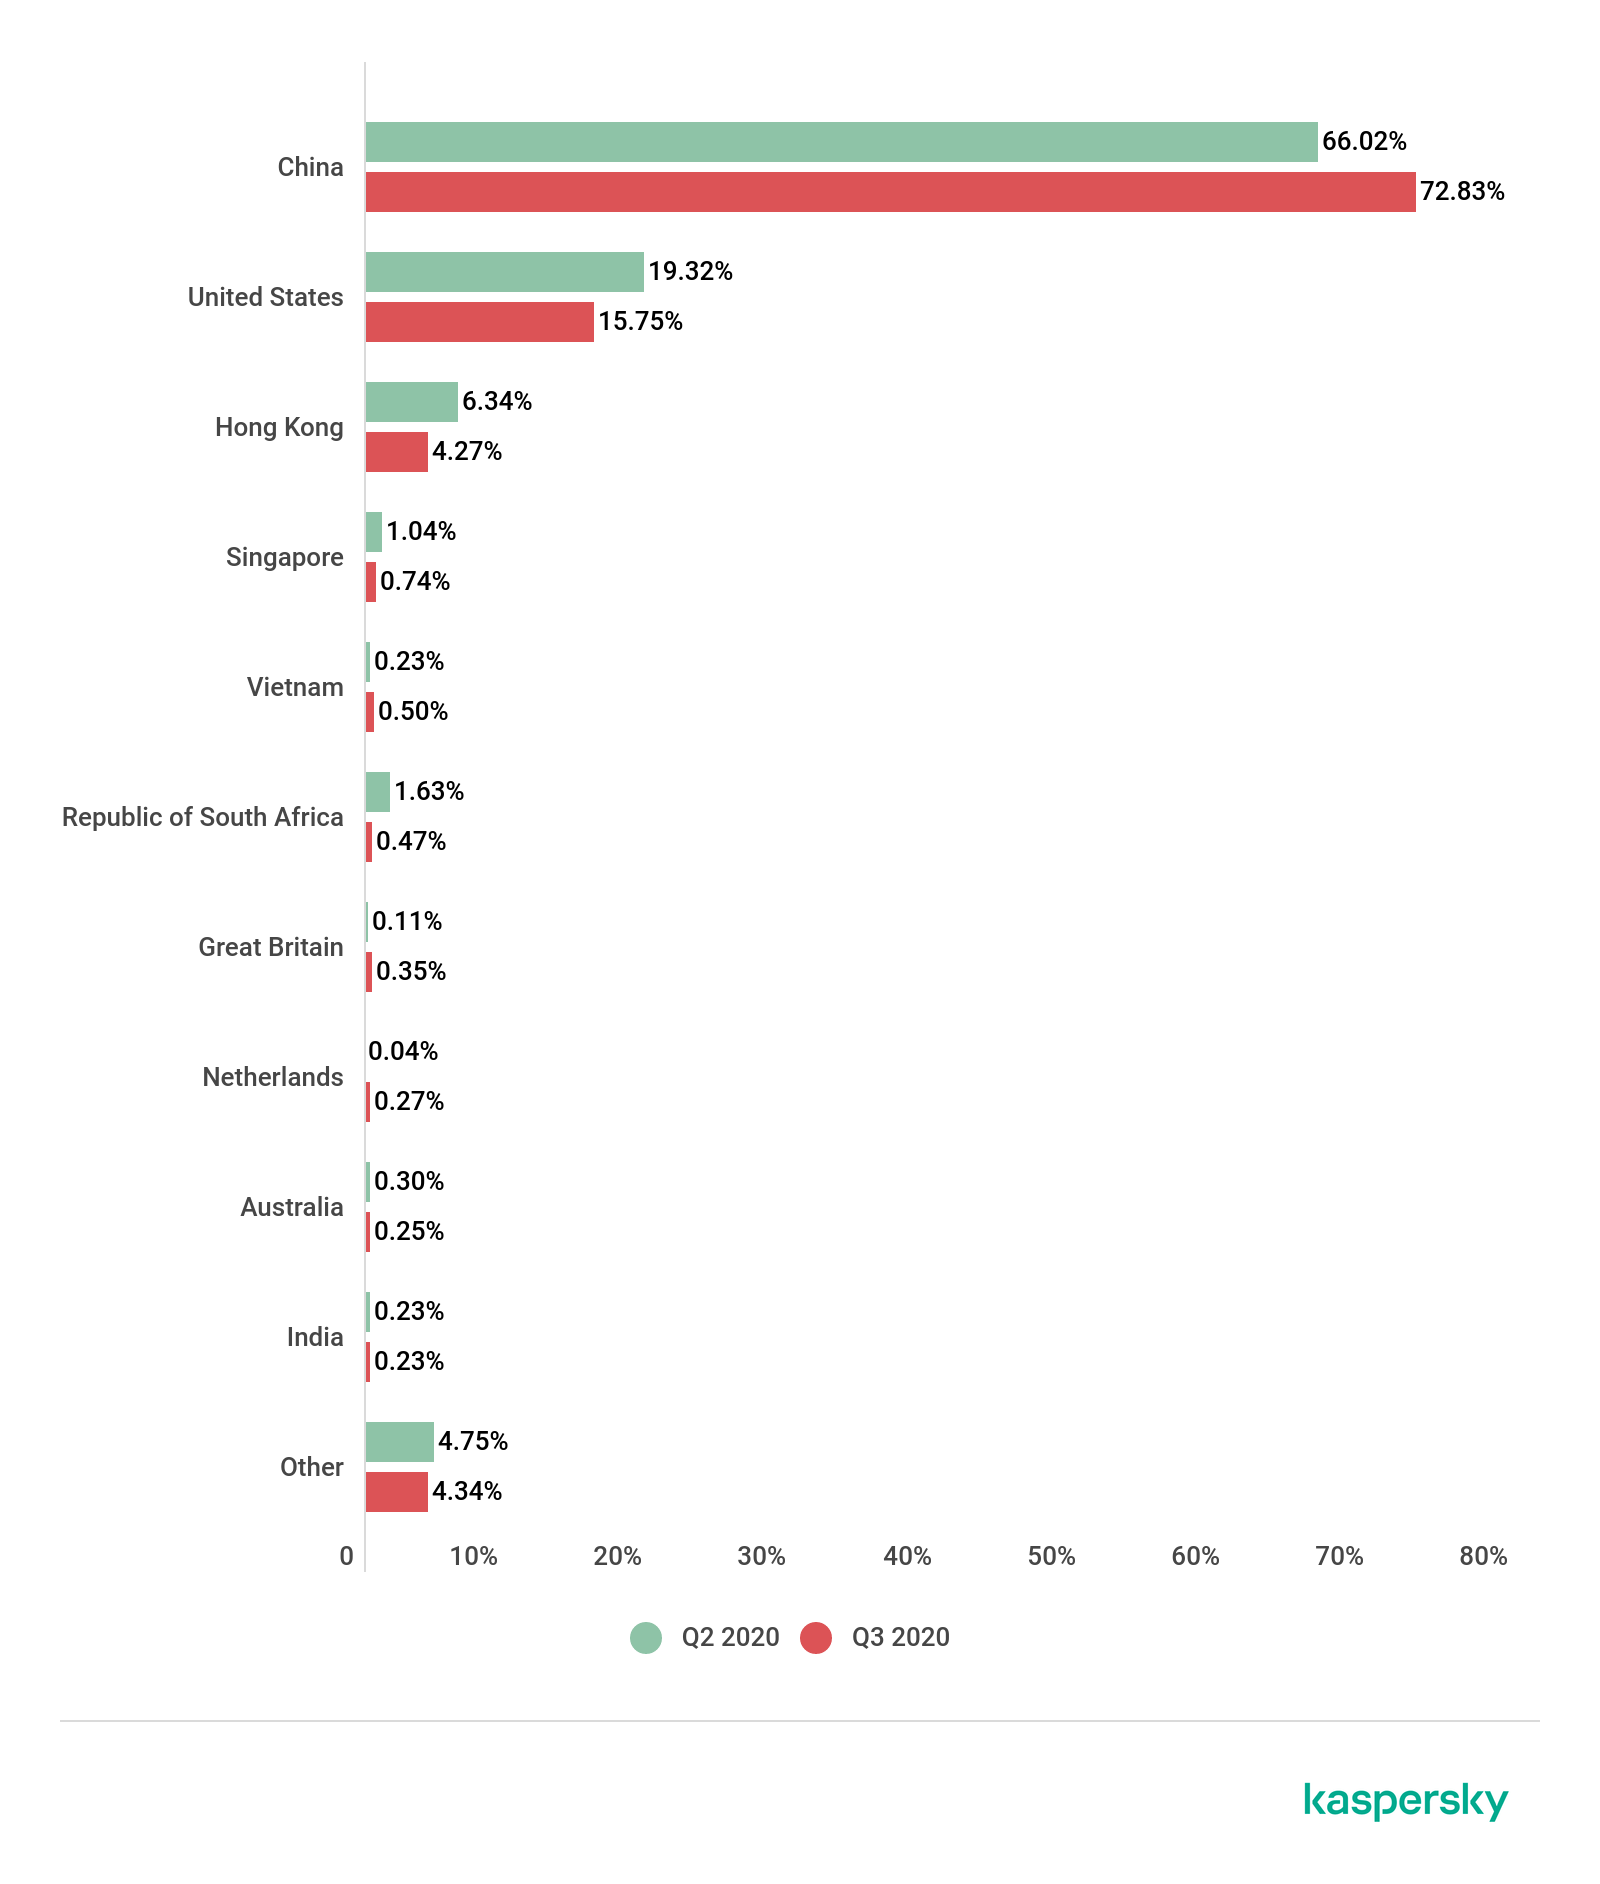
Distribution of unique DDoS-attack targets by country, Q2 and Q3 2020 (download)
Dynamics of the number of DDoS attacks
The number of attacks this quarter varied significantly. On the one hand, at peak activity, DDoS operators broke the previous period’s record: on July 2, we registered 323 attacks (compared to 298 in April). On the other, this quarter had a few surprisingly calm days: August 31 and September 1/7 saw only one registered attack each. Overall, late August–early September was quite mild: during the two weeks from August 25 to September 7, the number of attacks exceeded 100 on just one day (181 on September 5), and as many as eight days registered fewer than 10.
Another curiosity is the difference between the peak and the indicators closest to it. In the past few quarters, there has been no significant difference in the number of attacks on the 2–3 most active days. Q3 broke the mold: the next most attack-intensive day after July 2 — July 13 — scored almost 20% fewer attacks, 260 in total. On average, there were approximately 106 attacks per day in Q3, which is 10 fewer than in the previous quarter.

Dynamics of the number of DDoS attacks, Q3 2020 (download)
Besides Saturday and Thursday, Monday also increased its share of attacks, although not significantly, while the remaining days saw their percentage fall accordingly.

Distribution of DDoS attacks by day of the week, Q2 and Q3 2020 (download)
Duration and types of DDoS attacks
The average attack duration in Q3 continued to shorten. This can be explained by the increase in the share of ultra-short attacks (this time by a significant 5.09 p.p.). However, unlike in the previous reporting period, the share of long (100–139 hours) attacks decreased inappreciably (by just 0.08 p.p.), while the share of ultra-long attacks even rose slightly (by 0.18 p.p.). Whereas in Q2, the longest attacks did not even reach nine days, this quarter we registered two lasting over 10 days (246 and 245 hours), and the number of attacks lasting 5–10 days increased by 1.5 times.
As such, the following picture emerged: the bulk of attacks (91.06%) lasted up to four hours; 4.89% lasted 5–9 hours; 2.25% lasted 10–19 hours; 2.09% lasted 20–49 hours; 0.4% lasted 50–99 hours; and just 0.08% lasted 100–139 hours. Unusually, this quarter the number of attacks lasting 140 hours or more is actually greater than the number of attacks in the bracket before it, accounting for 0.23% of the total number of DDoS attacks.

Distribution of DDoS attacks by duration (hours), Q2 and Q3 2020 (download)
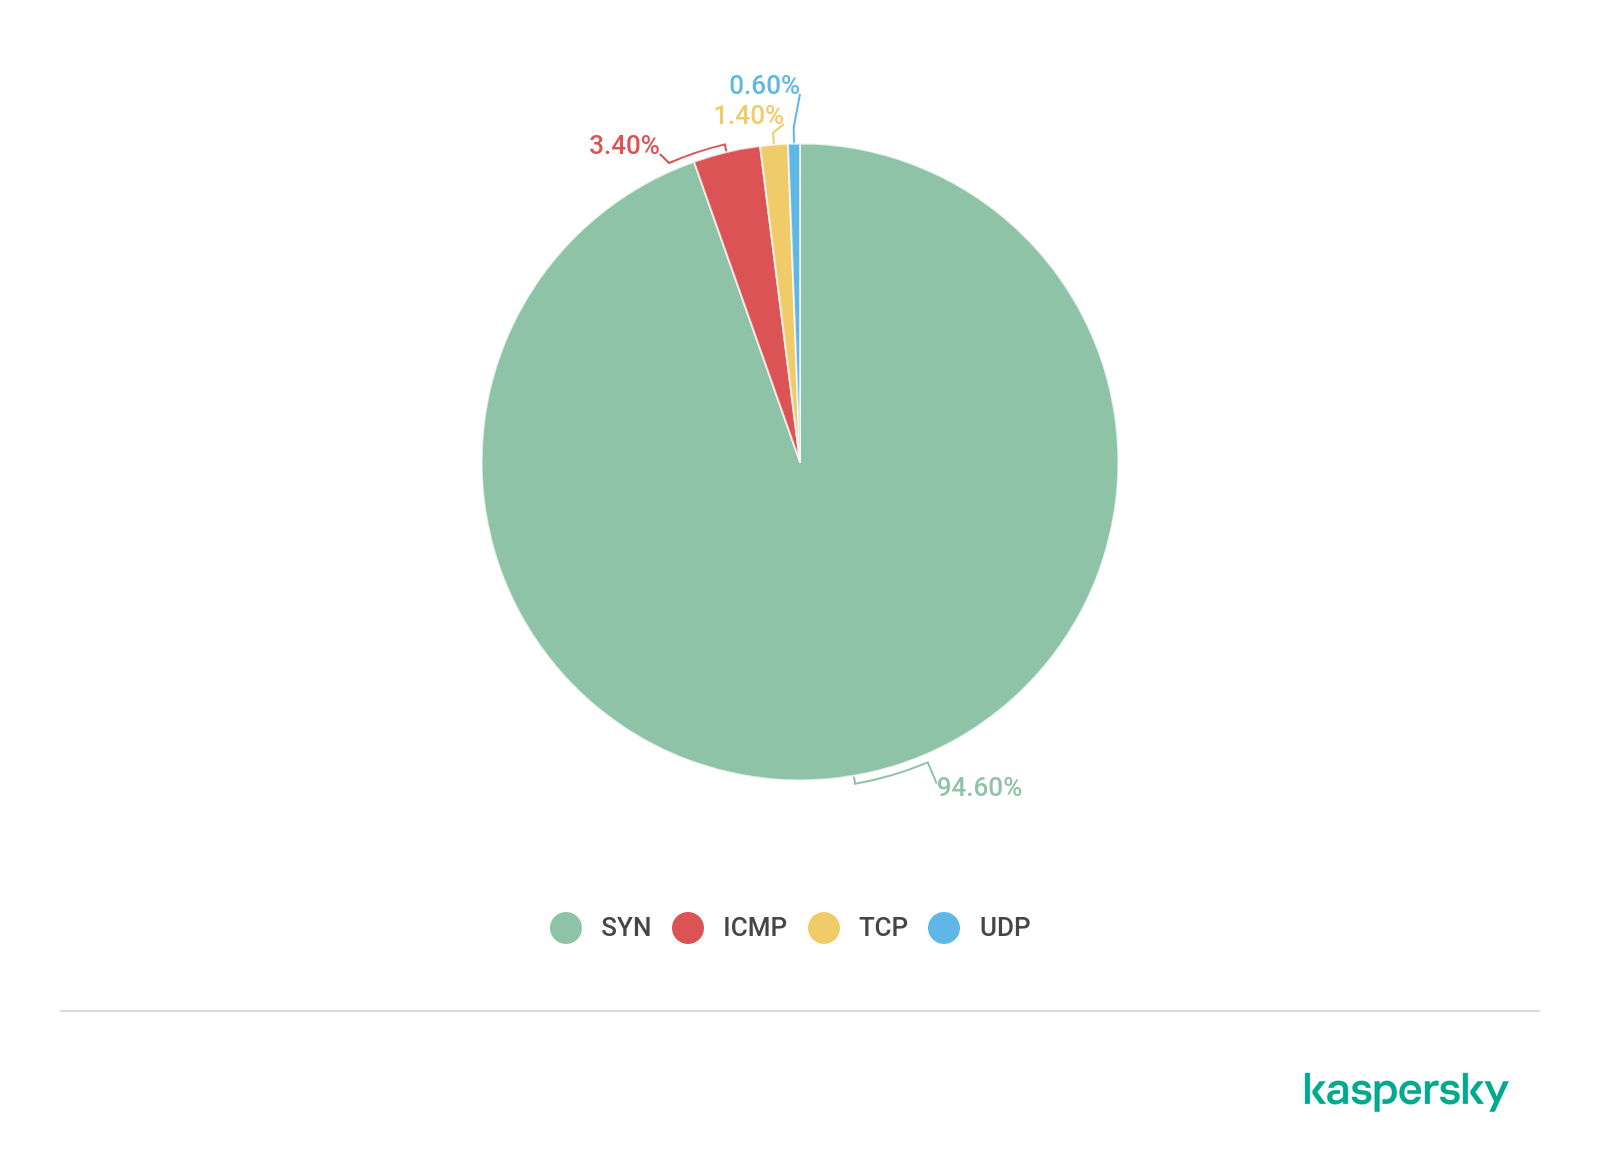
Distribution of DDoS attacks by type, Q3 2020 (download)
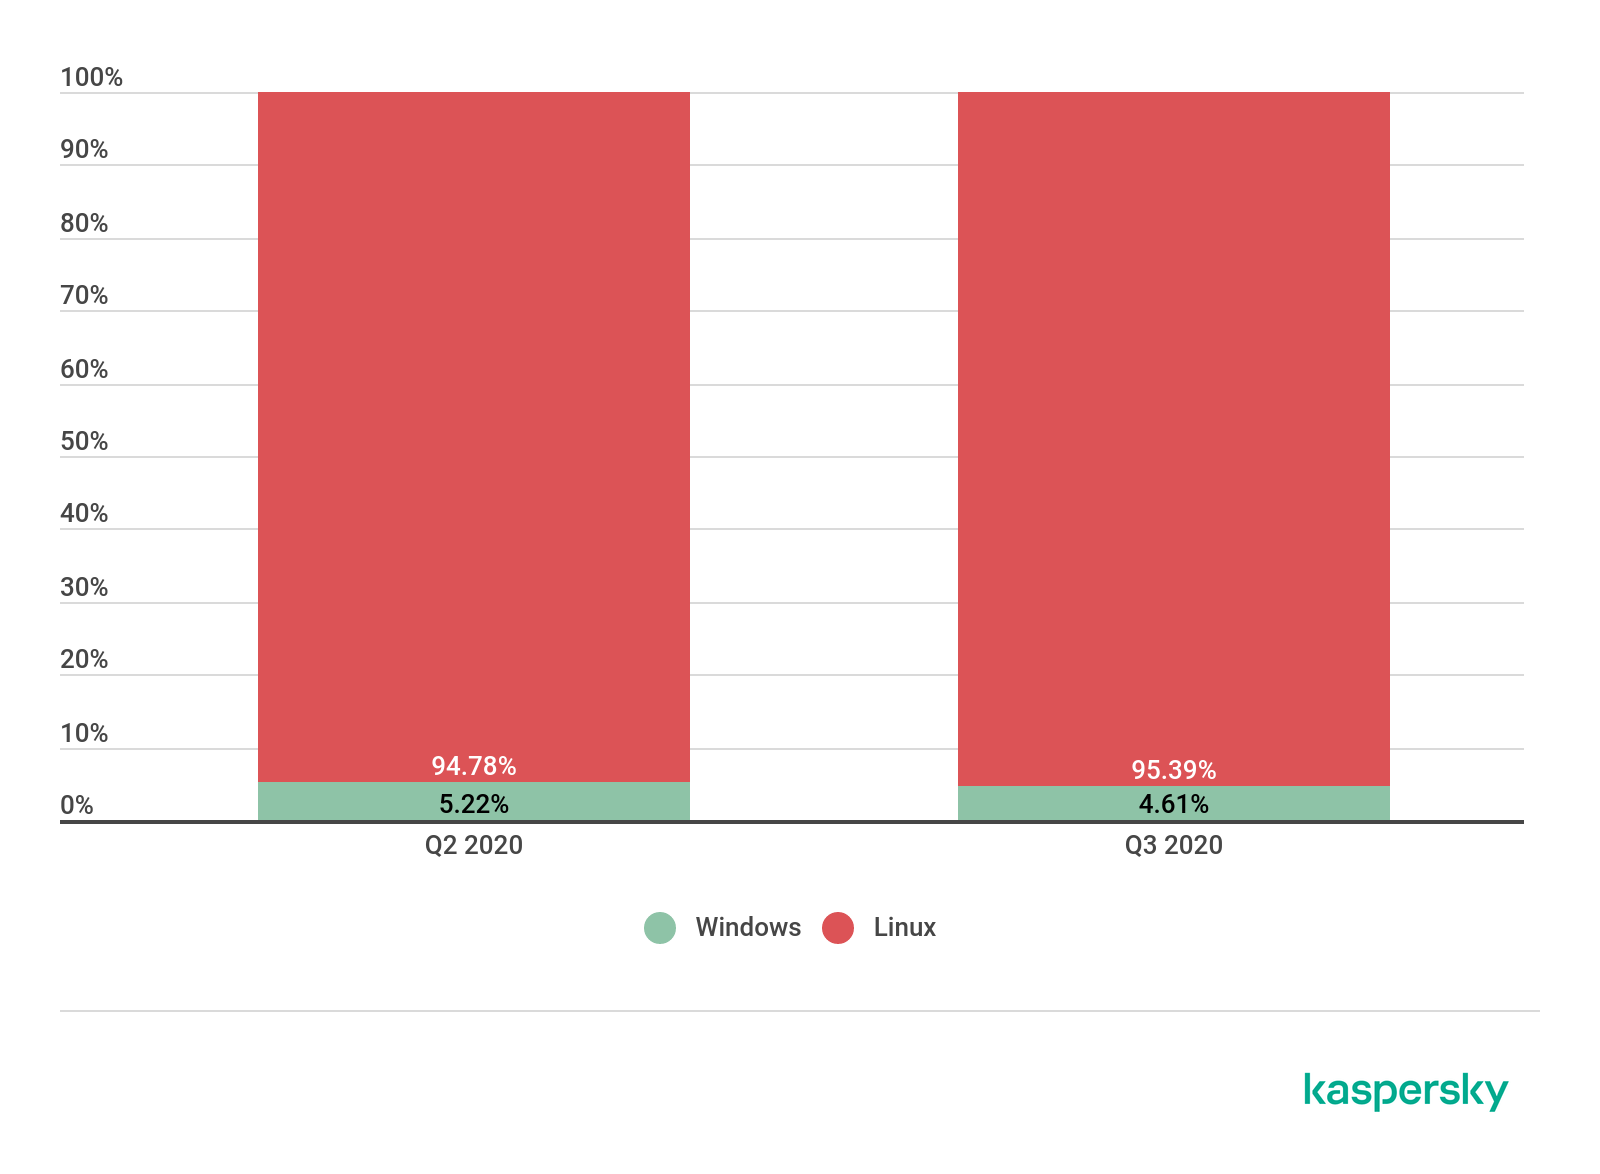
Ratio of Windows/Linux botnet attacks, Q2 and Q3 2020 (download)
Conclusion
If Q2 2020 surprised us with an unusually high number of DDoS attacks for this period, the Q3 figures point to a normalization. Judging by the number of unique targets, in comparison with last quarter, cybercriminals were more attracted by European, and less by the Asian countries, such as Japan and South Korea, although interest in China is still high and continues to grow in terms both of unique targets and of attacks. Growth was observed in the number of short and ultra-short attacks, as well as multi-day ones. The sharp contrast between the highest and lowest number of attacks per day is curious. Taken together, these indicators mark Q3 2020 out as somewhat contradictory from a DDoS viewpoint.
It will be interesting to see what Q4 has in store. Barring major shocks, we expect to see indicators comparable to those at end-2019. Back then, after almost two years of growth, the DDoS market more or less stabilized.
Q4 is usually a hot time due to the Christmas and New Year sales frenzy. End-of-year figures are typically around 30% higher than those of Q3. We expect to see a similar picture this year, although, after the abnormally active Q2, it would be foolhardy to make cast-iron predictions. That said, if nothing else extraordinary happens in this more-than-extraordinary year, we see no reason for the DDoS market to experience a significant swing in either direction in Q4.



DDoS attacks in Q3 2020