

Authors
Kaspersky Anti-Spam protects users all over the world. The Anti-Spam Lab processes more than one million messages captured by our honeypots every day. Content filtering, technical header analysis, unique graphical signatures and cloud technologies are all employed to ensure users are protected, with our analysts creating new signatures 24 hours a day, 7 days a week.
- Kaspersky Security Bulletin. Malware Evolution 2011
- Kaspersky Security Bulletin. Statistics 2011
- Kaspersky Security Bulletin. Spam Evolution 2011
The year in figures
- The percentage of spam in mail traffic averaged 80.26%
- The share of phishing emails decreased by a factor of 15 and averaged 0.02% of all mail traffic.
- The percentage of emails with malicious attachments grew 1.7 times and averaged 3.8%.
Trends of 2011
Spam is decreasing
The effective anti-botnet campaign of 2010 resulted in a considerable decrease in the percentage of spam in mail traffic. In 2011 the share of spam averaged 80.26% which continues a downward trend following a peak in 2009.
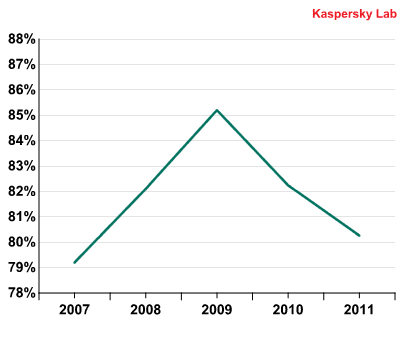
Spam in mail traffic, 2007-2011
As can be seen from the graph, the amount of spam in mail traffic has been decreasing over the last two years. There are several reasons for this. First, law enforcement and industry expertise continues to close botnet command centers: in 2011, Rustock and Hlux/Kelihos were closed. Secondly, spammers are increasingly focusing on targeted mass mailings. For example, the participants of pharmaceutical partner programs distribute their mailings using address databases typically stolen from men’s web resources. The volume of targeted spam mailings is substantially less than that of the general mailshots, while the feedback is potentially higher. Thirdly, for several years spammers have been taking regional differences into account when advertising their wares. For example, in the USA and Western European countries the percentage of medical spam and adverts for fake designer goods was noticeably higher than in Russia and the CIS countries, even though there is a huge amount of this sort of spam on the Russian sector of the Internet. From this aspect 2011 was a crucial turning point – due to limited resources, members of pharmaceutical partner programs had to exclude RuNet addresses from their databases, reducing the share of partner spam on the Russian segment of the Internet.
Targeted phishing attacks
The year 2011 was marked by the appearance of so-called spear phishing, a more targeted type of spam that sees fraudsters focusing on a pre-selected group of users rather than distributing emails to random addresses.
Spear phishing is not just one specific spammer trick but a whole toolbox of methods which differ in terms of the complexity of their execution and their ultimate goals.
It may be similar to traditional phishing, an attempt to pick up user credentials and get access to their accounts. For example, one of the schemes involves an attack on a group of users that are clients of a specific service. They obtain an exact copy of the official notification used by that service containing a link to a registration page which is also a perfect imitation of the original. It has been claimed that Chinese cybercriminals used this scheme to access the Google accounts of high-ranking US officers. This has a much smaller audience than traditional phishing, but is far more targeted.
It should be noted that spear phishing scams are often much more sophisticated. We are used to an impersonal form of address in phishing emails such as “Dear user” or “Dear client”. However, more subtle methods make use of both a person’s name and even the name of the company they work for or are dealing with. Currently, the phishers have few problems obtaining this information – many users of social networking sites do not hide their data. Using such information makes it much easier to trick an unsuspecting user – after all, the phishing email looks just like the original notifications used by the service in question and even contains the user’s name.
Spear phishing is also used by criminals to target big companies as was the case with RSA, the security division of EMC, attacked in March 2011. Having attacked several groups of the company’s employees, the fraudsters succeeded in making at least one RSA staff member open a file entitled “2011 Recruitment plan.xls.”. The Microsoft Excel file contained an incorporated exploit which used a zero-day vulnerability. As a result the phishers gained access to the company’s systems and stole data belonging to RSA.
Spear phishing can constitute a threat because the messages sent in the course of these attacks are not numerous and sometimes even unique. Antivirus solutions often don’t detect such emails as spam. Organizations targeted by these phishers can be protected by DLP, a security system that prevents data leakage. For individual users the last line of defense on the phishers’ path to their financial, personal or other data is the human factor. Cautious and critical users are perfectly capable of avoiding the danger and escaping the traps set by phishers.
Users should remember that no matter how skillfully the phisher imitates the design of the email and registration form, he still has to use a domain unrelated to the organization which allegedly sent the notification. If you are asked to enter your login information on the website of the bank or any other online service, please don’t follow the link in the email to access the site of the organization. It’s better to go there manually through your browser. It is also important to remember that online services never ask their clients to send their credentials via email.
We expect to see more and more spear phishing attacks in the near future and recommend users to be on the lookout for them.
The year of malicious spam
Even if there is less spam in general, it seems that what remains is more dangerous than ever. In 2011 the percentage of spam with malicious attachments increased more than one and a half times compared to the previous year and reached 3.8% of all mail traffic. In addition to emails with malicious attachments there were also messages containing links to malicious resources.
The proportion of emails with malicious attachments remained consistently high throughout the year.
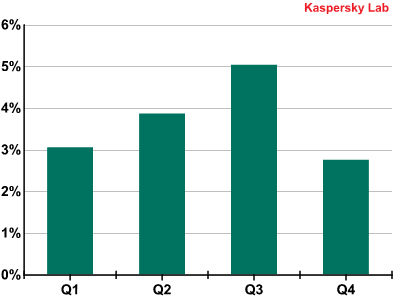
Percentage of spam with malicious attachments in 2011
As can be seen from the graph below, the last three years have seen a clear trend in mail traffic: as the proportion of spam decreases, the number of malicious attachments increases.
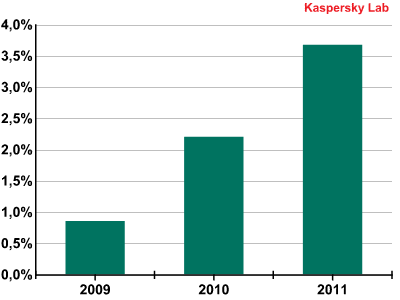
Percentage of spam containing malicious attachments, 2009-2011
Malicious spam and social engineering techniques
Malicious spam is often distributed using social engineering techniques: the fraudsters must entice a user to open an attachment or click a link. In 2011, cybercriminals were quite inventive and came up with various methods to pursue their goals.
- Imitation
Malicious emails imitated notifications from social networks, delivery services, Federal Tax Services and credit companies.
- Intimidation
Phishing emails were aimed at intimidating users by playing on their fears: they threatened to block their accounts, to infect their computers or to use their accounts for spam distribution, and tricked users into handing over their logins and passwords on phishing sites.
- Enticement
The promise of gifts, free coupons, activation codes for different products and other goodies was enough to persuade some users to open a attachment or click a link.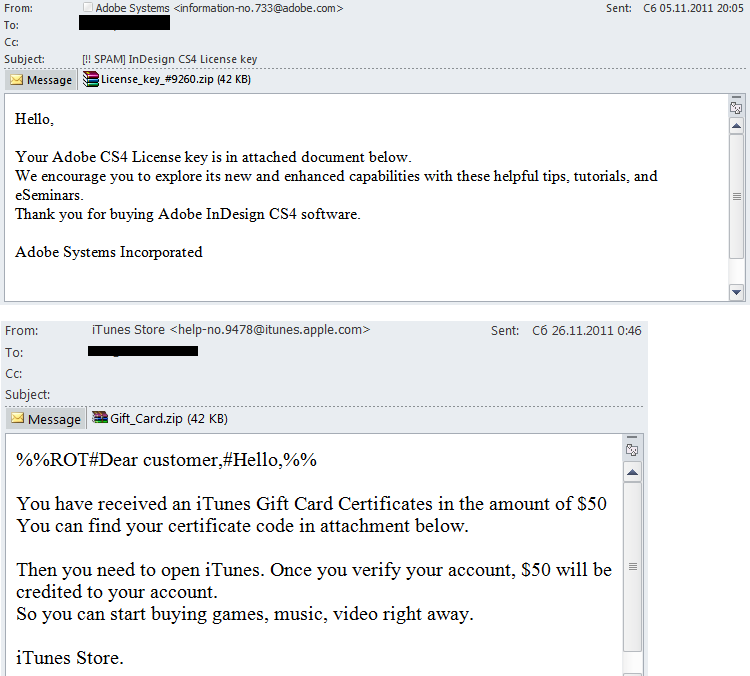
- Other tricks
More often than not the fraudsters exploited the users’ curiosity or gambled on the recipient’s lack of caution. The attachments imitated a scanned copy of a document, e-tickets, email password recovery instructions, etc. Sometimes a user was asked just to open an attachment.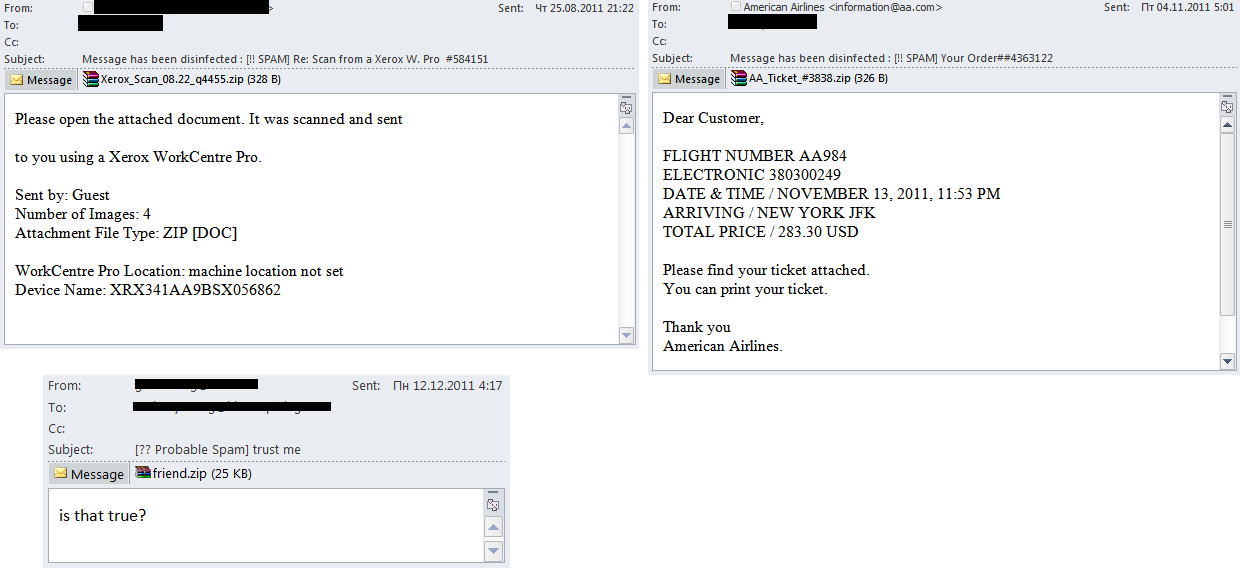
The story of one mass mailing
In Q4 2011 fake notifications from the National Automated Clearing House Association (NACHA) appeared regularly in users’ inboxes. NACHA is a big not-for-profit association which develops the operating rules and practical issues of conducting business for Automated Clearing House (ACH). It also manages other issues related to electronic payments. In its turn ACH manages the world’s biggest network of the electronic movement of money and data.
Fake notifications from NACHA invited users to open an attachment or to follow a link in order to cancel transactions.
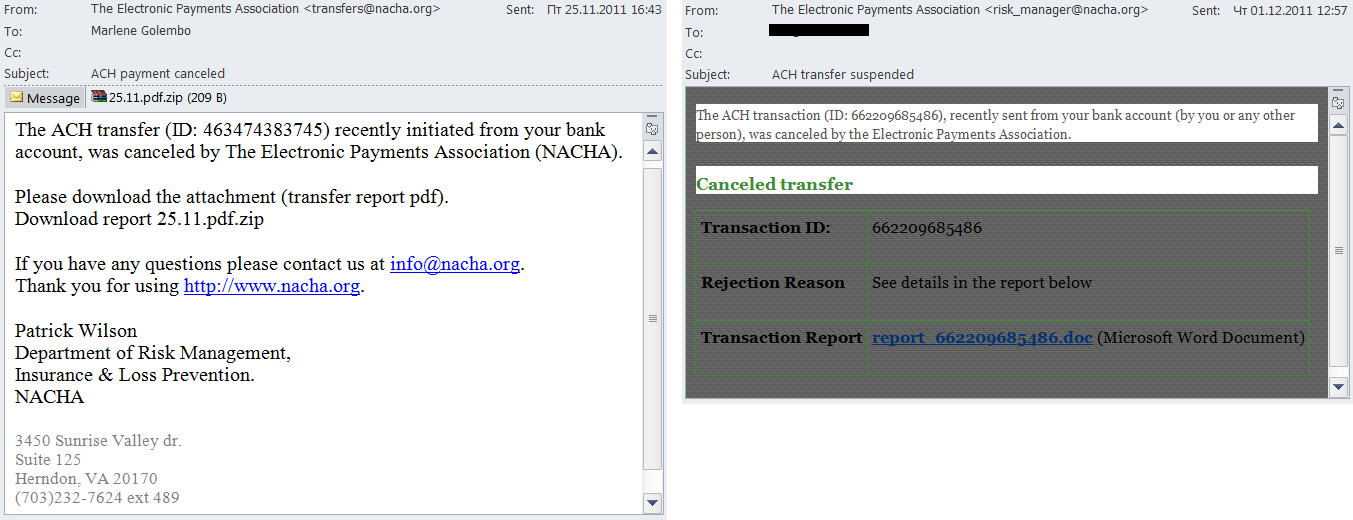
It is clear why this sort of approach is used – the cybercriminals are trying to cover a wider audience spreading emails on behalf of a controlling authority rather than a bank. In fact, very few people know that NACHA does not have the right to control ACH transactions, let alone cancel them.
On clicking the link in the email, users were taken to a web page infected with javascript code redirecting visitors to a malicious resource containing exploits. Interestingly, the fraudsters were overcautious: one web page contained four redirects to one and the same malicious site, simply because such redirects were mostly located on compromised legitimate sites. The owners of the sites might notice the intrusion and delete the script at any time. In addition, the company’s IT security service usually reacted quickly and denylisted such URLs.
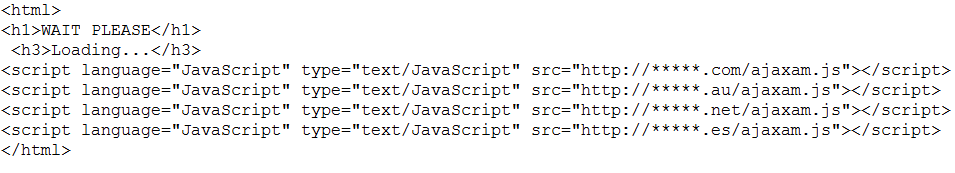
All redirects led to the same malicious resource where the fraudsters had set up one of the most popular and effective exploit kits – BlackHole.
Spammer methods and tricks
Redirects and other links
When launching a mass mailing spammers always try to hide their client’s contacts – the telephone number, the site, etc.; otherwise, any spam filter can put such contacts on a denylist and block all mass mailings where it is mentioned. In an effort to bypass filtration systems, spammers use a variety of methods – they create background “noise” in messages using extra symbols or image distortion, write numbers in words, add HTML tags invisible to users, place contact information on “noisy” images, etc.
In 2011, the spammers’ favorite trick for hiding a link to advertising or malicious sites was redirection: the email contained a link to a web page which redirected the user to the main site.
URL shortening services
The easiest redirect technique is to use URL shortening services such as tinyurl.com or bit.ly. Their initial task is to make long and inconvenient links shorter in length. Spammers use such services to make each link unique. These short links can mask both the links to the sites and the links to downloadable images.
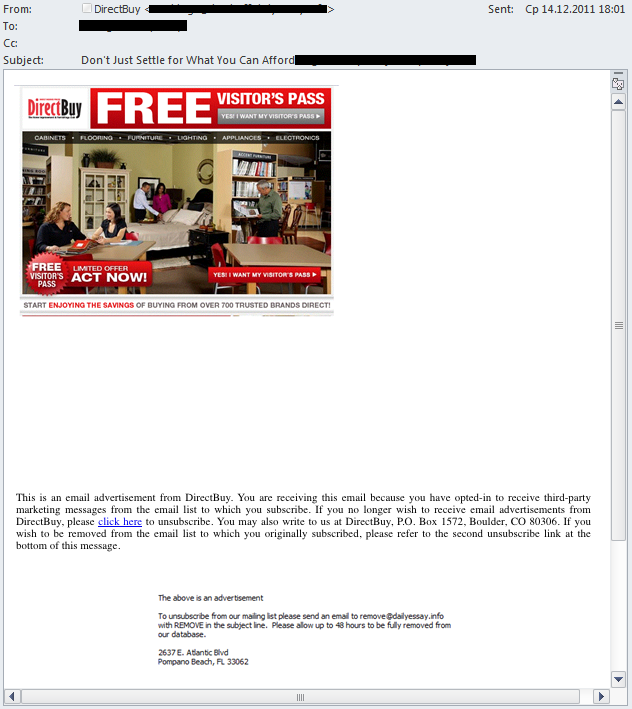
This is how the email looks on a user’s computer:
This the initial code of the html part of the email:
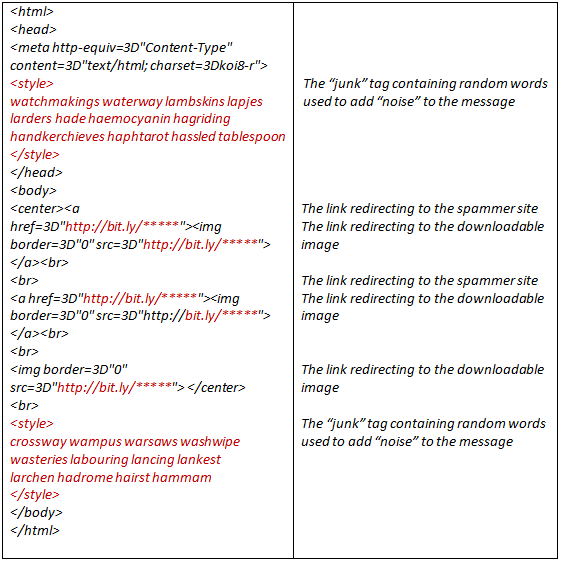
Therefore, the message which the user sees as images with links to the site actually contains non-recurring links and random text.
Infected sites
Another redirect technique uses compromised sites where cybercriminals insert iframe or javascript code or use other HTML (or TCP/IP protocol) opportunities to redirect users to their site. One example of such a redirect was described in the section above ‘The story of one mass mailing’.
SQL injections
This redirect technique is quite new and still not very common. A spam email using this method contained a link which led to a legitimate site vulnerable to SQL injections.
a href=”https://media.kasperskycontenthub.com/wp-content/uploads/sites/43/2012/03/08122705/This-redirect-technique-is-quite-new-and-still-not-very-common.png”>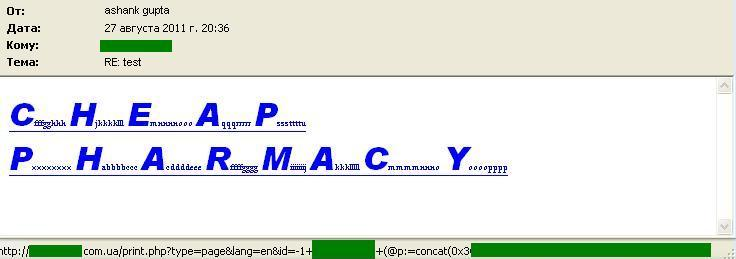
The link contained the SQL request which in return gave the javascript code:
|
1 |
<script> document.location='hxxp://drug*****.net'; <script> |
It was this script that redirected the user to the spam site.
‘Clouds’
The use of free resources to place links to spammer sites is nothing new. However, in 2011 these free resources appeared in the form of the increasingly popular ‘cloud’ office applications. The spammers gave links to Google services including Google Docs and Google Spreadsheets, to which they added links to their sites.
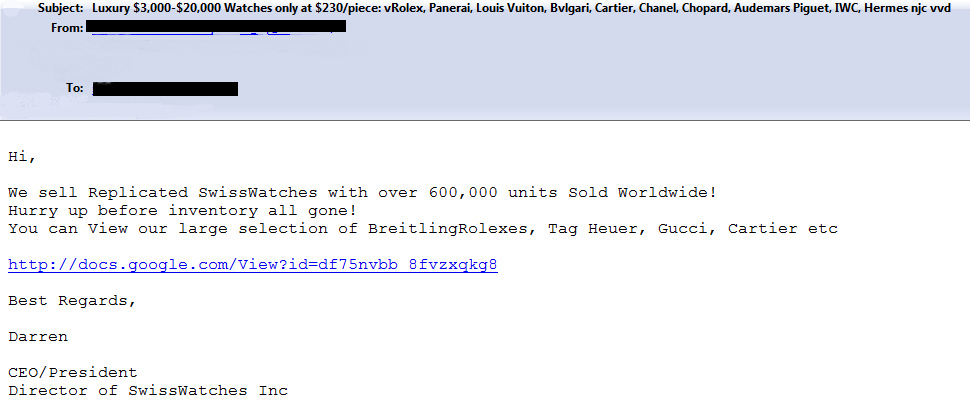
Additionally, Google Spreadsheets “housed” phishing pages where users were asked to enter the login and password to their email boxes.
It’s not just free Internet space: phishers gained other advantages. Their code was located on a popular resource while the connection was performed via an HTTP protocol which supported encryption – this is enough to deceive even the most cautious user.
However by the end of the year such mass mailings had disappeared. Most likely Google toughened its security policy and became more careful about unsolicited pages on its resources.
How to make a user click that link and open the attachment
All redirect techniques will only work if the user clicks the link. In order to make them do so the spammers used both old and new tricks.
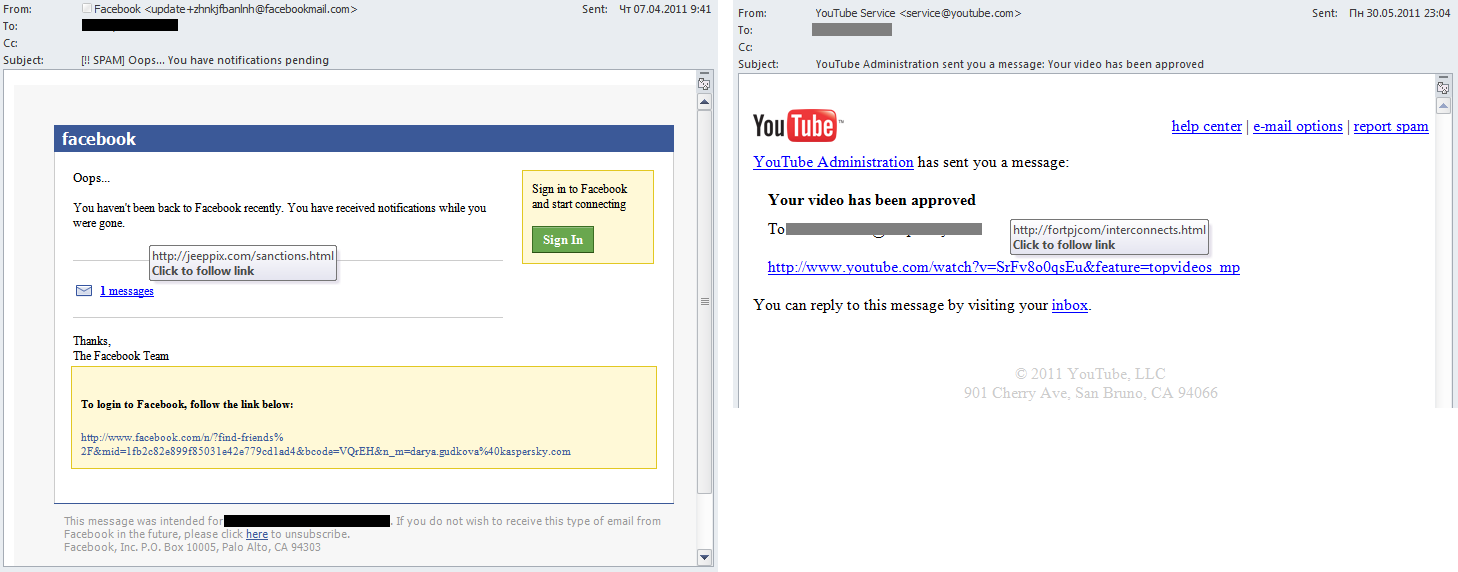
First of all, they tried to make their emails exact copies of legitimate notifications from social networking sites and popular services. Web2.0 resources are so popular that the majority of people are used to seeing such notifications in their email boxes and they generally do not expect them to be forged.
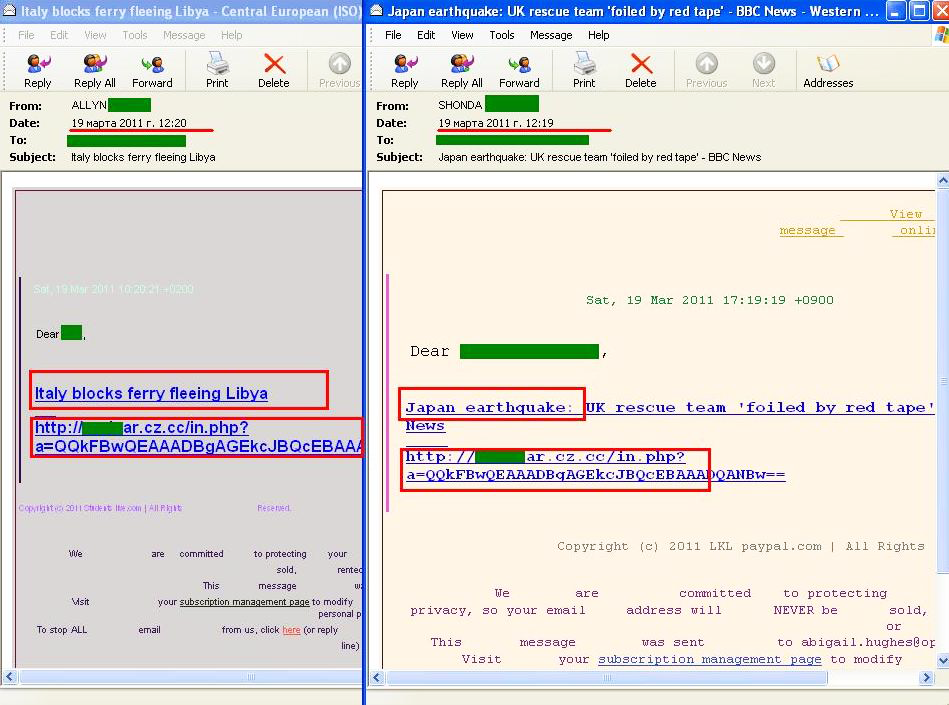
Secondly, the fraudsters used every trick in the bag to attract attention to their mass mailings. This usually entails the spammers exploiting the most popular topics being discussed in the news.
For example, in March spammers focused on two themes – the earthquake in Japan and the war in Libya. The most noticeable mass mailing exploited both themes simultaneously.
The death of a famous person also got the spammers busy. In May, for example, the users were invited to watch the shocking video of Osama bin Laden’s death. In June, before the anniversary of Michael Jackson’s death mass mailings appeared offering “incontestable evidence” that the singer was still alive. In October when Steve Jobs passed away, malicious mailings were masked as inside information on how Apple’s business was coming to terms with the death of its founder.
Besides the tried and trusted trick of using hot topics in spam in 2011 the fraudsters utilized other methods. Mass mailings which promised erotic photos of beautiful girls were no longer so prominent. Probably this hackneyed trick had become too familiar to users and most of them had started to recognize the malicious attachments that came along with them. In place of sex came money – emails mimicked the form and content of corporate correspondence and came with an attachment with a simple name like “The Bill” or “Internal documents”.
Fraudulent spam
Many spam campaigns in 2011 were linked to fraudulent money-making schemes.
Spammers exploited the tragedy in Japan by distributing fraudulent emails that claimed to transfer money to help the victims of the earthquake.
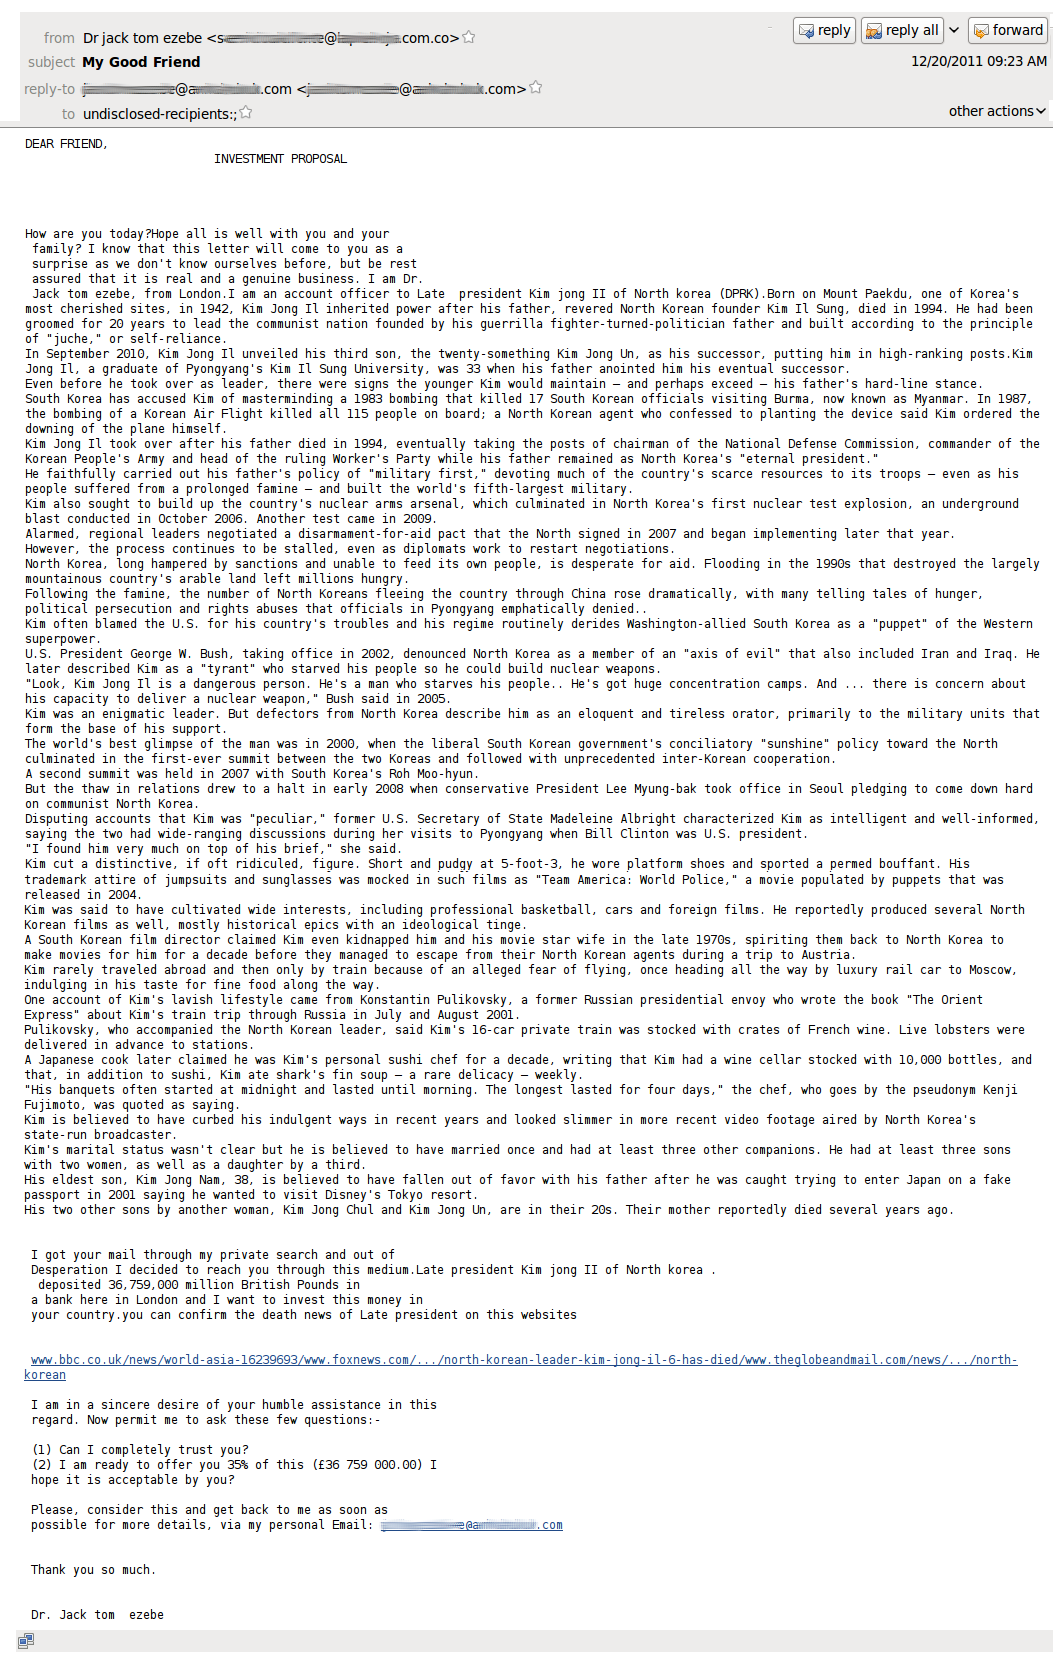
The names of Muammar Gaddafi and Kim Jong-Il were used in “Nigerian” spam. The fraudsters introduced themselves as the leader’s relatives or friends or enemies trying to extort money from compassionate users.
Statistics for 2011
Spam in mail traffic
As was mentioned above, in 2011 the proportion of spam in mail traffic decreased considerably compared to the previous year: in 2010, it averaged 82.2%; in 2011 the figure was 80.26%.
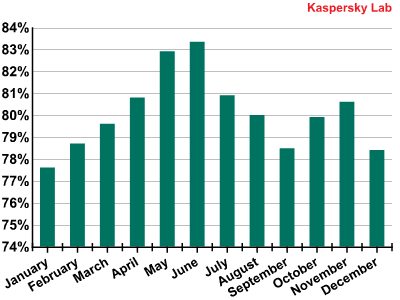
The percentage of spam in mail traffic, 2011
The share of spam grew steadily in the first half of the year. However, in the second half of the year the situation changed. This resulted in the final figure for 2011 not reaching the previous year’s level let alone the record-breaking “achievements” of 2009.
Spam by region
In 2011, the amount of spam originating from Asia and Latin America grew noticeably. These two regions accounted for more than half (59.02%) of all outgoing spam. The contribution of North America remained at a low level after their sharp decline at the end of 2010.
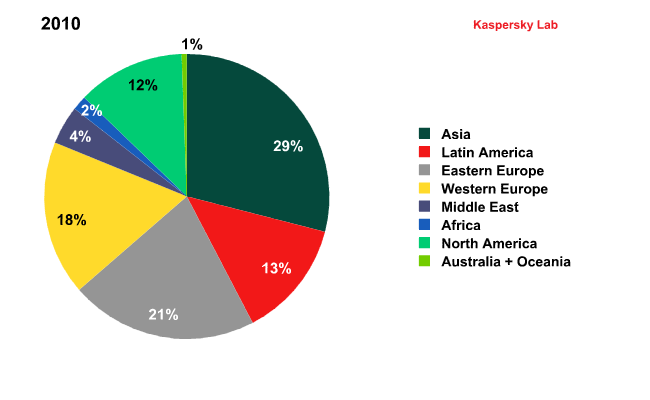
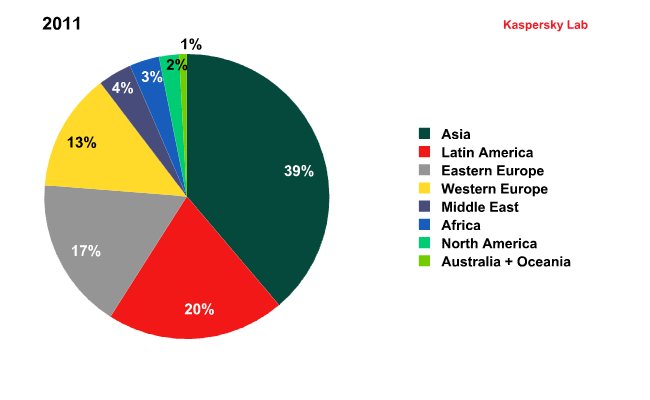
Spam by region in 2010 and 2011
The spam distribution dynamics for Asia and Latin America are strikingly similar.
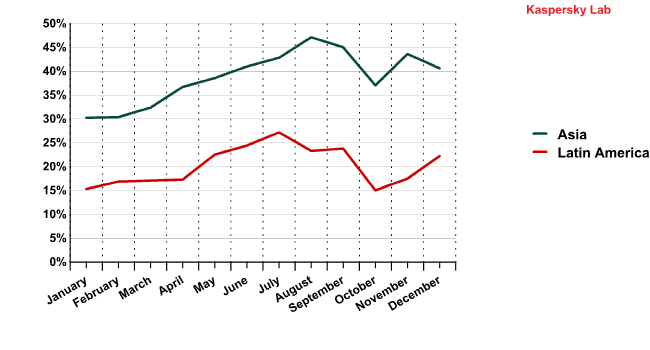
The spam distribution dynamics for Asia and Latin America in 2011
This fact indirectly confirms that infected computers in Asian and Latin American countries are hooked into the same botnets. The increase of these regions’ contribution to world spam traffic means the size of the botnets grew in 2011. In our monthly spam reports we wrote about the causes of this: good Internet connections combined with low computer literacy and the absence of anti-spam laws in most countries of the region made them especially attractive for the bot owners.
Africa also slightly increased its figures: though this region is not so actively involved in spam distribution, it is steadily increasing for the same reasons as in Asia and Latin America.
In 2011, Western Europe’s share fell by 4 percentage points. It’s interesting that such a big, highly-computerized region produces less and less spam from year to year. Thanks to high computer competence and effective anti-piracy campaigns users’ computers are generally equipped with regularly updated software and licensed antivirus programs. It is not easy for the fraudsters to infect such machines and yoke them to their botnets.
Spam by country
The increase in the share of junk emails distributed from these regions affected the list of Top 20 sources of spam.
The USA, last year’s leader, could not even get into the Top 10 occupying 16th place in the rating. Russia also lost its prominent position dropping from 3rd to 9th place (-2.8 percentage points). The Top 3 most popular spam sources included India (+4 percentage points), Brazil (+3.4 percentage points) and Indonesia (+5.15 percentage points) which was previously only 16th in the rating.

Spam by country in 2011
The leading European spam senders Italy and the UK are still in the Top 10. The spam distribution dynamics in these two countries is similar. Probably, the computers here are “members” of the same botnets.
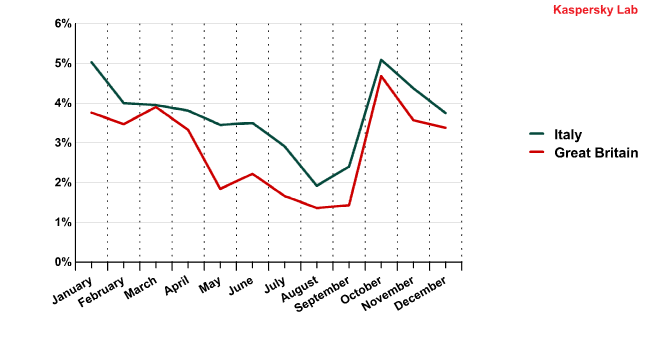
The spam distribution dynamics for Italy and the UK in 2011
Size of spam emails
2011 saw a decrease in the size of spam emails. In Q1 the number spam emails that were more than 100 KB grew. However, in the second quarter of the year their volume reduced considerably. By the end of 2011 less than 3% of all spam was comprised of emails that were more than 50 KB, while spam emails that were 5 KB or less accounted for 69.46% of all spam.

Spam emails by size in 2011
pam by category
In 2011 the Education category – offers of seminars and training – was well ahead of all other spam categories on the Russian sector of the Internet. Over the year its share fluctuated dramatically ranging from 13% to 60% in different months.
The Top 5 spam categories:
- Education – 35.75%
- Other goods and services – 15.53%
- Real estate – 9.92%
- Medications and health-related goods and services – 9.58%
- E-advertising services – 7.50%

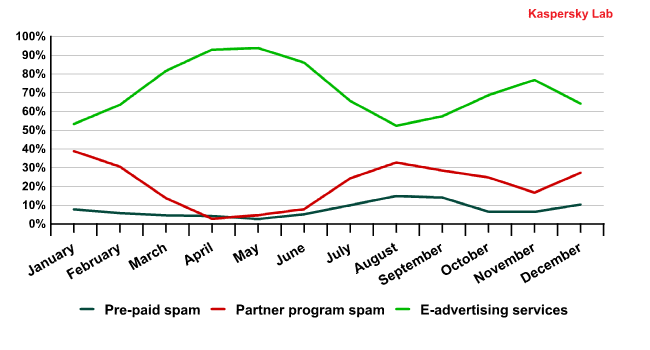
Spam by category in 2011
To recap, all spam categories can be sorted into two big groups – “ordered” and “partner” spam. Ordered spam mostly includes adverts distributed at the customer’s expense. The spread of partner spam is ordered via partner programs. It often advertises unlicensed goods and is used for malware distribution. In this case the spam sender gets money for the quantity of orders or infected computers.
In 2011, the percentage of ordered spam on the RuNet grew considerably. Its share never dropped below 50% during the year. The lowest points were recorded in January and August, the months of traditional seasonal slack. These are the periods when both the volume of partner spam and the amount of spammer self-advertising increases because spammers are trying to regain the attention of clients who have taken temporary “holiday” breaks.
The shares of ordered and partner spam in 2011
In 2010 the situation was different – the amount of partner and ordered spam was almost equal (46.6% and 47.7% respectively). After the closure of botnets in late 2010, bot owners have become more economical with the use of their resources and are trying not to attract unwanted attention to themselves. They have tended to reduce the size of their mass mailings rather than increase them. Instead they make their mailings more targeted, not specifically sending partner spam to those regions where it is not in demand. For example, the main partner category – Medications – has never been popular in Russia, because most medications can be bought there without a prescription. Also, people in Russia usually do not use credit cards to make online purchases, a standard form of e-payment in partner spam. On the other hand, Russia is a zone “free” from anti-spam legislation (only one federal law “On Advertising” in some way touches upon the issue) which is why small businesses make widespread use of this method of advertising. That pushes up the quantity of ordered spam in Russia compared with the USA and other European countries.
Spam and politics
Of course, the spammers could not ignore the Russian parliamentary elections. Four years ago political spam was also actively distributed before the elections, but in 2011 the content of this type of spam was different: four years ago mailings urged people to vote for one party or another, but in 2011 no political party advertised itself with spam. Instead the mass mailings were directed against the ruling party and called for an election boycott or even revolution.
After the elections the spammers continued to distribute political spam. The subsequent rally on Moscow’s Bolotnaya Square was a common theme, and was exploited for commercial ends as well as political.
Phishing
In 2011 the percentage of phishing emails decreased by a factor of 15 and averaged 0.02% of all mail traffic.
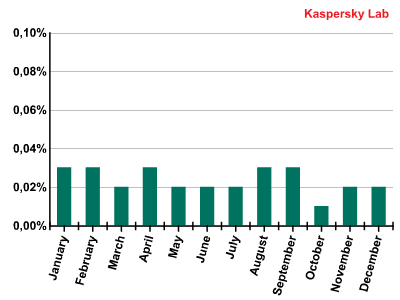
The percentage of phishing emails in mail traffic during 2011
However, the percentage of programs – Trojan-Spy.HTML.gen and Trojan.HTML.Fraud.fc – used for phishing attacks accounted for almost 10% of all antivirus detections. To recap, both programs use spoofing technology and imitate an HTML page. They come with a phishing email containing a link to a fake site resembling that of a well-known bank or e-pay system where the user is asked to enter a login and a password which then are redirected to the fraudsters. The share of emails containing such malicious attachments accounted for 0.35% of all mail traffic.
Top 3 organizations attacked by phishers in 2011
- PayPal 43.14%
- eBay 9.9%
- Facebook 7.04%
The three leaders of the rating remained unchanged from the previous year. Moreover, in 2011 the shares of eBay (9.9%) and Facebook (7%), which occupy 2nd and 3rd places respectively, grew by less than 0.1 percentage points while the contribution of the unsurpassed leader PayPal (43.1%) dropped by 10.2 percentage points compared to 2010.
Besides Facebook, the phishers’ attention was also focused on Habbo and Orkut: in 2011 the percentage of attacks on these social networking sites accounted for 6.9% and 2.6% respectively.
The users of online games also remained popular phishing targets. The figure for World of Warcraft increased by approximately 0.5 percentage points compared to the previous year and reached 2.2%. RuneScape with 2% was almost as popular.
In other words, it’s safe to say that in 2011 the phishers were again concentrating on virtual money and virtual property, i.e. on social network accounts as well as in-game money and characters.
Emails with malicious attachments
In 2011 the percentage of emails with malicious attachments increased 1.7 times compared to the previous year and accounted for 3.8%. Interestingly, the relatively high average figure of 2010 was caused by a summer surge in the quantity of malicious mass mailings, while throughout 2011 the amount of emails with malicious attachments did not drop below 2.5%.
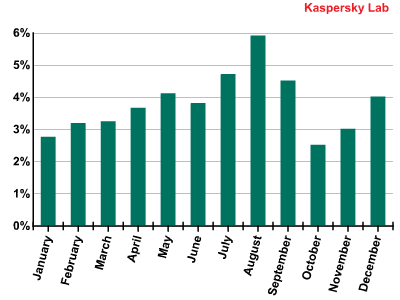
The percentage of spam with malicious attachments in 2011
Once again July, August and September remained the “peak” months for the second year in a row, with spammers using their most creative tricks for malware distribution.
Email antivirus detection levels for different countries
Email antivirus detection rates for different countries in 2011 were as follows:
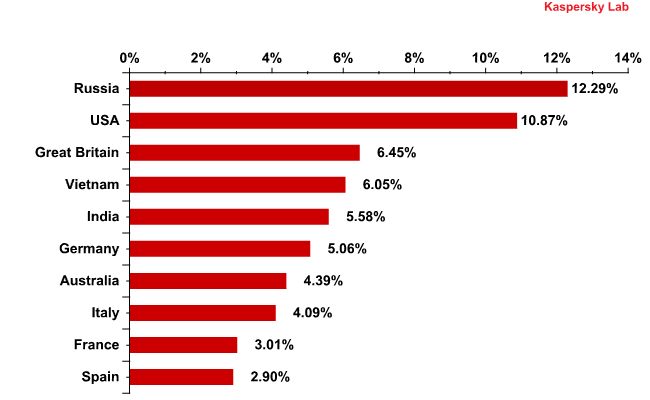
Email antivirus detection levels for different countries
Most malicious attachments in 2011 were found in Russian mail traffic (12.3%) although in 2010 this country was not even among the Top 10 countries on this chart. Email antivirus detections in the US increased by 1.5 percentage points compared to the previous year and accounted for 10.9 %, putting it in second place in the rating. The UK position remained unchanged – in 2011 it came 3rd with the negligible drop of 0.9 percentage points.
The increase in the number of antivirus detections in Vietnam (+2.7 percentage points) and the fall in the German share (-2.6 percentage points) are worthy of special mention.
Interestingly, email antivirus detections in the USA and India operated in inverse cycles: the more malicious emails that were detected in the US, the fewer were recorded in India, and vice-versa
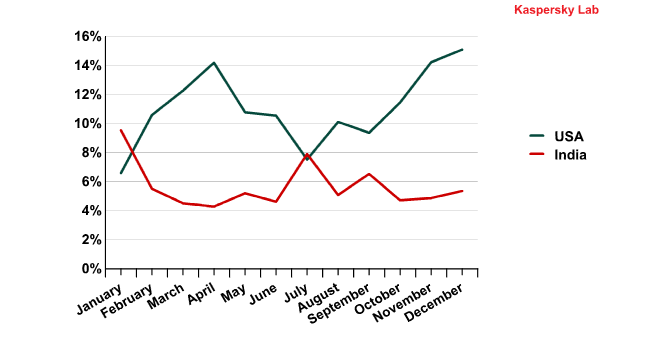
Email antivirus detection activity in the US and India in 2011
This is most likely down to the fact that the malicious programs being sent to these countries are of different character. India receives malicious programs designed to create botnets there while the USA is targeted by fraudsters aiming at personal and financial data. Assuming that spammers’ resources are limited, the picture becomes clear: the same botnets are used both to develop the Indian zombie networks and to earn money by stealing the credentials of American users.
The Top 10 malicious programs distributed via mail traffic
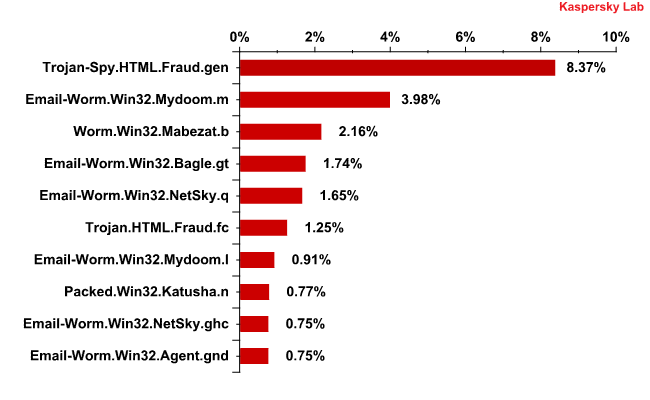
The Top 10 malicious programs distributed via mail traffic in 2011
Trojan-Spy.HTML.Fraud.gen remained the mostly widely-distributed malicious program for the second year in a row though its share decreased by 3.5 percentage points compared to 2010. This Trojan uses spoofing technology and imitates an HTML page. It comes with a phishing email containing a link to a fake site resembling that of a well-known bank or e-pay system where the user is asked to enter a login and a password. More details about this program can be found here.
Worm.Win32.Mabezat.b came third. This worm also sends a copy of itself to all email addresses found on a computer. In addition it copies itself to the local disks and accessible network directories on the infected machine.
Trojan.HTML.Fraud.fc first entered the Top 10 in April 2011 and by Q2 it was already up to 3rd place. According to the annual figures, it occupies 6th place in the rating of the most popular malicious programs distributed via mail traffic. Trojan.HTML.Fraud.fc was designed to steal users’ financial data and appears in the form of an HTML page. It targets Brazilian users because it imitates the registration form of a major Brazilian bank.
In Q2 of 2011 Packed.Win32.Katusha.n was fourth in the rating. However, over the whole year it ended in 8th position. It represents a family of malicious programs used to pack other malware – usually rogue antivirus programs in order to bypass filtering.
Seven out of ten programs in the rating are mail worms. Some of them remained in the Top 10 throughout the whole year.
Mail worms Email-Worm.Win32.Mydoom.m and Email-Worm.Win32.Netsky.q came second and fifth respectively. To recap, their main purpose is to harvest email addresses and spread themselves via mail traffic. Last year these two worms were also in the rating of the most popular malicious programs distributed via mail traffic. In 2011, the amount of emails containing Email-Worm.Win32.Mydoom.m doubled compared to 2010 while the share of Email-Worm.Win32.NetSky.q grew very slightly.
Two more representatives of the mail worm family – Email-Worm.Win32.Mydoom.l and Email-Worm.Win32.NetSky.ghc – occupied 7th and 9th positions. Their functionality is the same as in the aforementioned programs.
Email-Worm.Win32.Bagle.gt, a long-term resident of the rating, was in 4th place. Its functionality is more sophisticated: it not only collects email addresses and distributes itself via mail traffic but also installs other malicious programs once it has penetrated a victim’s computer.
Conclusion
The pressure put on the spam business by the world IT community and law enforcement authorities of different countries has produced encouraging results: the amount of spam in mail traffic went down. However, in general unsolicited correspondence has become more dangerous – the percentage of malicious attachments grew as well as the number of spear phishing attacks.
We expect phishers to be more active in targeting specific groups of users. The number of fake notifications from popular resources will increase. In both cases forged emails will be difficult to recognize. As a result, computers will be exposed to a greater risk of infection and the sensitive data of users and companies face a greater risk of theft.
In order to conserve their resources and bypass anti-spam filters the bot owners will continue to segment their audience, thus reducing the volumes of mass mailings and at the same time making them more effective.
In some regions, for example in Western Europe, the anti-spam campaign has led to a reduction in outgoing spam flows. Asia and Latin America have taken the lead in spam distribution. This situation will remain unchanged until the governments of these regions adopt proper anti-spam legislation. Most likely, Africa will increase its contribution to the world’s spam traffic. The number of computers in this region is growing year after year, and Internet connections are improving, which cannot be said for many users’ computer literacy.
The anti-spam and anti-phishing campaigns should consider these trends and the new strategies being applied by phishers and botmasters. As for users, the new reality demands ever greater caution.
Table of Contents
- The year in figures
- Trends of 2011
- Spammer methods and tricks
- Redirects and other links
- ‘Clouds’
- How to make a user click that link and open the attachment
- Fraudulent spam
- Statistics for 2011
- Phishing
- Emails with malicious attachments
From the same authors


In the same category


Kaspersky Security Bulletin. Spam Evolution 2011