
Authors
This section of the report forms part of the Kaspersky Security Bulletin 2013 and is based on data obtained and processed using Kaspersky Security Network (KSN). KSN integrates cloud-based technologies into personal and corporate products, and is one of Kaspersky Lab’s most important innovations.
The statistics in this report are based on data obtained from Kaspersky Lab products installed on users’ computers worldwide and were obtained with the full consent of the users involved.
2013 in figures
- According to KSN data, in 2013 Kaspersky Lab products neutralized 5 188 740 554 cyber-attacks on user computers and mobile devices
- 104 427 new modifications of malicious programs for mobile devices were detected.
- Kaspersky Lab products neutralized 1 700 870 654 attacks launched from online resources located all over the world.
- Kaspersky Lab products detected almost 3 billion malware attacks on user computers. A total of1.8 million malicious and potentially unwanted programs were detected in these attacks.
- 45% of web attacks neutralized by Kaspersky Lab products were launched from malicious web resources located in the USA and Russia.
Mobile Threats
The mobile world is one the fastest-developing IT security areas. In 2013 security issues around mobiles have reached new heights and attained a new level of maturity in terms of both quality and quantity. If 2011 was the year when mobile malware gained traction, especially in Android-land, and 2012 was the year of mobile malware diversification, then 2013 saw mobile malware come of age. It’s no great surprise that mobile malware is approaching the PC threat landscape in terms of cybercriminal business models and technical methods; however the speed of this development is remarkable.
Obad, probably the most remarkable discovery in the mobile field, is being distributed by multiple methods, including an pre-established botnet. Android-based smartphones infected with Trojan-SMS.AndroidOS.Opfake.a are used as multipliers, sending text messages containing malicious links to every contact on the victim’s device. This has been common practice in the PC threat landscape and is a popular service provided by bot-herders in underground cybercriminal economy.
Mobile botnets actually offer a significant advantage over traditional botnets: smartphones are rarely shut down, making the botnet far more reliable since almost all its assets are always available and ready for new instructions. Common tasks performed by botnets include mass spam mail-outs, DDoS attacks and mass spying on personal information, all of them non-demanding actions in terms of performance and easily achieved on smartphones. The MTK botnet, appearing in early 2013, and Opfake, among many others, are proof that mobile botnets are no longer just a playground for cybercriminals, but have become common practice to serve the main purpose: financial profit.
Significant Events
- Mobile Banking Trojans
These include mobile phishing, theft of credit card information, from a bank card to the mobile account and finally to a QIWI wallet. In 2013 we also saw mobile Trojans which could check on the victim’s balance to ensure the maximum profit. - Mobile Botnets
As stated above, botnet functionalities offer greater flexibility in illegal money-making schemes. This trend has now reached the mobile world and is here to stay. According to our estimates, about 60% of mobile malware includes elements of large or small botnets. - Backdoor.AndroidOS.Obad
This malware is probably found to date, including a staggering total of three exploits, a backdoor, SMS Trojan and bot capabilities and further functionalities. It’s a kind of Swiss Army knife, comprising a whole range of different tools. - Using GCM to control botnets
Cybercriminals have discovered a way to use Google Cloud Messaging (GCM) to control zombie devices in a botnet. This method is used by a relatively small number of malicious programs, but some of them are widespread. The execution of commands received from GCM is performed by the GCM system and it is impossible to block them directly on an infected device. - APT attacks against Uyghur activists
We’ve seen both Windows and Mac OS X malware deployed against . PDF, XLS, DOC and ZIP files were sent in e-mails to perform the attacks in the past. APK files have now been added to the arsenal, spying on the personal information stored on the victim’s device and also transmiting its location. - Vulnerabilities in Android
In a nutshell, we have seen exploits targeting Android for three purposes: to circumvent Android’s app integrity check on installation (also known as master key vulnerability, to gain enhanced rights, and to hinder the analysis of an app. The latter two types were also used in Obad. - Attacks on PCs through an Android device
While we have seen PC malware that can infect smartphones, we have also come across that does it the other way round. When an infected Android device is connected to a PC in the USB drive emulation mode, its malicious payload is launched.
Statistics
In terms of the mobile operating systems that are being targeted by malware, nothing has significantly changed in 2013. Android is still target number one, attracting a whopping 98.05% of known malware. No other OS gets anywhere close, as seen below. The reasons for this are Android’s leading market position, the prevalence of third party app stores and the fact that Android has a rather open architecture, making it easy to use for both app developers and malware authors alike. We do not expect this trend to change in near future.
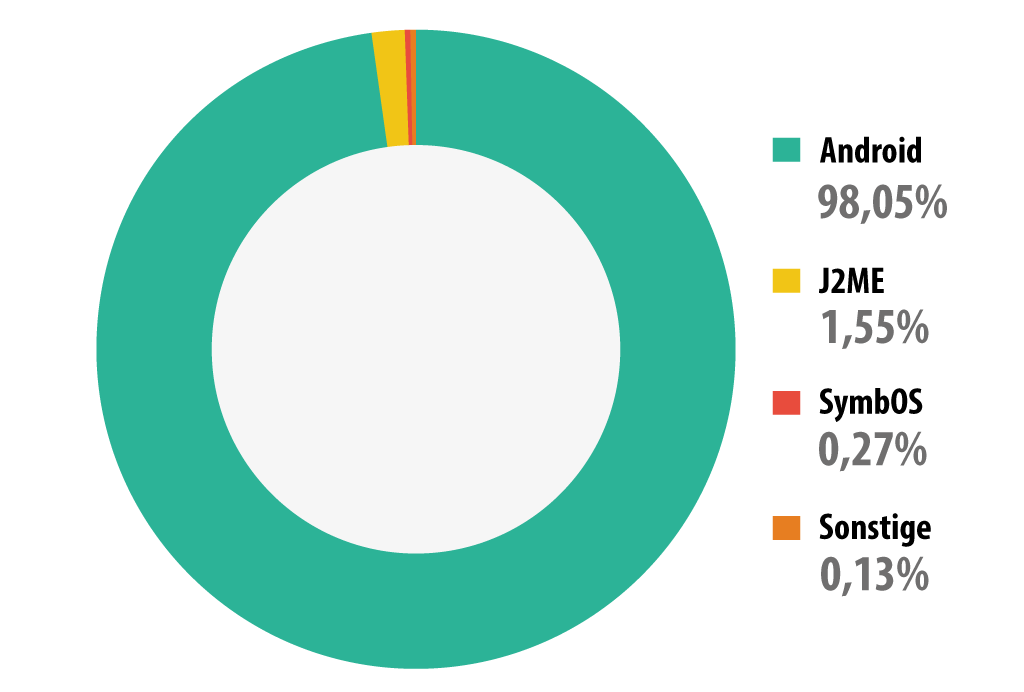
Mobile malware distribution by platform
To date we have collected 8,260,509 unique malware installation packs. Note that different installation packs may launch applications with the same features. The difference is in the malware interface and, for instance, the content of the text messages they send out.
The total number of mobile malware samples in our collection is 148,778 at the time of writing – 104,421 of them were found in 2013. October alone has seen 19,966 modifications, half the total that Kaspersky Lab found in the whole of 2012. Fortunately, this is this far from the situation we’re experiencing in the PC world, where we process a stream of more than 315,000 malware samples per day in our lab. Still, the trend is highly visible and continuing.

Number of mobile malware samples in our collection
Among mobile malware, SMS Trojans are still leading the field:

Malware distribution by behavior type
However, SMS Trojans, with a few exceptions, have evolved into bots, so we can easily unite the leaders of both into a single category – Backdoor Malware. So, 62% of malicious applications are elements of mobile botnets.
Main findings
- All the techniques and mechanisms of infection and malware are moving very quickly from PC to Android thanks to the openness and popularity of the mobile platform.
- The majority of malicious mobile applications are targeted primarily at stealing money and, secondly, at stealing personal data.
- The majority of mobile malware is made up of bots with rich features sets. In the near future, the buying and selling of mobile botnets is likely to begin.
- Online banking is a clear target for mobile malware. Cybercriminals are watching the development of mobile banking. If a smartphone is successfully infected, they check whether that phone is tethered to a bank card.
Vulnerable applications exploited by cybercriminals
The following rating of vulnerable applications is based on data about exploits blocked by our products and used by cybercriminals both in Internet attacks and in compromising local applications, including users’ mobile devices.
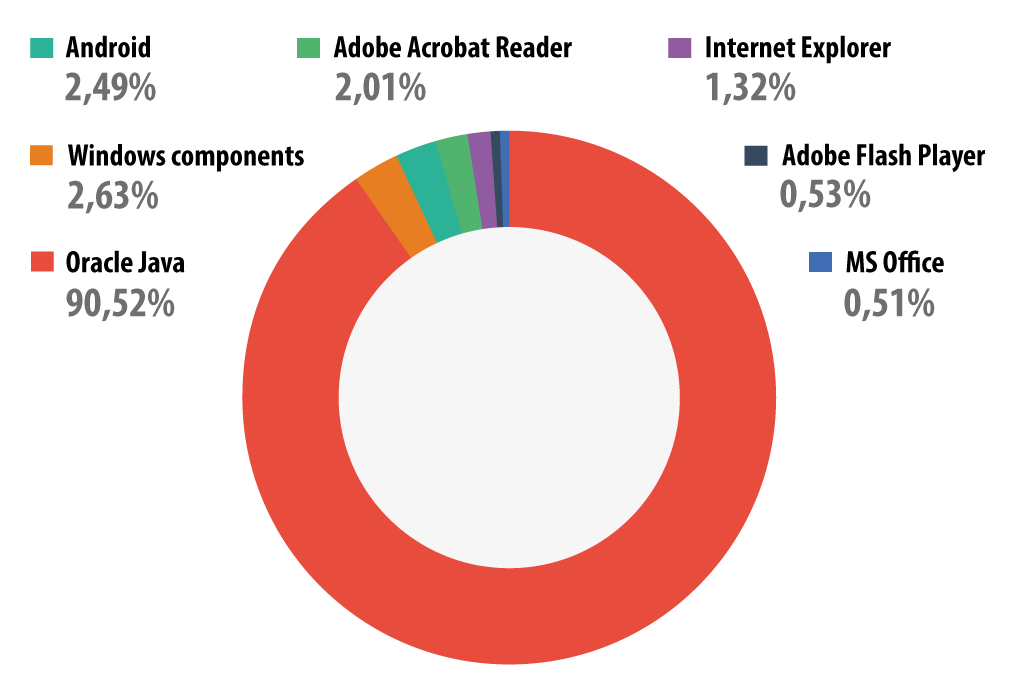
Distribution of exploits in cyber-attacks by type of attacked application
90.52% of all detected attempts to exploit vulnerabilities targeted Oracle Java. These vulnerabilities are exploited by drive-by attacks conducted via the Internet, and new Java exploits are now present in lots of exploit packs. More details can be found in our article about Java exploits.
Second place is taken by the ‘Windows components’ category, including vulnerable Windows OS files that do not apply to Internet Explorer and Microsoft Office – we assigned them to a separate category. Most of the attacks in this category target a vulnerability discovered in win32k.sys – CVE-2011-3402 – which was first used in Duqu.
In third place with 2.5% are exploits for Android. Cybercriminals (and sometimes users themselves) use Android vulnerabilities in order to gain root privileges, which grants unlimited abilities to manipulate a system. These breaches are not used in drive-by attacks, and exploits for them are detected either by an antivirus, if there was an attempt to download an application containing an exploit, or by a file antivirus when an exploit is found on a device. It was recently reported that the Chrome browser for Nexus 4 and Samsung Galaxy S4 contained a vulnerability which could be used in future exploitation of Android vulnerabilities in drive-by attacks.
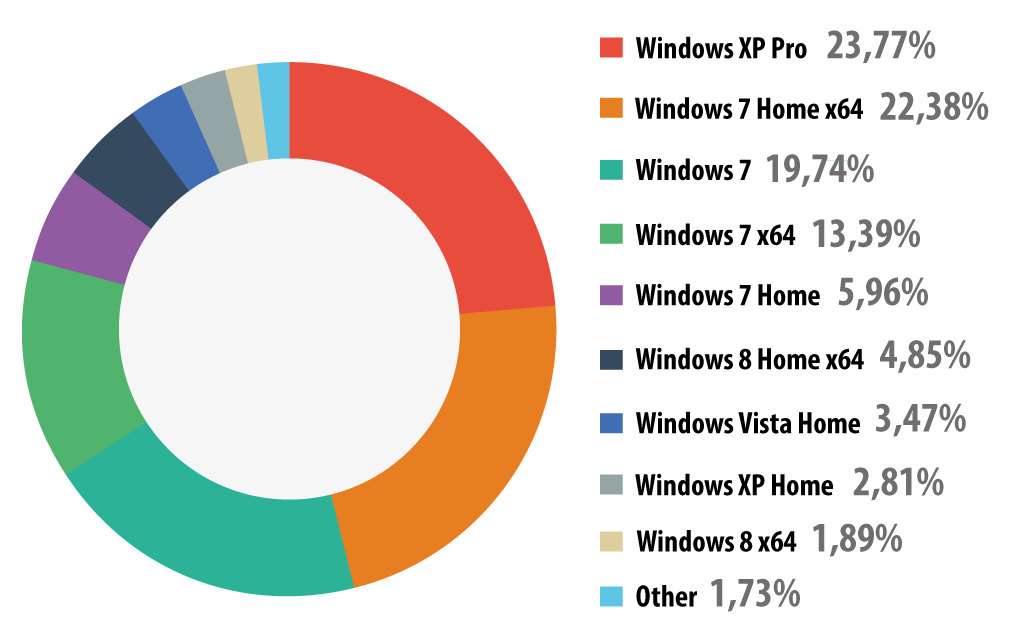
Distribution of OS Windows versions installed on user computers, 2013
Among the users of Kaspersky Lab products who consented to participate in KSN, 61.5% use a version of Windows 7 (5% more than last year); 6.3% use Windows XP (7.75% less than in 2012).
Online threats (attacks via the web)
The statistics in this section were derived from web antivirus components which protect users when malicious code attempts to download from infected websites. Infected websites might be created by malicious users, or they could also be made up of user-contributed content (such as forums) and legitimate resources that have been hacked.
The number of attacks launched from web resources located all over the world increased from 1 595 587 670 in 2012 to 1 700 870 654. That means that Kaspersky Lab products protected users an average of 4 659 920 times every day when they were online.
Compared to last year, there has been a fall in the growth rate of browser-based attacks. The number of neutralized web-based attacks in 2013 is 1.07 times more than in 2012, while in 2012 the corresponding figure was 1.7. The main tool behind browser-based attacks is still the exploit pack, which gives cybercriminals a surefire way of infecting victim computers that do not have a security product installed, or have at least one popular application that is vulnerable (requiring security updates).
Top 20 malicious programs on the Internet
We have identified the top 20 most active malicious programs involved in web attacks on users’ computers. This list accounts for 99.9% of all web attacks.
| Name* | % of all attacks** | |
| 1 | Malicious URL | 93.01% |
| 2 | Trojan.Script.Generic | 3.37% |
| 3 | AdWare.Win32.MegaSearch.am | 0.91% |
| 4 | Trojan.Script.Iframer | 0.88% |
| 5 | Exploit.Script.Blocker | 0.49% |
| 6 | Trojan.Win32.Generic | 0.28% |
| 7 | Trojan-Downloader.Script.Generic | 0.22% |
| 8 | Trojan-Downloader.Win32.Generic | 0.10% |
| 9 | Hoax.SWF.FakeAntivirus.i | 0.09% |
| 10 | Exploit.Java.Generic | 0.08% |
| 11 | Exploit.Script.Blocker.u | 0.08% |
| 12 | Exploit.Script.Generic | 0.07% |
| 13 | Trojan.JS.Iframe.aeq | 0.06% |
| 14 | Packed.Multi.MultiPacked.gen | 0.05% |
| 15 | AdWare.Win32.Agent.aece | 0.04% |
| 16 | WebToolbar.Win32.MyWebSearch.rh | 0.04% |
| 17 | AdWare.Win32.Agent.aeph | 0.03% |
| 18 | Hoax.HTML.FraudLoad.i | 0.02% |
| 19 | AdWare.Win32.IBryte.heur | 0.02% |
| 20 | Trojan-Downloader.HTML.Iframe.ahs | 0.02% |
*These statistics represent detection verdicts of the web-based antivirus module and were submitted by users of Kaspersky Lab products who consented to share their local data.
**The percentage of unique incidents recorded by web-based antivirus on user computers.
Compared to 2012, there was an increase in the proportion of denylisted malicious links blocked (Malicious URL in 1st place). New, enhanced detection technologies that rely on KSN’s capabilities have resulted in the share of threats detected via heuristic methods rising from 87% to 93% over the past year. Most malicious URL detections were for websites containing exploits and for sites redirecting to exploits.
Seven entries in this Top 20 rating were verdicts identifying threats that are blocked during attempted drive-by attacks, which are currently the most common attack method for web-borne malware. They are the heuristic verdicts Trojan.Script.Generic, Trojan.Script.Iframer, Exploit.Script.Blocker, Trojan-Downloader.Script.Generic, Exploit.Java.Generic, Exploit.Script.Generic and the non-heuristic. These verdicts are assigned to scripts that redirect to exploits as well as to the exploits themselves.
In 9th place is a flash file detected as Hoax.SWF.FakeAntivirus.i that contains animation imitating the activity of an antivirus program. A “scan” of the victim’s computer reveals a huge number of “infections” that require a specialist security solution. The victim is prompted to send a text message to a short number and receives a link so the so-called solution can be downloaded. Flash files like this can appear on sites with advertising banners that from time to time include redirects to unwanted content.
In 18th place is Hoax.HTML.FraudLoad.i, detected as an HTML page that imitates the familiar file download window:

Users can end up on these sorts of pages from a variety of Russian-language download sites offering games, software and films. They tend to be hosted on free hosting resources. If users click ‘Save’, they are redirected to a file hosting site where they are prompted to download a file after paying for subscription via a text message. However, after fulfilling all the requirements, instead of receiving the desired content users get a text file with instructions on using search engines or, even worse, malicious programs.
There are more adware verdicts in this year’s rating than in 2012, with the overall share rising from 0.3% to 1.04%.
Countries where online resources are seeded with malware: TOP 10
The following stats are based on the physical location of the online resources, which were used in attacks, blocked by the antivirus (web pages containing redirects to exploits, sites containing exploits and other malware, botnet command centers, etc.). Any unique host might become a source of one or more web attacks.
In order to determine the geographical source of web-based attacks, a method was used by which domain names are matched up against actual domain IP addresses, and then the geographical location of a specific IP address (GEOIP) is established.
In order to conduct 1 700 870 654 attacks over the Internet, cybercriminals used 10 604 273 unique hosts, which is 4 million more than in 2012. 82% of notifications on blocked web attacks were generated by blocking web resources located in ten countries, which is 14.1 percentage points less than in 2012.

Distribution of online resources seeded with malicious programs, by country
In 2013 there was little change to the Top 10 rating of leading malware sources compared to 2012. China, which was the traditional leader prior to 2010, dropped out of the top 10 and Vietnam appeared in 8th place. In 2010 the Chinese authorities succeeded in shutting down lots of malicious hosting resources in their part of cyberspace, at the same time hardening their legislation on domain names in the .cn domain zone, which resulted in the reduction of malicious sources in China. In 2010 China was in 3rd place, 6th in 2011, 8th in 2012 and in 2013 it fell to 21st place in the rating.
Countries where users face the highest risk of online infection
In order to assess in which countries users face cyber-threats most often, we calculated how often Kaspersky users encountered detection verdicts on their machines in each country. The resulting data characterizes the risk of infection to which computers are exposed in different countries across the globe, providing an indicator of the aggressiveness of the environment in which computers work in different countries.
Top 20 countries with the highest risk of computer infection via Internet:
| Country* | % of unique users** | |
| 1 | Azerbaijan | 56.29% |
| 2 | Kazakhstan | 55.62% |
| 3 | Armenia | 54.92% |
| 4 | Russia | 54.50% |
| 5 | Tajikistan | 53.54% |
| 6 | Vietnam | 50.34% |
| 7 | Moldova | 47.20% |
| 8 | Belarus | 47.08% |
| 9 | Ukraine | 45.66% |
| 10 | Kyrgyzstan | 44.04% |
| 11 | Sri Lanka | 43.66% |
| 12 | Austria | 42.05% |
| 13 | Germany | 41.95% |
| 14 | India | 41.90% |
| 15 | Uzbekistan | 41.49% |
| 16 | Georgia | 40.96% |
| 17 | Malaysia | 40.22% |
| 18 | Algiers | 39.98% |
| 19 | Greece | 39.92% |
| 20 | Italy | 39.61% |
These statistics are based on the detection verdicts returned by the web antivirus module, received from users of Kaspersky Lab products who have consented to provide their statistical data.
*We excluded those countries in which the number of Kaspersky Lab product users is relatively small (less than 10,000).
** Unique users whose computers have been targeted by web attacks as a percentage of all unique users of Kaspersky Lab products in the country.
In 2013 saw a new leader emerge, with Azerbaijan finishing in first place with 56.3% of attacked users. Russia, which came top in the previous two years, fell to 4th place with 54.4% (4.1 percentage points less than the previous year).
The USA, Spain, Oman, Sudan, Bangladesh, the Maldives and Turkmenistan dropped out of the TOP 20 list of countries. Among the newcomers are Austria, Germany, Greece, Georgia, Kyrgyzstan, Vietnam and Algeria.
The USA dropped from 19th to 25th. Its share fell by 7 percentage points to 38.1%. To recap, just two years ago the USA was in 3rd place. The declining level of risk associated with web-based attacks in the USA may be linked with the growing popularity of web surfing via mobile devices. Spain, which rounded off the TOP 20 rating last year, appeared at 31st place in 2013 (36.7% – 8 points less than the previous year).
Austria (+8 points) ended the year in 12th place, Germany is in 13th (+9.3 points), and Greece (-1.6 points) is in 19th. Another Western European country – Italy (-6 points) – completes the rating.
All countries can be assigned to one of the following categories based on their risk level while surfing the Internet:
- High risk. This group includes 15 countries from the TOP 20 in the range of 41-60%. They are Russia, Austria, Germany, several former Soviet republics and Asian countries. This group has more than halved since last year when it consisted of 31 countries.
- Moderate Risk
A total of 118 countries in the range of 21-40.99%:Australia (38.9%), the USA (38.1%), Canada (36.5%), Italy (39.6%), France (38.1%), Spain (36.7%), the UK (36.7%), the Netherlands (27.3%), Finland (23.6%), Denmark (21.8%); Poland (37.6%), Romania (33.2%), Bulgaria (24.1%), Brazil (34.6%), Mexico (29.5%), Argentina (25%), China (32.2%), Japan (25.3%). - Low risk (0-20.99%)
A total of 25 countries: the Czech Republic (20.3%), Slovakia (19.7%), Singapore (18.5%) and a number of African countries.
The African countries with a low risk level turned out to have high and moderate risk of infection by local threats (see below). The Internet in these countries is still not highly developed. Therefore, to share data users still make use of a variety of removable media. That is why web attacks are threatening so few users, while malware, distributed over removable data carriers, is frequently detected on computers.

The average global Internet threat level grew by 6.9 percentage points – in 2013, 41.6% of user computers encountered attacks at least once. The Internet is still the main source of malware for users in the majority of countries worldwide.
Local threats
Local infection statistics for user computers are a critically important indicator. This data points to threats that have penetrated a computer system through something other than the Internet, email, or network ports.
This section of the report contains an analysis of statistics based on data obtained from the on-access scanner and scanning statistics for different disks, including removable media (the on-demand scanner).
Kaspersky Lab antivirus solutions detected nearly 3 billion malware incidents on computers participating in the Kaspersky Security Network.
In total, 1.8 million malicious or potentially unwanted programs were detected in these incidents.
The Top 20 malicious objects detected on user computers
| Name | % of individual users* | |
| 1 | DangerousObject.Multi.Generic | 27.8% |
| 2 | Trojan.Win32.Generic | 27.1% |
| 3 | Trojan.Win32.AutoRun.gen | 13.9% |
| 4 | Virus.Win32.Sality.gen | 9.4% |
| 5 | Exploit.Win32.CVE-2010-2568.gen | 6.8% |
| 6 | AdWare.Win32.DelBar.a | 5.5% |
| 7 | Trojan.Win32.Starter.lgb | 4.7% |
| 8 | Virus.Win32.Nimnul.a | 4.0% |
| 9 | Worm.Win32.Debris.a | 3.9% |
| 10 | Virus.Win32.Generic | 3.7% |
| 11 | Trojan.Script.Generic | 3.6% |
| 12 | Net-Worm.Win32.Kido.ih | 3.5% |
| 13 | AdWare.Win32.Bromngr.i | 3.1% |
| 14 | Net-Worm.Win32.Kido.ir | 3.0% |
| 15 | Trojan.Win32.Starter.yy | 2.7% |
| 16 | DangerousPattern.Multi.Generic | 2.7% |
| 17 | HiddenObject.Multi.Generic | 2.6% |
| 18 | Trojan.Win32.Hosts2.gen | 2.5% |
| 19 | AdWare.Win32.Agent.aeph | 2.5% |
| 20 | Trojan.WinLNK.Runner.ea | 2.4% |
These statistics are compiled from malware detection verdicts generated by the on-access and on-demand scanner modules on the computers of those users running Kaspersky Lab products that have consented to submit their statistical data.
* The proportion of individual users on whose computers the antivirus module detected these objects as a percentage of all individual users of Kaspersky Lab products on whose computers a malicious program was detected.
In 2013, malicious programs classified as DangerousObject.Multi.Generic and detected using cloud technologies ranked first in the list of the Top 20 malicious objects detected on user computers. Cloud technologies work when there are still no signatures in antivirus databases, and no heuristics for detecting malicious programs, but Kaspersky Lab’s cloud already has data about the threat. This is essentially how the newest malicious programs are detected. With the Urgent Detection System (UDS) implemented in Kaspersky Security Network over 11 million computers received real-time protection.
Last year’s leader Trojan.Win32.Generic came second based on verdicts issued by the heuristic analyzer.
Exploit.Win32.CVE-2010-2568.gen (5th place) and Trojan.WinLNK.Runner.ea (20th place) are the verdicts assigned to malicious Ink files (shortcuts) are detected. The Ink files of these families launch other malicious executable files. They are actively used by worms for distribution via USB storage media.
Eight out of the Top 20 programs either integrate the self-proliferating mechanism or are used as one of the components in the scheme of worm distribution: Virus.Win32.Sality.gen (4th place), Trojan.Win32.Starter.lgb (7th place), Virus.Win32.Nimnul.a (8th place), Worm.Win32.Debris.a (9th place), Virus.Win32.Generic (10th place), Net-Worm.Win32.Kido.ih (12th place), Net-Worm.Win32.Kido.ir (14th place), Trojan.Win32.Starter.yy (15th place).
The percentage of Net-Worm.Win32.Kido worms (12th and 14th place), which first appeared in 2008, is declining with every year as users update their systems.
The Virus.Win32.Virut family of verdicts failed to make it into the Top 20 in 2013, while the share of other viruses – Sality (4th place) and Nimnul (8th place) – grew by 8.5 and 1.4 percentage points respectively.
This year’s newcomer Worm.Win32.Debris.a ended up in 9th place. This worm is distributed via removable media with the help of Ink files. The payload of this worm is the Andromeda malicious program which is used to download third-party files. This program first appeared on the virus writer black market in 2011. However, new methods of installation and distribution means we have assigned it to a separate family.
Trojan.Win32.Hosts2.gen is in 18th place. This verdict is assigned to malicious programs that try to change the special hosts file redirecting user requests to certain domains to hosts under their control.
Countries where users face the highest risk of local infection
In order to assess the risk level for local infection faced by users in different countries, we calculated just how often users with Kaspersky Lab products encountered antivirus detections over the course of the year. Of interest was data concerning the detection of malware on user machines or on removable media connected to computers – USB flash drives, camera and phone memory cards, external hard drives. Essentially, these statistics reflect the level of personal computer infections in different countries of the world.
Computer infection levels by country – Top 20:
| Country* | %** | |
| 1 | Vietnam | 68.14% |
| 2 | Bangladesh | 64.93% |
| 3 | Nepal | 62.39% |
| 4 | Mongolia | 60.18% |
| 5 | India | 59.26% |
| 6 | Sudan | 58.35% |
| 7 | Afghanistan | 57.46% |
| 8 | Algeria | 56.65% |
| 9 | Laos | 56.29% |
| 10 | Cambodia | 55.57% |
| 11 | Iraq | 54.91% |
| 12 | Djibouti | 54.36% |
| 13 | Maldives | 54.34% |
| 14 | Pakistan | 54.12% |
| 15 | Sri Lanka | 53.36% |
| 16 | Mauritania | 53.02% |
| 17 | Indonesia | 52.03% |
| 18 | Rwanda | 51.68% |
| 19 | Angola | 50.91% |
| 20 | Egypt | 50.67% |
These statistics are based on the detection verdicts returned by the antivirus module, received from users of Kaspersky Lab products who have consented to provide their statistical data.
*When calculating, we excluded countries where there are fewer than 10,000 Kaspersky Lab users.
**The percentage of unique users in the country with computers that blocked local threats as a percentage of all unique users of Kaspersky Lab products.
For more than a year, the Top 20 positions in this category were held by countries in Africa, the Middle East, and South East Asia. Since last year’s ranking, the situation in the top-ranked countries has improved: in 2012, the figure for the first-placed country was over 99%; in 2013, the highest figure did not reach 70%.
In 2013, an average of 60.1% of computers connected to KSN were subjected to at least one attack while surfing the web compared to 73.8% in 2012.
Countries can be divided into categories in terms of local threats. Considering the overall reduction in the level of local infections most probably caused by the decline in the use of flash drives for exchanging information, we have lowered the threshold for the group levels (compared with the statistics for 2012).
- Maximum risk (over 60%): four countries including Vietnam (68.1%), Bangladesh (64.9%), Nepal (62.4%) and Mongolia (60.2%).
- High risk 67 countries across the globe, including India (59.2%), China (46.7%), Kazakhstan (46%), Azerbaijan (44.1%), Russia (41.5%), most African countries.
- Moderate local infection rate (21-40.99%). 78 countries across the globe, including Spain (36%), France (33.9%), Portugal (33.1%), Italy (32.9%), Germany (30.2%), the USA (29%), the UK (28.5%), Switzerland (24.6%), Sweden (21.4%), Ukraine (37.3%), Brazil (40.2%), Argentina (35.2%), Chile (28.9%), South Korea (35.2%), Singapore (22.8%).
- Low local infection rate (0- 20.99%). Nine countries from across the globe.

The Top 10 countries with the lowest risk of local infection were:
| Rank | Country | % |
| 1 | Denmark | 14.74% |
| 2 | Czech Republic | 15.58% |
| 3 | Finland | 15.93% |
| 4 | Cuba | 17.18% |
| 5 | Japan | 18.93% |
| 6 | Slovakia | 19.24% |
| 7 | Slovenia | 19.32% |
| 8 | Norway | 19.36% |
| 9 | Seychelles | 19.90% |
| 10 | Malta | 21.28% |
In 2013, one new country – the Seychelles – appeared in this Top 10, pushing out the Netherlands.
On average, 18.4% of user machines were attacked in the low risk group of countries. This is 6.6 percentage points less than last year.
Kaspersky Security Bulletin 2013. Overall Statistics for 2013
Table of Contents
From the same authors


In the same category


Nguyen Viet Huong
Thanks kaspersky very much for this article
DB
This is really helpful information to raise the security awareness of the ‘normal’ home computer user. Well done Kaspersky!