

Authors
- Kaspersky Security Bulletin 2009. Malware Evolution 2009
- Kaspersky Security Bulletin 2009. Statistics, 2009
- Kaspersky Security Bulletin: Spam Evolution 2009
The statistics used in this report are generated by the Kaspersky Security Network (KSN), a major innovation implemented in Kaspersky Lab personal products. The system is currently being adapted for implementation in Kaspersky Lab’s corporate product offerings.
KSN enables our analysts to detect, in real time, new malicious programs for which signature or heuristic detection does not yet exist. KSN is also able to identify sources which are spreading malware on the Internet, and to prevent users from accessing these sources.
KSN increases the speed of reaction to new threats (at the moment we are able to prevent new malicious programs being launched on computers using KSN mere tenths of a second after the program has been identified as malicious) without it being necessary to update antivirus databases in the normal way.
Malicious programs on the Internet (attacks via the Web)
The problem of Gumblar has been covered in some detail in another section of this report. In fact, the Gumblar epidemic is merely the tip of the iceberg in terms of web infections; infecting via the Web has, over the past few years, become the main method used to infect victim machines.
Cybercriminals have quickly adapted to take advantage of these new opportunities, and have succeeded in creating fully functional, self-populating botnets using compromised web sites. They have also been quick to exploit the possibilities offered by social networks, and the high level of trust between members of social networks. The likelihood that a member of a social network will launch a file or click on a link sent to him/her by a “friend” is approximately 10 times greater than if the file or the link arrives via email. Cybercriminals actively exploit this trust in order to spread malware and spam.
In the past, we’ve written several times about drive-by downloads, a technique used to stealthily infect victim machines while the user is browsing the Internet. In 2009, the number of such attacks approximately tripled – and it should be stressed that the total number of attacks is in the tens of millions.
KSN has been used to quantify the number of attacks and analyse attempts to infect machines running KSN.
In 2009, 73,619,767 attacks on KSN users were identified, in contrast to 23,680,646 in 2008. In addition to attempts made to download malicious or potentially unwanted programs to victim machines, the total number of incidents also includes 14,899,238 attempts to access phishing and malicious sites which were blocked by our antivirus product.
Top twenty malicious programs on the Internet in 2009
The twenty malicious programs most commonly used in Internet attacks are listed below. Each program has been identified more than 170,000 times and, overall, the programs listed below were involved in more than 37% (27,443,757) of all identified incidents.
| № | Name | Number of attacks | % of total |
| 1 | HEUR:Trojan.Script.Iframer | 9858304 | 13.39 |
| 2 | Trojan-Downloader.JS.Gumblar.x | 2940448 | 3.99 |
| 3 | not-a-virus:AdWare.Win32.Boran.z | 2875110 | 3.91 |
| 4 | HEUR:Exploit.Script.Generic | 2571443 | 3.49 |
| 5 | HEUR:Trojan-Downloader.Script.Generic | 1512262 | 2.05 |
| 6 | HEUR:Trojan.Win32.Generic | 1396496 | 1.9 |
| 7 | Worm.VBS.Autorun.hf | 1131293 | 1.54 |
| 8 | Trojan-Downloader.HTML.IFrame.sz | 935231 | 1.27 |
| 9 | HEUR:Exploit.Script.Generic | 752690 | 1.02 |
| 10 | Trojan.JS.Redirector.l | 705627 | 0.96 |
| 11 | Packed.JS.Agent.bd | 546184 | 0.74 |
| 12 | Trojan-Clicker.HTML.Agent.aq | 379872 | 0.52 |
| 13 | HEUR:Trojan-Downloader.Win32.Generic | 322166 | 0.44 |
| 14 | Trojan.JS.Agent.aat | 271448 | 0.37 |
| 15 | Trojan-Downloader.Win32.Small.aacq | 265172 | 0.36 |
| 16 | Trojan-Clicker.HTML.IFrame.ani | 224657 | 0.31 |
| 17 | Trojan-Clicker.JS.Iframe.be | 216738 | 0.3 |
| 18 | Trojan-Downloader.JS.Zapchast.m | 193130 | 0.27 |
| 19 | Trojan.JS.Iframe.ez | 175401 | 0.24 |
| 20 | not-a-virus:AdWare.Win32.GamezTar.a | 170085 | 0.23 |
| Total: | 27443757 | 37.3 |
The leader by a significant amount is a heuristic detection used to identify malicious links injected by hackers and malware into the code of compromised sites. These links cause the browser to stealthily contact other sites, which generally contain exploit bundles designed to target browser or application vulnerabilities.
Second place is taken by Gumblar; this is no surprise given the scale of the Gumblar epidemic. Kaspersky Lab products detected that our clients’ machines attempted to contact Gumblar botnet servers almost 3,000,000 times, which gives an idea of the size of the problem.
Adware is in third place, in the form of Boran.z. Adware, together with spam and pornographic content, became one of the major drivers of cybercrime a long time ago.
Almost all the other entries are linked in one way or another to various modifications of vulnerability exploits.
Top twenty countries hosting malware in 2009
The 73,619,767 attacks conducted via the Internet in 2009 were launched from resources in 174 countries around the world. More than 97% of these attacks originated in the twenty countries listed below.
| № | Country | Percentage of all attacks |
| 1 | China (mainland) | 52.7% |
| 2 | USA | 19.02% |
| 3 | Netherlands | 5.86% |
| 4 | Germany | 5.07% |
| 5 | Russia | 2.58% |
| 6 | Great Britain | 2.54% |
| 7 | Canada | 2.22% |
| 8 | Ukraine | 2.17% |
| 9 | Latvia | 1.53% |
| 10 | France | 0.6% |
| 11 | Spain | 0.49% |
| 12 | North Korea | 0.48% |
| 13 | Brazil | 0.44% |
| 14 | Cyprus | 0.34% |
| 15 | Sweden | 0.32% |
| 16 | Taiwan | 0.27% |
| 17 | Norway | 0.23% |
| 18 | Israel | 0.21% |
| 19 | Luxemburg | 0.16% |
| 20 | Estonia | 0.16% |
| Total: | 97.38% |
The top five countries are exactly the same as in 2008.
Although China remains the leader, the number of attacks conducted from Chinese resources fell from 79% of all attacks to slightly under 53%. The US remains in second place, but the number of infected servers on US territory rose significantly, with attacks increasing from 6.8% of all attacks to 19%. Russia, Germany and the Netherlands trail behind the two leaders, with percentages for these countries increasing only slightly.
China’s leading position (both in terms of the creation of new malware, and in terms of the number of infected websites) has attracted the attention of governmental bodies and law enforcement agencies. In order to improve the situation, regulatory agencies have already taken a number of steps designed to prevent the appearance of malicious resources. Registering a .cn domain name must now be done in writing, and registration will only be carried out once the person wishing to register the site provides – in person – ID and a commercial license. Several Chinese domain registrars have already been closed for failing to abide by these regulations.
These restrictions were introduced at the end of 2009, and there was an almost immediate reduction in the number of spam links leading to Chinese domains. It is to be hoped that this trend will continue in 2010 and that there will be a similarly noticeable effect on other methods which are used to infect victim machines and scam users.
Top twenty countries subject to attack in 2009
More than 86% of the 73,619,767 attacks targeted the machines of users in the twenty countries listed below:
| № | Country | Percentage of all attacks |
| 1 | China | 46.75% |
| 2 | USA | 6.64% |
| 3 | Russia | 5.83% |
| 4 | India | 4.54% |
| 5 | Germany | 2.53% |
| 6 | Great Britain | 2.25% |
| 7 | Saudi Arabia | 1.81% |
| 8 | Brazil | 1.78% |
| 9 | Italy | 1.74% |
| 10 | Vietnam | 1.64% |
| 11 | Mexico | 1.58% |
| 12 | France | 1.49% |
| 13 | Egypt | 1.37% |
| 14 | Turkey | 1.23% |
| 15 | Spain | 1.2% |
| 16 | Ukraine | 0.91% |
| 17 | Canada | 0.81% |
| 18 | Malaysia | 0.8% |
| 19 | Thailand | 0.76% |
| 20 | Kazakhstan | 0.71% |
| Total: | 86.37% |
This ranking has changed significantly since last year. China remains the leader in terms of numbers of potential victims, but the number of attacks dropped by 7%. Other countries which were near the top of the table last year, such as Egypt, Turkey, and Vietnam, now seem to be of less interest to cybercriminals. However, the number of attacks on users based in the US, Germany, Great Britain and Russia rose significantly.
It seems likely that these changes are yet another consequence of the global economic crisis. There is now less money on the Internet, and the initial surge of interest in online banking services, which was seen in a number of countries in online banking services, has now slowed. Cybercriminals are focussing their efforts on the “richest” markets, i.e. those which offer the most potential profit.
Chinese cybercriminals have also played a role, as they are conducting fewer attacks on their fellow citizens. We have written elsewhere about the decline in the number of gaming Trojans, and it may be that this has influenced attacks conducted via the Web.
Network attacks
A firewall is an essential part of any modern security solution. Firewalls block a wide range of attacks conducted on the potential victim machine from the outside – attacks which are not conducted via the browser – and also combat attempts to steal confidential data.
Kaspersky Internet Security includes a firewall with an Intrusion Detection System (IDS) that analyses incoming packets. Incoming packets can often be exploits which can either infect an unpatched system or give a cybercriminal full access to the system by exploiting vulnerabilities in operating system network services.
In 2009, the IDS in Kaspersky Internet Security 2010 deflected 219,899,678 network attacks. The corresponding figure for 2008 was slightly more than 30 million.
| Name | Number of attacks | % | |
| 1 | DoS.Generic.SYNFlood | 156550484 | 71.192 |
| 2 | Intrusion.Win.NETAPI.buffer-overflow.exploit | 32605798 | 14.828 |
| 3 | Intrusion.Win.MSSQL.worm.Helkern | 23263431 | 10.579 |
| 4 | Intrusion.Win.DCOM.exploit | 3245943 | 1.476 |
| 5 | Scan.Generic.UDP | 1799685 | 0.818 |
| 6 | Intrusion.Win.LSASS.exploit | 812775 | 0.37 |
| 7 | Intrusion.Generic.TCP.Flags.Bad.Combine.attack | 604621 | 0.275 |
| 8 | Intrusion.Win.LSASS.ASN1-kill-bill.exploit | 555107 | 0.252 |
| 9 | DoS.Generic.ICMPFlood | 131925 | 0.06 |
| 10 | Scan.Generic.TCP | 101737 | 0.046 |
| 11 | Intrusion.Win.HTTPD.GET.buffer-overflow.exploit | 86511 | 0.039 |
| 12 | Intrusion.Win.MediaPlayer.ASX.buffer-overflow.exploit | 24375 | 0.011 |
| 13 | Intrusion.Win.SMB.CVE-2009-3103.exploit | 19378 | 0.009 |
| 14 | Intrusion.Win.WINS.heap-overflow.exploit | 15200 | 0.007 |
| 15 | Intrusion.Generic.OmniWeb.Alert.format-string.exploit | 14291 | 0.006 |
| 16 | Intrusion.Win.Messenger.exploit | 10296 | 0.005 |
| 17 | DoS.Win.IGMP.Host-Membership-Query.exploit | 8976 | 0.004 |
| 18 | Intrusion.Win.PnP.exploit | 8783 | 0.004 |
| 19 | Intrusion.Win.EasyAddressWebServer.format-string.exploit | 6561 | 0.003 |
| 20 | DoS.Generic.Land | 3505 | 0.002 |
| Total: | 99.986 |
Just as last year, Dos.Generic.SYNFlood is in first place; this widespread and simple attack will, if successful, cause the computer under attack to cease working. Attacks of this type can be successfully combated by the majority of today’s security solutions.
NETAPI.buffer-overflow.exploit, in second place, is an interesting threat which poses a serious risk; it targets the MS08-067 vulnerability. This is the vulnerability exploited by the notorious Kido (Conficker) worm. It was identified at the end of 2008, and took fourth place in last year’s rankings. Kido is undoubtedly responsible for the majority of the 32 million attacks designed to exploit MS08-067 which were detected and blocked in 2009.
In spite of the fact that Helkern (Slammer) has been in existence for seven years now, it continues to make its presence felt, and caused 23 million infection attempts. The RPC-DCOM (MS03-026) exploit, in fourth place in the rankings, is similarly long-lived; this was the vulnerability used by the Lovesan worm to cause a global epidemic in August 2003.
Local infections
The figures which indicate the number of local infections on victim machines are extremely important. These statistics provide data on the number of threats which penetrated victim machines via vectors other than the Web, email, or network ports.
Kaspersky Lab products successfully detected 107,370,258 virus incidents involving 703,700 malicious and potentially unwanted programs on computers which are part of KSN. The 100 most common of these programs caused 28,579,901 incidents, or 27% of all incidents.
The twenty most common threats are shown below:
| № | Object | Number of individual computers on which object was detected |
| 1 | HEUR:Trojan.Win32.Generic | 3050753 |
| 2 | Net-Worm.Win32.Kido.ih | 2924062 |
| 3 | Virus.Win32.Sality.aa | 1407976 |
| 4 | Net-Worm.Win32.Kido.ir | 1176726 |
| 5 | UDS:DangerousObject.Multi.Generic | 620716 |
| 6 | Packed.Win32.Black.d | 527718 |
| 7 | Net-Worm.Win32.Kido.iq | 518120 |
| 8 | HEUR:Worm.Win32.Generic | 516467 |
| 9 | Virus.Win32.Virut.ce | 488852 |
| 10 | not-a-virus:AdWare.Win32.Boran.z | 466106 |
| 11 | Virus.Win32.Induc.a | 455798 |
| 12 | HEUR:Trojan-Downloader.Win32.Generic | 436229 |
| 13 | HEUR:Trojan.Win32.StartPage | 412245 |
| 14 | MultiPacked.Multi.Generic | 377741 |
| 15 | Trojan-Downloader.Win32.VB.eql | 362685 |
| 16 | Worm.Win32.FlyStudio.cu | 361056 |
| 17 | Trojan-Dropper.Win32.Flystud.yo | 356950 |
| 18 | Packed.Win32.Black.a | 333705 |
| 19 | Packed.Win32.Klone.bj | 320665 |
| 20 | Trojan.Win32.Chifrax.a | 296947 |
Heuristic methods were used to identify more than 3 million infection attempts which were subsequently blocked. The majority of these heuristic detections have a place in the rankings: HEUR:Trojan.Win32.Generic, HEUR:Worm.Win32.Generic, HEUR:Trojan-Downloader.Win32.Generic and HEUR:Trojan.Win32.StartPage
As has already been mentioned, the biggest epidemic of the year was caused by Kido (Conficker), a worm which infected millions of computers around the world. Three modifications of this worm feature in the rankings: Kido.ir, Kido.ih, and Kido.iq. Taken together, these three pieces of malware would trump the leader (HEUR:Trojan.Win32.Generic) by more than one and a half million infected machines.
Sality.aa follows Kido – this virus also caused a global epidemic last year, and headed the rankings in our annual report. It should be stressed, however, that Sality didn’t retain this position for long, being squeezed down the table by network worms.
In addition to Sality, the table features another two viruses – the first is a classic file virus, and the second is a creation which does not fit neatly into our current malware classification.
The first is Virus.Win32.Virut.ce, which in addition to its main payload (infecting executable files) also infects web servers and spreads via P2P networks. The epidemic caused by Virut was among the notable malware incidents of 2009.
The second is Virus.Win32.Induc.a, which is very non-standard: it exploits the two stage mechanism used to create executable files implemented in Delphi. What happens is that application source code is initially compiled into an intermediary .dcu module, and then into a Windows executable. At the moment, this virus has no malicious payload apart from its infection routine, but it does demonstrate this new potential infection vector. It should be noted that it took so long to identify Induc (infected files started appearing at the end of 2008, but the virus itself was only detected in August 2009) because it has no actual malicious payload apart from being able to self-propagate.
Thanks to the Urgent Detection System (UDS) which is part of the Kaspersky Security Network, more than 600,000 computers were protected in real time – new malicious files are quickly detected as UDS:DangersouObject.Multi.Generic.
The large number of malicious programs created using FlyStudio (a scripting language) should also be noted. There are three such programs in the rankings: Worm.Win32.FlyStudio.cu, Trojan-Dropper.Win32.Flystud.yo, and Packed.Win32.Klone.bj. Taking into account that FlyStudio is mostly used by Chinese cybercriminals, the fact that these programs are among the twenty most common malicious programs confirms our earlier statement that China is one of the leading creators of malware.
One more clearly marked trend in the virus-writing world this year was malware being packed and obfuscated using specially created packing programs. This is done to hinder detection and analysis of already known malware. Several such packers are included in the rankings: Packed.Win32.Black.a, Packed.Win32.Black.d, and Packed.Win32.Klone.bj.
Vulnerabilities
Software and operating system vulnerabilities are one of the most dangerous security issues, providing cybercriminals with opportunities to evade protection mechanisms and attack victim machines. Kido, the biggest epidemic of 2009, came to pass due to a critical vulnerability in the Windows operating system.
However, just as was the case a year ago, the browser remains the most common attack vector. Although the browser itself may not be vulnerable, a machine can still be infected if browser-related plug-ins and applications contain vulnerabilities.
In 2009, the system for analysing vulnerabilities identified 404 different vulnerabilities, and a total of 461,828, 538 vulnerable files and applications were detected on users’ computers.
We analysed the 20 most common vulnerabilities, which made up 90% (415,608,137) of all vulnerable files and applications identified on computers running our antivirus solution.
| № | ID | Vulnerability | Number of vulnerable files and applications |
% of all vulnerable files and applications |
Rating | Impact | Release Date |
| 1 | 33632 | Apple QuickTime Multiple Vulnerabilities | 165658505 | 35,87 | Highly Critical | System Access | 22.01.2009 |
| 2 | 35091 | Apple QuickTime Multiple Vulnerabilities | 68645338 | 14.86 | Highly Critical | System Access | 22.05.2009 |
| 3 | 31821 | Apple QuickTime Multiple Vulnerabilities | 58141113 | 12,59 | Highly Critical | System Access | 10.09.2008 |
| 4 | 29293 | Apple QuickTime Multiple Vulnerabilities | 38368954 | 8,31 | Highly Critical | System Access | 10.06.2008 |
| 5 | 23655 | Microsoft XML Core Services Multiple Vulnerabilities | 8906277 | 1,93 | Highly Critical | Cross Site Scripting, DoS, System access | 09.01.2007 |
| 6 | 34012 | Adobe Flash Player Multiple Vulnerabilities | 7728963 | 1,67 | Highly Critical | Security Bypass, Exposure of sensitive information, Privilege escalation, System access | 25.02.2009 |
| 7 | 34451 | Sun Java JDK / JRE Multiple Vulnerabilities | 6783414 | 1,47 | Highly Critical | Security Bypass, DoS, System access | 26.03.2009 |
| 8 | 29320 | Microsoft Outlook “mailto:” URI Handling Vulnerability | 6336962 | 1,37 | Highly Critical | System Access | 11.03.2008 |
| 9 | 35364 | Microsoft Excel Multiple Vulnerabilities | 6290278 | 1,36 | Highly Critical | System Access | 09.06.2009 |
| 10 | 35377 | Microsoft Office Word Two Vulnerabilities | 6088207 | 1,32 | Highly Critical | System Access | 09.06.2009 |
| 11 | 34572 | Microsoft PowerPoint OutlineTextRefAtom Parsing Vulnerability | 5704617 | 1,24 | Extremely Critical | System Access | 03.04.2009 |
| 12 | 31744 | Microsoft Office OneNote URI Handling Vulnerability | 5652570 | 1,22 | Highly Critical | System Access | 09.09.2008 |
| 13 | 32270 | Adobe Flash Player Multiple Security Issues and Vulnerabilities | 5078221 | 1,1 | Moderately critical | Security Bypass, Cross Site Scripting, Manipulation of data, Exposure of sensitive information | 16.10.2008 |
| 14 | 35948 | Adobe Flash Player Multiple Vulnerabilities | 5073297 | 1,1 | Highly Critical | Security Bypass, Exposure of sensitive information, System access | 23.07.2009 |
| 15 | 30285 | Microsoft Office Word Multiple Vulnerabilities | 4984582 | 1,08 | Highly Critical | System Access | 09.12.2008 |
| 16 | 31453 | Microsoft Office PowerPoint Multiple Vulnerabilities | 4203122 | 0,91 | Highly Critical | System Access | 12.08.2008 |
| 17 | 30150 | Microsoft Publisher Object Handler Validation Vulnerability | 3965019 | 0,86 | Highly Critical | System Access | 13.05.2008 |
| 18 | 32991 | Sun Java JDK / JRE Multiple Vulnerabilities | 2980650 | 0,65 | Highly Critical | Security Bypass, Exposure of system information, Exposure of sensitive information, DoS, System access | 04.12.2008 |
| 19 | 31593 | Microsoft Excel Multiple Vulnerabilities | 2604816 | 0,56 | Highly Critical | System Access | 09.12.2008 |
| 20 | 26027 | Adobe Flash Player Multiple Vulnerabilities | 2413232 | 0,52 | Highly Critical | Exposure of sensitive information, System access | 11.07.2007 |
| Total | 415608137 | 89,99 |
Of the five most common vulnerabilities, the first two were identified in 2009, those in third and fourth place in 2008, and the Microsoft XML Core Services Multiple Vulnerabilities, which occupy fifth place, were identified back in 2007.
In terms of vulnerable files and applications detected on users’ machines, the most common in 2009 were vulnerabilities in Apple’s QuickTime 7.x, which was responsible for more than 70% of all vulnerabilities. This is reminiscent of 2008, when QuickTime made up more than 80% of all vulnerabilities, and led the rankings with this figure.
The graph presents data on which company’s products contained the most vulnerabilities out of those listed in the table above.
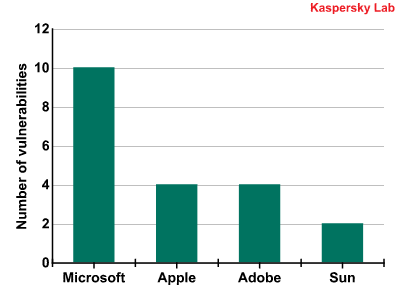
In 2008, this graph was made up of 7 companies, but this number has now been reduced to four. Just as last year, Microsoft continues to lead with 10 vulnerabilities. This is not surprising, as we are looking specifically at the Windows platform. Nine out of the 10 vulnerabilities were found in applications which form part of Microsoft Office, such as Word, Excel, Outlook, PowerPoint, etc.
Apple’s four vulnerabilities were all found in QuickTime.
This data can be used to conclude that the situation remains the same as last year: the most vulnerable applications on modern Windows systems are still Microsoft Office and QuickTime.
However, Adobe is not far behind in the vulnerability stakes. All four vulnerabilities which were identified related to a single product: Adobe Flash Player. Two of these vulnerabilities were identified in 2009. Sadly, the situation has not improved since 2008, but actually worsened.
The list of the most dangerous applications for 2009 is as follows:
- QuickTime
- Microsoft Office
- Adobe Flash Player
The graph below shows data on the most common vulnerabilities grouped by type:
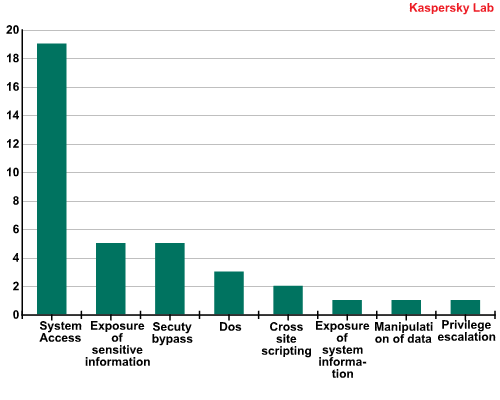
The twenty most common vulnerabilities all belong to the “remote” category, i.e. they can be exploited by cybercriminals even if they do not have direct local access to the victim machine.
Exploiting any of these vulnerabilities can have a range of effects on the victim machine. The most dangerous of these is “system access”, as this effectively gives a cybercriminal full access to the system. 19 out of the 20 vulnerabilities potentially provide “system access” and five can result in the loss of sensitive data.
Find everything about JavaScript and jQuery in the cheat sheets, read the JavaScript blog or use the free online tools.
From the same authors


In the same category


Kaspersky Security Bulletin 2009. Statistics, 2009