News Overview
In the third quarter of 2017, the trends of the preceding quarters continued to develop further. The number of DDoS attacks in China, the United States, South Korea and Russia increased, which were reflected in the statistics we gathered for botnets. A sharp surge in the number (more than 450 daily) and power (up to 15.8 million packets per second) of attacks was registered in the ‘Australian sector’. The cost of protection increased accordingly: for example, in early September, six IB vendors entered into a $50 million contract with the Singapore government (the previous three-year contract cost the state half that amount).
The biggest success in combating DDoS attacks was the taking down of the huge (hundreds of thousands of devices in more than a hundred countries) WireX botnet. The botnet had been secretly working on Android devices and proliferating via legitimate Google Play applications. The joint actions of Google, Samsung and several large IT security vendors were required to take down the botnet. Given the deplorable state of security on the Internet of things and in micro-applications, such findings are now likely to occur on a fairly regular basis.
Cybercriminals are using their brains as well as their brawn. In mid-August, Imperva described Pulse Wave technology capable of increasing the power of a DDoS attack thanks to a vulnerability in hybrid and cloud technologies. The analysts at Imperva believe that most DDoS attacks will soon follow a similar pattern: short but powerful sudden “punctuated” attacks that last for several hours or several days.
The targets within the scope of the cybercriminals’ interest remain the same. In the political arena, the increase in the number of attacks has even triggered a process of qualitative change: some are voicing the belief that DDoS attacks are a legitimate form of democratic protest. However, the effectiveness of this method is still questionable: the two most notable political acts of the third quarter (an attack on the DreamHost hosting provider and on a libertarian site) achieved nothing apart from greater publicity for the attacked resources.
Cases of blackmail involving DDoS attacks – or rather, attempts that aren’t always very well executed –have become more frequent. While in the previous quarter companies preferred to pay off the attackers, mass mailings with threats are now often perceived as just another wave of spam.
As a means of applying pressure, DDoS attacks are still more beneficial in industries where downtime and communication failures lead to lost profits and reputation. The gaming industry is becoming even more attractive for cybercriminals: the profits here are estimated in the hundreds of billions of dollars, while security is still far from perfect, with hybrid gaming platforms vulnerable to attacks via the links between resources and applications.
In Q3, there were three high-profile incidents involving gaming platforms (not including the DDoS attack on Final Fantasy’s servers, which, according to Square Enix, began in June and lasted till the end of July).
Firstly, in mid-August, Blizzard Entertainment reported a flood of junk traffic that caused problems for players of Overwatch and World of Warcraft.
Secondly, at the beginning of September, the Americas Cardroom online poker site began to experience difficulties. The attack (not the first to target the resource) followed the notorious pattern “demonstrate force, demand a ransom”. The site’s management refused to pay, but was forced to cancel – or more precisely, to delay – a poker championship that was already under way.
At the end of the quarter, on 30 September, the site of the UK National Lottery was seriously affected: for 90 minutes players were unable to place their stakes online or via applications, which caused the service serious losses.
It appears that constant DDoS attacks on the entertainment industry is becoming the new normal: the largest companies will either have to seriously reconsider their approach to security or put customer loyalty at risk. Some of them have started eliminating possible vectors on their own. For example, Netflix (yet another entertainment platform that could lose customers due to a loss of communication) found a serious vulnerability in API and developed two tools to deal with the infected applications.
Probably the most curious attack of the quarter was also related to the entertainment and gaming industry: the cybercriminals hacked a US casino via a smart fish tank. It had nothing to do with DDoS attacks, but it’s interesting that criminals managed to break through to the mainframe and steal 100 GB of confidential data from the organization, although the fish tank was installed on its own VPN. It is highly likely that in the near future the entertainment and gaming sector will be on a par with the financial sector when it comes to the scope and ingenuity of large-scale attacks.
Quarter Trends
In term of trends, there was a fairly new vector of attacks related to the now notorious crypto- currencies. More and more attacks are targeting Initial Coin Offering (ICO) platforms – a type of crowdfunding. Since blockchain technology allows transactions to be conducted safely, ICOs are quickly gaining in popularity. But there are risks as well: with the rapid growth and the increasing turnover of crypto-currencies, such platforms are subjected to cyberattacks, including DDoS attacks. The broad availability of the platform guarantees reliable and secure transactions, while DDoS attacks are aimed at breaking the operability of the service and thus discrediting it or, even worse, creating a smokescreen for more sophisticated types of attacks.
Another detail of this quarter is the increase in the proportion of mixed, multi-component (SYN + TCP Connect + HTTP-flood + UDP flood) attacks. As forecasted earlier, they are gradually gaining in popularity. There is nothing fundamentally new in these attacks, but in the right hands they can be quite effective.
Statistics for botnet-assisted DDoS attacks
Methodology
Kaspersky Lab has extensive experience of combating cyber threats, including DDoS attacks of various complexity types and ranges. The experts of the company have been tracking the actions of botnets by using the DDoS Intelligence system.
Being part of the Kaspersky DDoS Prevention solution, the DDoS Intelligence system is intended to intercept and analyze commands sent to bots from command-and-control servers and requires neither infecting any user devices nor the actual execution of cybercriminals’ commands.
This report contains DDoS Intelligence statistics for the third quarter of 2017.
In the context of this report, it is assumed that an incident is a separate (single) DDoS-attack if the interval between botnet activity periods does not exceed 24 hours. For example, if the same web resource was attacked by the same botnet with an interval of 24 hours or more, then this incident is considered as two attacks. Also, bot requests originating from different botnets but directed at one resource count as separate attacks.
The geographical locations of DDoS-attack victims and C&C servers that were used to send commands are determined by their respective IP addresses. The number of unique targets of DDoS attacks in this report is counted by the number of unique IP addresses in the quarterly statistics.
It is important to note that DDoS Intelligence statistics are limited only to those botnets that have been detected and analyzed by Kaspersky Lab. It should also be noted that botnets are just one of the tools for performing DDoS attacks; thus, the data presented in this report do not cover every single DDoS attack occurred during the indicated period.
Q3 summary
- Resources in 98 countries were attacked in Q3 2017 vs. 86 in Q2 2017.
- As in Q2, around half of all attacks (51.56%) originated in China.
- China, the US, and South Korea remained leaders in terms of both number of attacks and number of targets. According to the number of reported C&C servers, the same countries are make up the TOP 3, though South Korea calimed first place this time.
- The longest DDoS attack was 215 hours, a decrease of 28% compared to Q2. At the same time, the share of attacks that lasted less than 50 hours remained practically unchanged (99.6% in Q3 vs. 99.7% in Q2).
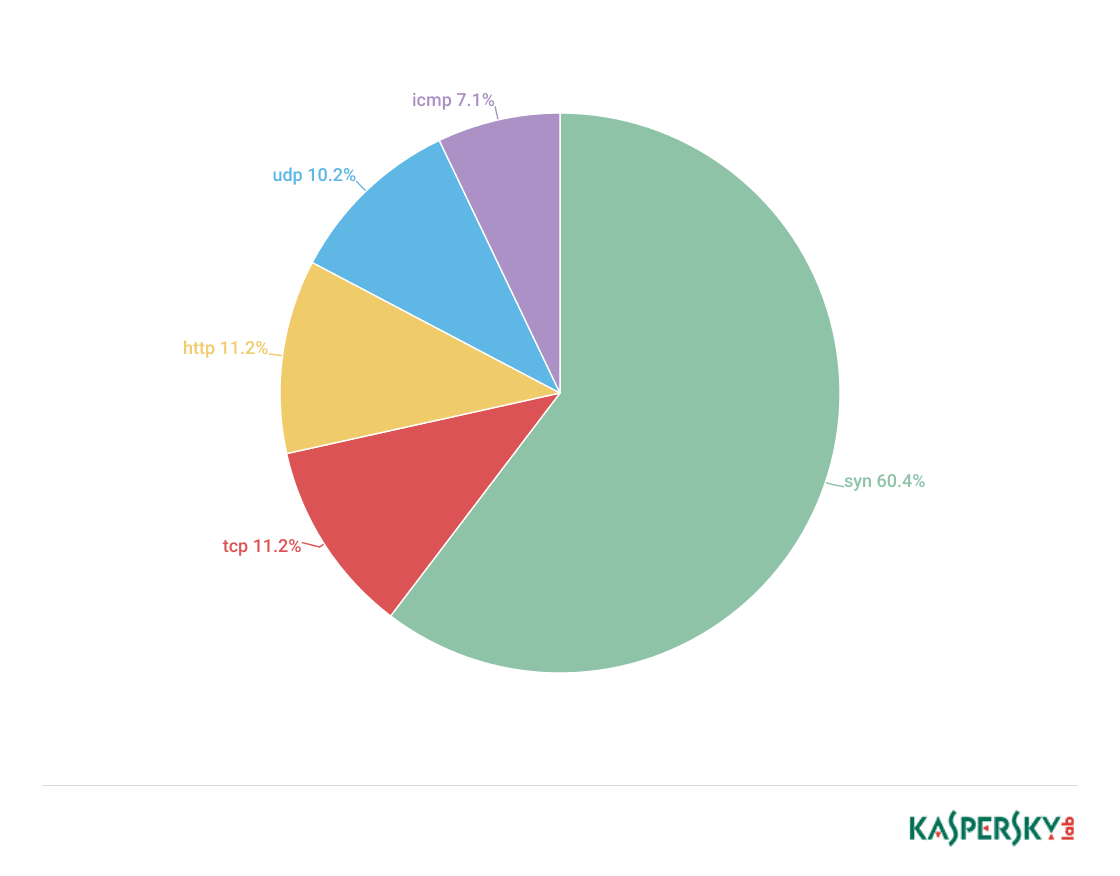
- As in the previous quarter, there was a considerable drop in the proportion of attacks over TCP (down to 11.2% from 28.2%) and ICPM (down to 7.1% from 9.42%). This caused a rise in the percentage of SYN floods and HTTP attacks.
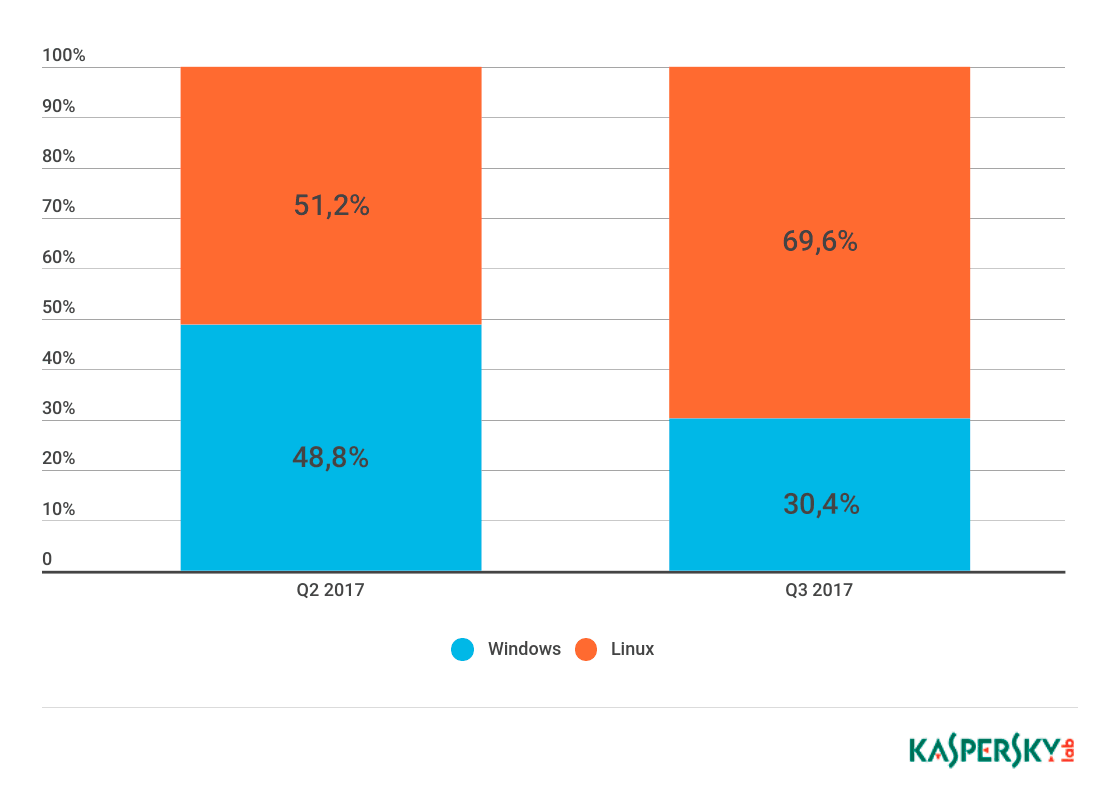
- The proportion of Linux botnets continued to grow. Such botnets were responsible for 69.62% of attacks in Q3 compared to 51.23% in Q2.
Geography of attacks
DDoS attacks were registered in 98 countries in Q3, where the largest number of the attacks were aimed at China (63.30% of all attacks), which is 5.3 p.p. higher than the previous quarter. South Korea’s share fell from 14.17% to 8.70%, moving it to third place. The US came second despite the percentage of attacks originating from this country falling from 14.03% to 12.98%.
The top 10 accounted for 93.56% of all attacks. Germany (1.24%) re-entered the top 10, replacing Italy out of the rating. Hong Kong (1.31%) dropped from 4th to 7th, having lost 1.07 p.p. Russia (1.58%) gained 0.35 p.p. and was once again in fourth place. The UK remained fifth while the Netherlands saw its share go up from 0.84% to 1.31%, moving it to sixth.
91.27% of all attacks were aimed at targets in the countries of the top 10 in Q3 2017.
China remained in first place: 51.56% of all targets were located in the territory of the country, an increase of 4.14 p.p. compared to Q2. At the same time, the US and South Korea remained second and third respectively, although the proportion of targets in the territories of both countries fell considerably: from 18.63% to 17.33% in the US, and from 16.35% to 11.11% in South Korea.
The share of targets located in the territory of Russia grew from 1.33% in Q2 to 2.24% in Q3, which saw Russia move up from seventh to fourth place. Australia and Italy left the top 10 and were replaced by France (1.43%) and Germany (1.65%).
Dynamics of the number of DDoS attacks
The number of attacks per day ranged from 296 (24 July) to 1508 (26 September) in Q3 2017. The peak numbers were registered on 27 July (1399) and 24 September (1497). A relative downturn was registered on 28 July (300), 31 May (240), and 25 September (297).

Dynamics of the number of DDoS attacks in Q3 2017*
*Since DDoS attacks may continuously last for several days, one attack may be counted several times in the timeline, i.e., once per day.
In Q3 2017, Monday remained the quietest day for DDoS attacks (10.39% vs 11.78% in the previous quarter), while Thursday became the busiest day (17.54%). Last quarter’s leader, Saturday, came second (15.59%) followed by Sunday (14.89%) and Tuesday (14.79%).
Types and duration of DDoS attacks
As in the previous quarter, the number of SYN DDoS attacks continued to grow, rising from 53.26% to 60.43% in Q3 2017. At the same time, the percentage of TCP DDoS attacks plummeted from 18.18% to 11.19%, which did not affect second position in the rating for this type of attack. Both UDP and ICMP attacks became quite rare: their share dropped from 11.91% to 10.15% and from 9.38% to 7.08% respectively. Meanwhile, the popularity of HTTP attacks increased from 7.27% to 11.6%, which placed them in third.
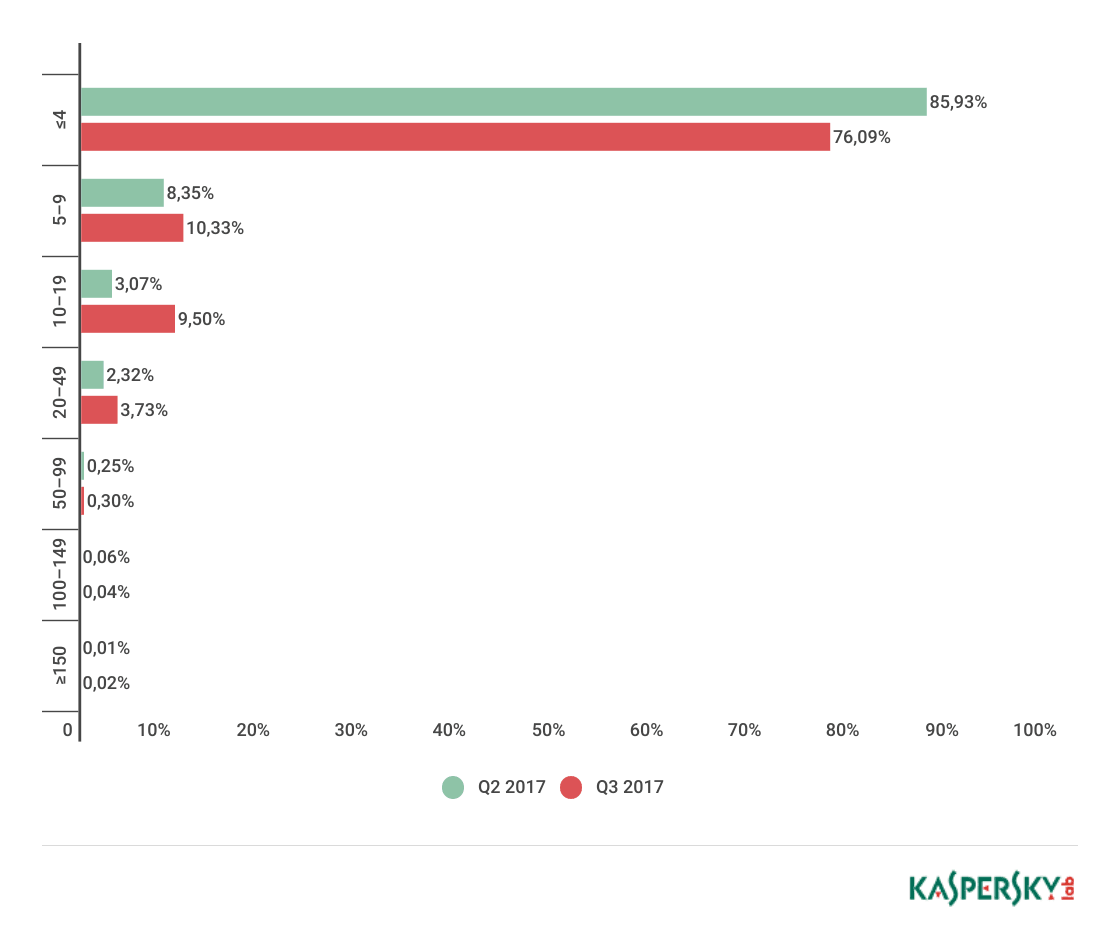
The number of long-term attacks remained almost unchanged from the previous quarter: 0.02% of attacks lasted more than 150 hours (vs 0.01%). The longest attack lasted for 215 hours, 62 hours shorter than the record in Q2. At the same time, the share of attacks that lasted 4 hours or less dropped from 85.93% in Q2 to 76.09% in Q3. Thus, the percentage of attacks lasting from 5 to 49 and from 50 to 99 hours increased, accounting for 23.55% and 0.3% of all attacks respectively.
C&C servers and botnet types
The top 3 countries with the greatest number of detected C&C servers remained unchanged from Q2: South Korea, whose share grew from 49.11% to 50.16%, remained top. The US retained second place (16.94% vs 16.07% in Q2). China remained third although its share dropped from 7.74% to 5.86%. The top 3 countries accounted for 72.96% of C&C servers in total, which is only slightly more than in the previous quarter.
The top 10 included Italy (1.63%) and the UK (0.98%), which ousted Canada and Germany in Q3. Compared to Q2 2017, there was a significant increase in the shares of France (up to 2.93% from 1.79%) and Russia (up to 3.58% from 2.68%).
In Q3, Linux-based botnets continued to win back positions from Windows: the share of detected Linux-based botnets comprised 69.62%, while the percentage of Windows-based botnets dropped to 30.38%.
Conclusion
In the third quarter of 2017, we registered a considerable increase in the number of both DDoS attacks and their targets. Traditionally, China is the country with the largest number of attack sources and targets. It was followed by the United States and South Korea. The popularity of Windows OS as a basis for creating a botnet has fallen noticeably, while the share of Linux-based botnets increased proportionally.
Among this quarter’s trends were increased attacks on ICO platforms: in Q3, crypto-currency was widely discussed both on the Internet and in the mass media, and cybercriminals did not ignore its popularity. Yet another detail of this quarter is the growth in the proportion of multi-component attacks, consisting of various combinations of SYN, TCP Connect, HTTP flood and UDP flood techniques.
DDoS attacks in Q3 2017


mohamed
thanks
nancy liu
thank you!