
- Kaspersky Security Bulletin. Malware Evolution 2010
- Kaspersky Security Bulletin. Statistics, 2010
- Spam Evolution 2010
Kaspersky Lab analyses approximately 1.5 million spam messages daily. The material for analysis includes email flows of different qualities and intensities provided by our clients and partners, as well as spam that has been captured by special ‘traps’. All spam traffic is classified by an automated system. Additionally, part of the incoming flow is analyzed manually. Kaspersky Lab’s unique spam classification system allows the distribution of spam to be studied and quantified according to share and category.
Combating spam and malware distribution in 2010
It can be said that 2010 was ‘revolutionary’ in terms of the campaign against spam, which went on at many different levels throughout the entire year. For the first time, there were significant achievements made by law enforcement agencies worldwide in their struggle against different types of cybercrime, including spam distribution.
During 2010, the command centers of the Waledac, Pushdo / Cutwail, Lethic and Bredolab botnets were closed down, several high-profile cases against suspected cybercriminals got underway and the SpamIt partner program went out of business. The events mentioned led to shifts in the distribution of spam in terms of its sources and categories. For example, the amount of spam originating from the US decreased considerably by the end of the year, while the volume of Eastern European spam grew. For the first time since we began monitoring the situation, we recorded a continuous decline in the volume of spam in mail traffic. However, there are two sides to this particular coin, and on the negative side, spam has become much more dangerous.
We have already mentioned the criminalization of spam: small and medium-sized businesses are gradually turning away from this illegal advertising method, leaving it primarily to fraudsters and distributors of fake and illegal products. In 2010, spam also became a platform for numerous malicious attacks – over the year, the quantity of malicious attachments in mail traffic increased by a factor of almost three.
Malware in email traffic
In 2010, 2.2% of emails contained a malicious attachment compared to 0.85% in 2009. At the peak of the attacks, which occurred during August, the percentage of emails with malicious attachments was only 6.29% of all mail traffic. It may well have been these large-scale attacks which drew the attention of the law enforcement agencies to the spam issue.
The most effective of the methods used by the spammers were bulk emails distributing malware. The messages were convincing imitations of official notifications from popular web resources such as social networks, online stores and banks, etc. The fraudsters used social engineering techniques to ensnare unwary users: clicking on the links contained in the fake messages redirected users to a site advertising Viagra and at the same time – to a malicious site.
By the end of 2010, the distributors of malicious spam had changed the vector of their attacks towards users from the developing countries. This may have been the result of an active anti-botnet campaign in the USA and some Western European countries. The fraudsters began focusing their botnet attacks on users in those countries where law enforcement agencies pay little or no attention to fighting cybercrime.
Botnet closures: key facts and dates
At the beginning of January 2010, the Lethic botnet was shut down. Unfortunately, this had only a negligible effect on the quantity of spam in circulation.
The end of February saw the closure of 277 domains belonging to the Waledac botnet. This was followed by a decrease of 3.1 percentage points in the volume of spam in mail traffic during the first half of March. However, by the end of May the volume of spam had returned to its usual level.
About 20 Pushdo/Cutwail botnet command centers, estimated by many to be responsible for 10% of the total volume of spam, were closed in August. This led to a 1.5 percentage point decline in the volume of spam in September when compared to August.
The last and the most severe blow to the spammers’ business was the closure of 143 Bredolab botnet command centers on 25 October. According to the Dutch police, by the time of its closure this botnet included nearly 30 million computers worldwide. The botnet was used both for pharmaceutical spam and malware distribution. Such spam served a dual purpose; advertizing medication, whilst working as a tool for infecting computers, as was described in detail in our Q3, 2010 spam report.
The closure of the Bredolab botnet command centers seriously affected the quantity of spam in mail traffic. Right after the shutdown it decreased by approximately 8 to 9 percentage points, before reviving once more. However, October’s level remained low and averaged 77.4%, a decrease of 3.6 percentage points compared with September’s figure. The decline in the amount of malicious spam in mail traffic, as well as the drastic reduction in the quantity of spam distributed from the USA, down from 15.5% in August to 1.6% in October, were also the result of the successful campaign against Bredolab.
This campaign was a joint effort between the Computer Emergency Readiness Team (CERT), a special task force from the Dutch police, various IT security experts and the providers of the networks where Bredolab servers had been detected. One of the zombie network owners was arrested the next day at Yerevan International airport. Those users of zombie computers that could be identified received notifications containing information about the infection and recovery instructions.
In addition to its main ‘activities’, before its closure, Bredolab had also downloaded spam bots such as Rustock (Backdoor.Win32.HareBot) and Pushdo (Backdoor.Win32.NewRest.aq) to victims’ computers. The Pushdo spam botnet was in its turn used as the main distributor of Backdoor.Win32.Bredolab.
Spam and law
The arrest of the Bredolab owner was not the only example of its kind in the campaign against spammers in 2010.
At the end of September, members of the group which distributed ZeuS, a malicious program most often spread via spam, were arrested. The arrests were followed by a reduction in the quantity of machines being infected with this malicious program.
In October, law enforcement agencies turned their attentions to partner programs specializing in pharmaceutical spam. The first day of the month was marked by the closure of Spamlt, one of the world’s largest partner programs offering medication. At the end of the month, the Moscow authorities initiated criminal proceedings against the General Director of Despmedia, Igor Gusev. He is charged with selling counterfeit pharmaceuticals, including Viagra, in the USA, Canada and other countries. The medication was advertized in spam emails distributed via the Glavmed.com partner program, and in some experts’ opinion, Spamlt is part of Glavmed.com. In Russia, there is no law against spam distribution, nor in fact, is there a legal definition of spam. So the criminal case against Igor Gusev was initiated under Article 171, Clause 2 of the Criminal Code of the Russian Federation (illegal business, combined with the generation of income on an especially large scale). According to data received from the investigating authorities, Glavmed.com’s turnover could have been as high as US $120 million over the last three and a half years.
At the beginning of December, Oleg Nikolaenko was arrested in Los Angeles. He was charged with spam distribution via the Mega-D botnet command centers which were shut down in November 2009. Law enforcement agencies received a tip-off about Nikolaenko from Australian Lance Atkinson, one of the co-authors of Affking (a partner program offering fake Rolex watches and counterfeit medications), who was convicted last December. It is thought that after the Mega-D and Affking closures Nikolaenko continued to spread spam as an active participant in the Spamlt partner program. He denies any wrongdoing. Oleg Nikolaenko was due to go on trial on 11 February at the latest.
Encouraged by numerous spam-related arrests and accusations, the State Duma, or lower house of the Russian parliament, together with the Russian Association of Electronic Communications (RAEC) amended the Federal Data Protection Act to provide a definition of spam and make spam distribution a criminal offence. This was not the first time such an initiative was brought before the State Duma. As far back as 2004, plans were afoot to amend the relevant law and to introduce criminal liability for sending unsolicited messages. We hope that this time the matter will be pushed through successfully. However, neither the implementation dates nor the final result of these initiatives have yet been made public. According to RAEC’s representatives, the association is not working on any concrete amendment at this time, it is instead developing additions to the code of conduct regarding professional activity on the Internet.
The dynamics of spam development
All the aforementioned events – the closure of the botnet command centers, the shutdown of the Spamlt partner program and the initiation of criminal proceedings against the spammers – affected the structure and characteristics of spam in mail traffic: the volume of unsolicited emails has decreased and the list of the most popular spam sources has changed.
Spam in mail traffic

Spam in mail traffic
As can be seen from the graph, the volume of spam in mail traffic gradually declined in 2009. This is especially true for the autumn months, a period when the Pushdo/Cutwail and Bredolab command centers were shut down, the Spamlt partner program ceased to exist and criminal proceedings were initiated against several spammers.
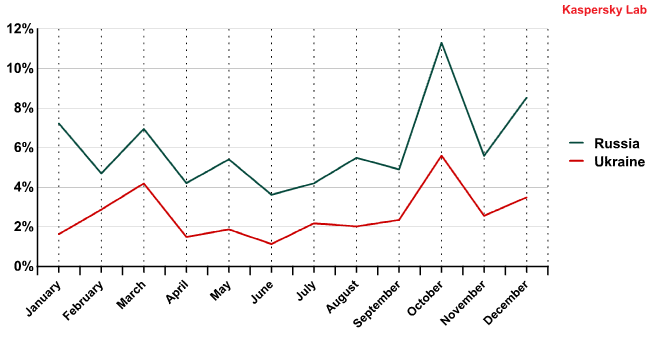
Over the last few years, the amount of spam in mail traffic has not remained at such a low level for such a long period of time. This is reminiscent of the closure in 2008 of the notorious McColo provider that hosted the command centers of several botnets. After McColo was closed, the volume of spam in mail traffic remained low for an entire month at around 73.7%. We can only guess how long the lull will last this time. However, as practice shows, such low levels of spam are unlikely to prevail into next year. Virus writers can and will, create new botnets. Only this time they will surely locate them in countries where the legislation is not so restrictive. This is indirectly confirmed by the fact that most of November’s spam was directed at Russia, India and Vietnam with 8.6%, 6.8% and 6.5% of the share respectively, while the amount of malicious spam received by users in the USA and western European countries decreased considerably.
The amount of spam detected in mail traffic in 2010 averaged 82.2%. A low of 70.1% was recorded on 28 October, with a peak of 90.8% on 21 February.
Sources of spam
In 2010, the largest amount of spam originated from the USA (11.3%), with India [8.3%] and Russia [6.0%] second and third. As in 2009, Asian and Eastern European countries were widely represented in the Top 20, while the countries of Western Europe remained a minority.
The volumes of spam distributed from the leading countries fluctuated throughout the year, which can be seen quite clearly by the changes in the Top 5 sources of spam.

Changes in the Top 5 sources of spam
The USA remained the No.1 source of spam during the first eight months of the year. In September, after the closure of the Pushdo/Cutwail and Bredolab botnet command centers, the volume of spam coming from the USA dropped dramatically and in October it distributed less spam than the other Top 5 members put together. Furthermore, its spam output remained extremely low until the end of the year, at only a few percent instead of the usual 15-20%, and in November and December the USA disappeared from the Top 5 altogether. October saw the start of fluctuations in the levels of distributed spam which in turn affected the other Top 5 sources. We can only assume that the spammers were attempting to set up new botnets in countries where they consider the cybercrime legislation to be much less rigorously enforced than in the USA and Western Europe.
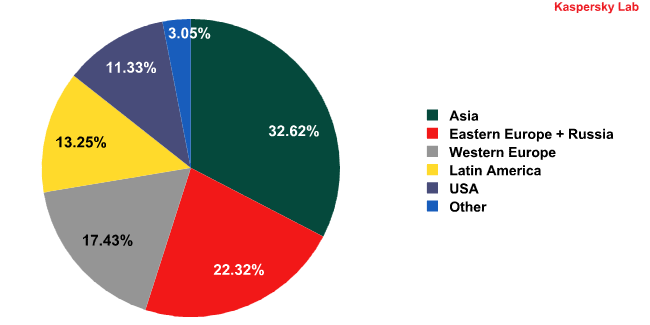
Spam sources by region
In 2010, Asian countries proved to be the most prolific distributers of spam. We highlighted the ‘eastern trend’ with regard to spam distribution last year. In 2010, more than half of all spam (55.9%) was distributed from Asian and Eastern European countries; including Russia. Generally speaking however, the situation regarding spam distribution differed very little in 2010 from that of the year before.
Let’s have a look at the spam distribution dynamics by region:

Spam distribution by region in 2010
The most noticeable shifts happened in the fourth quarter of 2010: the amount of spam distributed from the USA decreased sharply, while the quantity of spam sent from Eastern Europe grew rapidly. As mentioned above, spammers turned to alternative distribution sources after the closure of several botnet command centers.
Overall, the volume of spam originating from Western European nations remained stable, however, each nation’s output varied considerably, with increases for some countries and decreases for others.
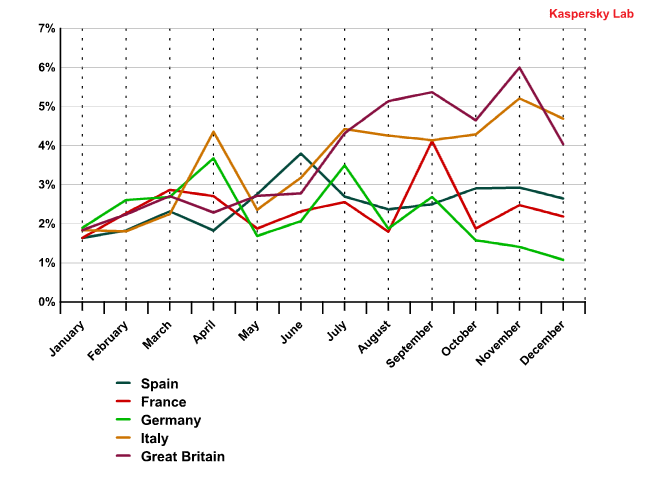
Spam distributed from Western European countries
Contrary to the situation in Western Europe, some other countries’ spam distribution figures almost correlate:
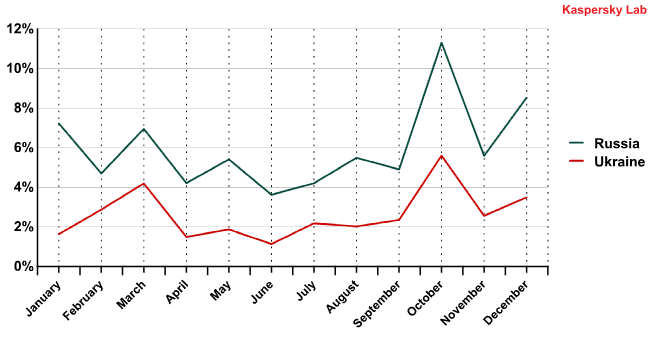

Correlation between the spam distribution of countries from the same region
This suggests that different countries distribute the same bulk emails, indicating that infected computers in these countries may be part of the same botnets.
Spam by category
In 2010, the leading Russian-language spam category, Education, and the leading English-language spam category, Medication and Health-Related Goods and Services were neck-and-neck in the rating: with Education only 0.2 percentage points ahead of its rival.
The share of spam in the Spammer Services (-6.1 percentage points) and Adult content categories (-4.6 percentage points) decreased considerably compared to 2009, while the amount of emails attempting to defraud users in one way or another nearly doubled (+3.8 percentage points).
The year 2010 saw the Top 10 leading spam categories become the Top 11, having been joined by a newcomer – Films on DVD. These were mostly Russian-language emails which contained advertisements for films and cartoons on DVD, as well as educational programs on DVD. Such messages were not entirely new – users had received similar spam before, but in 2010 the volume became so large that it warranted a separate category. It should be stressed that what we are talking about here are pirate copies distributed via partner programs and are entirely counterfeit.
The structure of the different spam categories changed several times throughout the year. August saw a dramatic growth and subsequent climb in position for the Medication and Health-Related Goods category. Its share being quite noticeable in September and October’s mail traffic – just prior to the closure of Spamlt which specialized in the distribution of pharmaceutical spam. No doubt some spammers were aware of the impending closure and were trying to make a last few bucks before the door slammed shut.

The Medication and Health-Related Goods category in 2010
In September, spammers who used to make money offering medication began looking at various other partner programs. This resulted in the short-term growth of different types of spam, including advertisements for online casinos and porn sites.
The closure of the botnets and such an influential partner program could not help but have an effect on the Partner-to-Ordered spam ratio. For example, in August the share of partner spam increased considerably, while in September, it started to decline.
a href=”https://media.kasperskycontenthub.com/wp-content/uploads/sites/43/2011/02/08124607/Partner-and-Ordered-spam-in-2010.png”>
‘Partner’ and ‘Ordered’ spam in 2010
By the end of the year, the share of ‘partner’ spam had dropped to its lowest point – about 30% of the total spam volume, though no doubt it will shoot back up again once the botnets that have been closed are back in action.
Methods and tricks used in spam emails
In 2010, malware distributors used a number of interesting tactics designed to deceive. In order to entice users into clicking on malicious links, they sent messages imitating notifications from well-known resources such as banks, online stores, service providers and social networks, etc. (more details available here). The spammers even imitated technical headers in emails: these headers are generally invisible to users, but are very important for anti-spam filter operation.
Generally speaking, phishing emails are aimed at intimidating users by playing on their fears and thereby tricking them into entering their logins and passwords on phishing sites. Malware distributors also spread fake notifications, but without the scare factor. Part of the message is simply copied from standard notifications sent out to users/customers from legitimate resources.
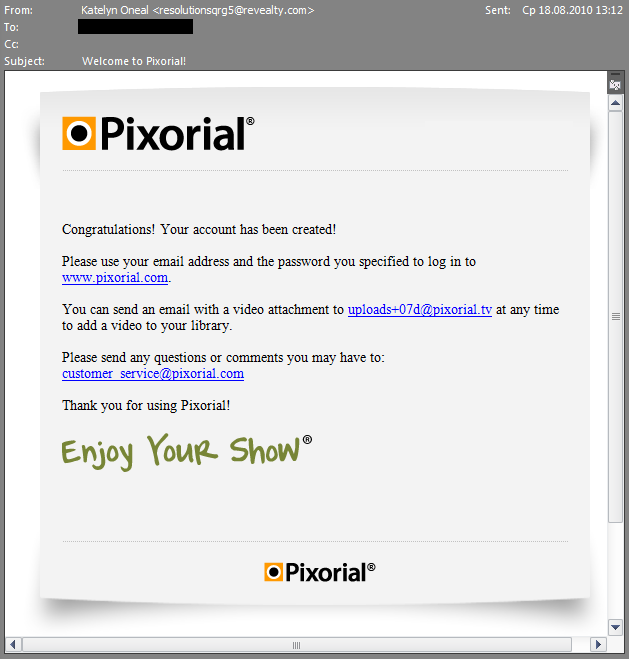
Spam messages imitating notifications from legitimate resources
Fake notifications such as those above are very dangerous: as a rule, advanced users will recognize anomalies in the content, for example, banks never ask their clients to enter their credentials via links in emails. The emails above are good imitations of the original in everything but the links, which ‘awarded’ users a host of malicious programs should they click on them.
Other messages utilized social engineering methods. For example, a user was informed of a purchase they had made and were offered the opportunity to view the purchase details by clicking on the link:

A spam email that makes use of social engineering techniques
All of the links in this email led to one infected site.
Targeted attacks were also registered. Below is an email sent to a recipient with a Kaspersky Lab address:
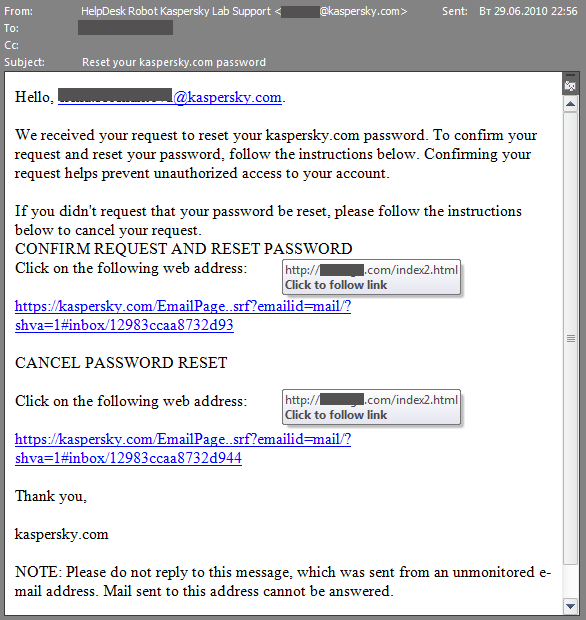
A spam message targeting a specific audience
This is a fake notification from our support service in which a user is asked to either confirm a request to change their password, or cancel it. Notably, the body of the message contains the correct domain. The address in the FROM field is the real support service address. This means that the emails’ authors searched for Kaspersky Lab’s real support service address manually, or with the assistance of a bot, and inserted it into the FROM field in order to make their emails look even more believable. All links in the email led to the same site, as in the previous examples.
Malware in mail traffic
In 2010, malicious files were found in 2.2% of all emails, an increase of 2.6 percentage points compared with the year 2009, in which malicious files were only found in 0.85% of all mail traffic.
The increased numbers of malicious attacks registered in the summer and at the beginning of autumn were largely responsible for the high percentage of malicious spam at the end of the year. These attacks peaked in August.

The percentage of email spam with malicious attachments in 2010
However, as can be seen from the graph, the share of spam containing malicious attachments started to increase in May and by June had already reached a relatively high level, averaging 2.7%.
The month of June 2010 was certainly the most noteworthy in terms of malware distribution. The Internet was flooded with spam emails containing HTML attachments with malicious programs such as Trojan-Downloader.JS.Pegel.g, which took 2nd place in the rating of the Top 10 malicious programs distributed via mail traffic in 2010. These emails imitated notifications from various legitimate sources, including online stores and social networks. The fraudsters used a complex scheme of malware distribution, combining this type of spam with the connection of users’ computers to zombie networks. More details about this scheme are available here.
The volume of emails with malicious attachments peaked in August and September with figures of 6.29% and 4.33% respectively. This was caused by several intense, yet short-term injections of malicious code into email traffic. There was a total of six injections – three in August and three in September. More details about these mass attacks are available in our Q3, 2010 spam report. At the time of writing, the fraudsters were actively starting to send new variants of different malicious programs, including the famous Zbot.
One of the consequences of August and September’s malware attacks was the sharp rise in emails with zipped attachments. Normally, we would not expect to see the share of this type of spam exceed half of one percent. However, in the third quarter of 2010 it reached 2.6%. In the fourth quarter of 2010 the number of emails with zipped attachments fell back to its more usual level of around 0.3%. Nevertheless, we once again remind users of the golden rule of network security – never open archives in suspicious emails.
The Top 10 malicious programs distributed via mail traffic in 2010 looked like this:

The Top 10 malicious programs distributed via mail traffic in 2010
Leading the rating is Trojan-Spy.HTML.Fraud.gen, which is primarily designed to collect users’ personal data and credentials.
Second was Trojan-Downloader.JS.Pegel.g. This malicious program headed the rating in June. The programs belonging to this family are just HTML pages that contain JavaScript. After opening an infected page in a browser, the Trojan starts decrypting its code and executing it. At the same time, a user is redirected to a website infected with exploits from which other malicious programs can be downloaded to the computer using vulnerabilities in its browser.
The Krap family took 4th and 5th positions in the rating. Krap.an and Krap.x are generally used for packing Zbot, FraudTools and Iksmas, whilst Trojan.win32.pakes.Katusha.o packer, which is 9th in the rating, can equally contain a Rogue AV or Zbot.
Over 15% of all objects detected by mail antivirus in 2010 were zero-day threats.
The USA topped the list of countries in which mail antivirus detected malware most frequently in 2010, followed by Germany, the UK and Japan. The Top 10 also includes two more European countries – France and Spain.
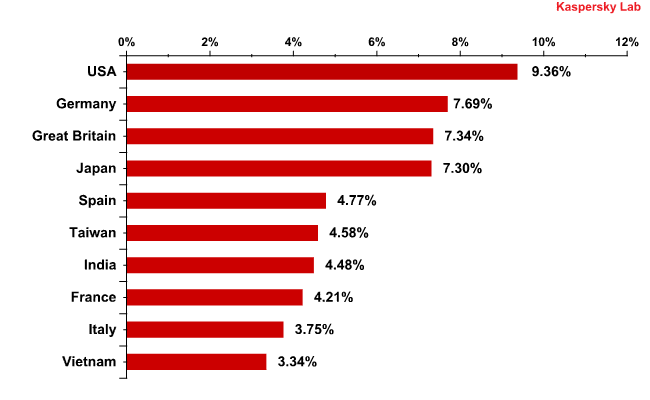
The Top 10 countries in which mail antivirus detected malware most frequently in 2010
The graph above shows that in 2010, the fraudsters once again targeted developed countries. This is easily explained by the fact that the credentials of users living in these countries are especially attractive to the cybercriminals.
However, by the end of the year the fraudsters had switched their attentions to sending spam to developing countries, most probably as a result of the successful anti-botnet campaign in the USA, the UK and other Western European countries. The closure of the popular zombie network command centers, as well as the intense scrutiny of the authorities, forced the cybercriminals to try to locate their botnets in countries where the legal restrictions are not so severe. In November, the countries with the largest amounts of malware detected by mail antivirus were Russia, India and Vietnam. The most popular malware attachments sent to these countries were different Zbot variants and Trojan downloaders of the Oficla family which download bots to users’ computers.
Phishing
In 2010, phishing emails accounted for 0.35% of all mail traffic, a decrease of 0.51 percentage points compared to 2009.
It should be noted that the share of phishing emails was very low throughout the year – around 0.02%. As can be seen from the graph, phishing emails were only prevalent at the beginning and end of the year.

The percentage of emails containing links to phishing sites in 2010
In 2010, phishers changed tack from the previous year. Though PayPal and eBay maintained their leading positions as the organizations most often targeted by phishing attacks, the rest of the Top 10 saw many changes.

Top 10 organizations targeted by phishing attacks in 2010
In 2009, 60% of organizations targeted were banks, while in 2010, the phishers’ attention switched to other online services.
After PayPal and eBay, the most attractive targets for the phishers were social networking accounts. Facebook accounts proved the most popular at 6.95%. The Top 10 featured another social networking site also, Habbo, with an average share of 1.34% of all phishing attacks registered in 2010.
Google’s services also became a popular phishing target. During the third quarter of 2010, we mentioned that the accounts of services such as Google AdWords and Google Checkout were as attractive to the phishers as online bank accounts because they also use credit card information. Such arrangements allow the cybercriminals to acquire both account details and financial data about victims in a single hit.
The online game, World of Warcraft, was a popular target for the phishers throughout the year. The fraudsters were interested in both advanced-level characters and the so called ‘Virtual Gold’ which can be exchanged for real money.
As virtual money becomes a popular target with the phishers, it begs the question as to whether, in the future, fraudsters will focus on stealing virtual rather than real money, considering that they can reap the same rewards, but with less risk of detection than with other types of online fraud.
Forecasts
Next year, we expect a continuation in sophisticated attacks combining phishing, spammer and social engineering techniques. The spammers will certainly be busy distributing malicious spam as they will want to restore their lost botnets.
It is safe to say that that this restoration will inevitably lead to an increase in the quantity of spam in mail traffic. At present, the spammers are still recovering from the powerful blow the authorities dealt to their zombie networks, but we expect to see spam levels return to their previous high levels within a couple of months.
Cybercriminals will become more cautious, employing security software and locating their botnets in countries which are less hostile to cybercrime. This may have already been indirectly confirmed by the fact that in November, mail antivirus most frequently detected malware in Russia, India and Vietnam. The malicious programs sent to these countries included Trojans designed to download bots. Consequently, the whole picture of spam distribution by country will remain in a state of flux.
We have written many times that the fight against spam must be multifaceted, combining legislative, technological and educational initiatives. The year 2010 proved that this approach could succeed. The closure of several botnet command centers, increased law enforcement activities and various legislative initiatives offer hope that spam is being taken seriously and is no longer seen as something that anti-spam vendors must tackle alone. We believe this is just the start and that next year will be a turning point in the struggle against spam.
If law enforcement agencies, hosting service providers and IT experts all join forces in the struggle against the cybercriminals, eventually the Internet will become a much safer place for the user.
Meanwhile, we recommend that users ignore advertisements in spam emails and never click on the links they contain, that they install software updates as they become available and install proprietary anti-malware software on their computers. Remember, email spam can seriously damage your computer.






Kaspersky Security Bulletin. Spam Evolution 2010