

Authors
- Kaspersky Security Bulletin 2012. Malware Evolution
- Kaspersky Security Bulletin 2012. The overall statistics for 2012
This section of the report forms part of the Kaspersky Security Bulletin 2012 and is based on data obtained and processed using Kaspersky Security Network (KSN). KSN integrates cloud-based technologies into personal and corporate products, and is one of Kaspersky Lab’s most important innovations.
KSN helps Kaspersky Lab experts swiftly detect new malware in real time, even when no corresponding signature or heuristic detection exists for these threats. KSN helps identify sources of malware proliferation on the Internet and blocks user access to them.
At the same time, KSN’s rapid, real-time response to new threats enables us to block new threats from launching on users’ computers within a few seconds of them being identified as malicious, and without having to update the antivirus database first.
The statistics in this report are based on data obtained from Kaspersky Lab products installed on users’ computers worldwide and were obtained with the full consent of the users involved.
Mobile malware
The evolution of mobile malware in 2012 was a predominantly Android-related affair, with malware writers largely concentrating their efforts on the little green robot. Our mobile malware predictions for 2012 concerning the creation of mobile botnets, targeted attacks using malicious mobile programs and mobile espionage were also pretty accurate.
Malware for Android
The main thrust of malware writing activity in 2012 was focused on malicious programs for Android. This resulted in both qualitative and quantitative growth in mobile malware for this platform. 99% of all the mobile malware we detected every month was designed for Android.
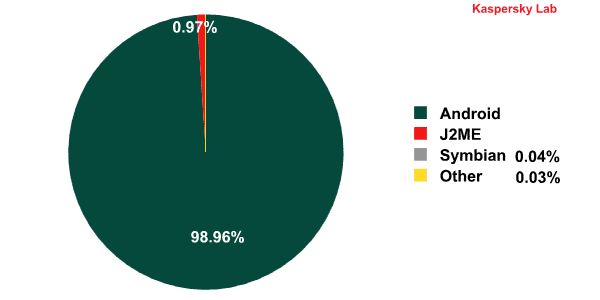
Distribution of mobile malware by platform, 2012
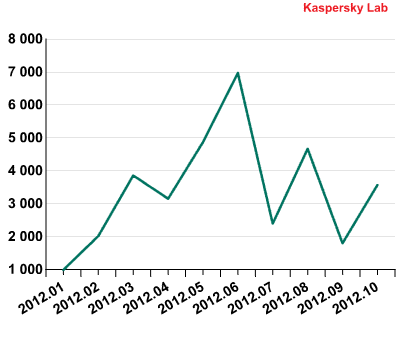
Monthly fluctuations in the emergence of new malicious programs, 2012

Top 10 malicious programs for Android
The most widespread malicious objects detected on Android smartphones can be divided into three main groups: SMS Trojans, advertising modules and exploits to gain root access to smartphones.
The most widespread of these were SMS Trojans, primarily targeting users in Russia. This is hardly surprising considering the popularity of this type of malicious program among Russian malware writers. Expensive SMS text messages remain the best source of income for ‘mobile’ cybercriminals.
The second group of mobile threats from the top 10 consists of the advertising modules Plangton and Hamob. It’s no coincidence that the first of those families is detected as a Trojan. Plangton is found in free apps and does indeed display adverts, but it also contains functionality that modifies the home page in a browser. The home page is changed without the user’s consent and without warning, which is considered malicious behavior. Hamob, which is detected as AdWare.AndroidOS.Hamob, masquerades as legitimate software, but only actually displays adverts.
The third group is made up of root exploits for smartphones running various versions of Android OS.
The same exploit modifications that are used to obtain root privileges on devices are used by an increasing number of backdoor modifications. This partly explains their popularity over the past year.
Rise in the number of malicious programs in official app stores
Even though the Google Bouncer antivirus module has been deployed to automatically scan all new apps in Google Play (formerly Android Market), there has been no significant change to the average number and scale of malware incidents. The general public usually only notices those incidents that cause the most infections, as was the case with the Dougalek malicious program which tens of thousands of people downloaded (mostly in Japan). It led to one of the biggest data breaches ever caused as a result of mobile devices being infected. However, it shouldn’t be forgotten that there are hundreds of other incidents involving smaller numbers of victims.
In early July malware was also detected for the first time in the App Store for iOS when copies of a suspicious application called Find and Call appeared. It was also detected in Android Market. After being loaded and launched, users were asked to enter their email and telephone number in order to register the app. The data and the phonebook contacts were then sent to a remote server without the victims’ knowledge.
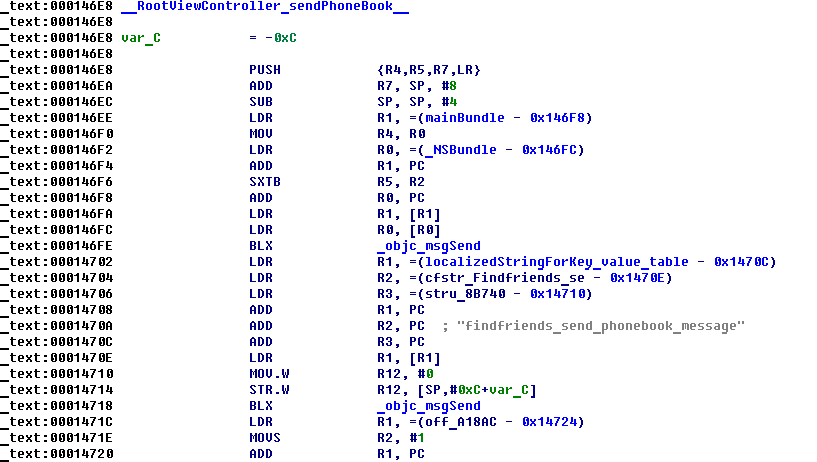
Part of the procedure for loading a phonebook to the remote server
Every number from the stolen phonebook later received a spam text message prompting the recipient to download the Find and Call app.
The first mobile botnets
The alarm bells started ringing at the very beginning of the year with the detection of Foncy, an IRC bot for Android that functioned together with an SMS Trojan of the same name. Along with the SMS Trojan, the APK dropper contained a root exploit for privilege escalation in an infected system meaning the IRC bot could remotely control a smartphone after it was infected. Once it was connected to the command server the bot was capable of receiving and executing shell commands. In effect, smartphones infected by the Foncy IRC bot comprised a full-fledged botnet capable of doing just about anything the botmasters commanded.
The Chinese authors succeeded in creating a botnet of anything between 10 and 30,000 active devices, with the total number of affected devices estimated to run into hundreds of thousands. The botnet was created using the RootSmart backdoor, which has extensive functionality related to remotely controlling Android phones and tablets. RootSmart is distributed using a proven method: the malware writers have re-packed a legitimate program and uploaded it to the website of an unofficial Android application store that is very popular in China. As a result, people who downloaded the program to help them set up their phones also received a backdoor that made their devices part of the botnet.
The scope of the RootSmart infection means that the attackers have been able to profit from the mobile phone botnet. They chose the most popular method used by mobile cybercriminals: sending paid SMS messages to short codes. The perpetrators used the cheapest numbers so that it took longer for the victims to notice money was being stolen. Full control allows the attackers to hide the presence of malware on the phone over extended periods of time, letting them syphon money from each user’s account for longer.
Targeted attacks using mobile malware
In 2012 there were several new non-Android-based malicious programs used in targeted attacks.
Typical examples include attacks using Zeus- and SpyEye-in-the-Mobile (ZitMo and SpitMo). New versions of ZitMo and SpitMo appeared regularly for Android and other operating systems. The malware writers are using the same methods to mask the malware as they were two years ago. This involves imitating either security certificates or security software for smartphones.
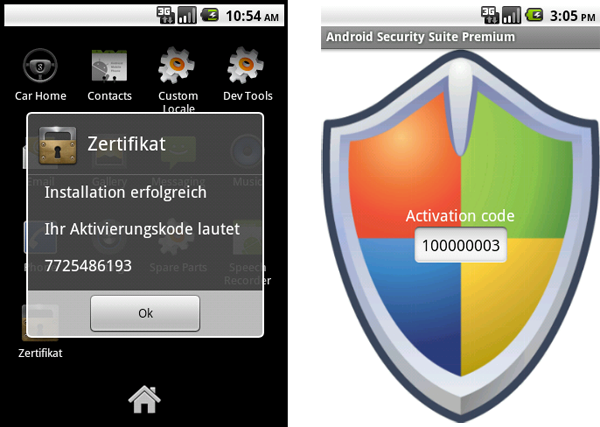
Typical ZitMo/SpitMo masking
Although non-Android devices are less popular, they still have their users. With new versions of ZitMo appearing for BlackBerry in 2012, the malware writers are obviously taking no notice of the rumors about the platform’s impending demise. One wave of attacks even saw cybercriminals using malware for both the BlackBerry and Android platforms, or at least the C&C numbers were the same.
Mobile espionage
Last year we said data theft from mobile phones and the tracking of subjects using their telephones and geolocation services would become widespread, going well beyond the traditional use of such technologies by law enforcement agencies and private investigation companies.
Unfortunately, this was the case. The number of malicious programs acting either as Trojan spyware or backdoors increased a thousand times. It is also worth pointing out the increasing number of commercial applications for monitoring, barely distinguishable from malware, which appeared this year.
The most prominent example of mobile malware being used for espionage was an incident involving a FinSpy program module. The module was created by British company Gamma International, which develops monitoring software for government agencies. In effect, the program functions as Trojan spyware. A mobile version of FinSpy was detected by The Citizen Lab in August, 2012. Modifications of the Trojan were discovered for Android, iOS, Windows Mobile and Symbian. Although they are different for each platform, all of them can log almost any user activity on an infected device, track its position, make hidden calls and load data to remote servers.
The identity of FinSpy customers and the victims of their attacks remain a mystery and that is unlikely to change in the future. However, even without this information, the emergence of FinSpy marks a new chapter in the history of mobile malware: mobile devices are falling victim to targeted and spy attacks just like computers.
Malware for Mac
2012 saw the comprehensive debunking of every myth about the security of Mac environments. This year has demonstrated that Mac malware is in fact a serious threat to cyber-security.
In early 2012, the Flashfake botnet was discovered, consisting of 700,000 computers all running under Mac OS X. (A complete analysis of this Trojan downloader was published at securelist.com.
There were no new epidemics after Flashfake, but cybercriminals repeatedly used Mac malware when launching targeted attacks throughout the year. The main reason for this is that Apple products are popular with many influential politicians and prominent businessmen, and the information stored in the devices owned by these people is of interest to a certain category of cybercriminal.
In 2012, Kaspersky Lab’s antivirus experts created 30% more signatures to detect various Mac Trojans than in 2011. Going back to 2010’s figures, the number of signatures created annually has increased six times.
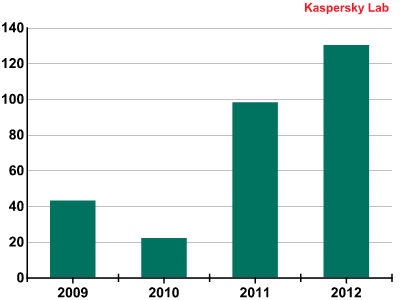
Number of new antivirus signatures created each year to detect Mac OS X malware
There is no question that Flashfake was the year’s most widespread Mac malware – its earliest versions were detected back in 2011. In the first six months of 2012, Flashfake was without doubt the biggest threat. Now, let’s turn to the OS X malware that was being circulated in the second half of 2012.
TOP 10 malicious programs for Mac OS X, H2 2012
| Rank | Name | % of all attacks |
| 1 | Trojan.OSX.FakeCo.a | 52% |
| 2 | Trojan-Downloader.OSX.Jahlav.d | 8% |
| 3 | Trojan-Downloader.OSX.Flashfake.ai | 7% |
| 4 | Trojan-Downloader.OSX.FavDonw.c | 5% |
| 5 | Trojan-Downloader.OSX.FavDonw.a | 2% |
| 6 | Trojan-Downloader.OSX.Flashfake.ab | 2% |
| 7 | Trojan-FakeAV.OSX.Defma.gen | 2% |
| 8 | Trojan-FakeAV.OSX.Defma.f | 1% |
| 9 | Exploit.OSX.Smid.b | 1% |
| 10 | Trojan-Downloader.OSX.Flashfake.af | 1% |
In first place is Trojan.OSX.FakeCo.a (52%). This malicious program masquerades as a video codec installation file. After installation, however, no new codecs appear in the system; the installed program behaves as an adware program, collecting information about the user that may be of interest for marketing purposes, and then sends it to cybercriminals.
Jahlav (8%), a Trojan that has been active for four years, came second. This malicious program also masquerades as a video codec installation file, but during installation a malicious program is installed instead. The malware furtively contacts a malicious server and can download other files to the victim computer. It usually attempts to download a Trojan that changes addresses in the DNS settings to those of malicious servers. This malicious program is detected by Kaspersky Lab’s products as Trojan.OSX.Dnscha.
Fourth and fifth places were occupied by malicious programs from the Trojan-Downloader.OSX.FavDonw family, which together account for 7% of all incidents. These programs serve just one purpose: once installed on a Mac, they download rogue antiviruses.
In seventh and eighth places were fake antivirus programs from the Trojan-FakeAV.OSX.Defma family. They extort money from users for treating malware that was allegedly detected on their computers.
Ninth place is taken by Exploit.OSX.Smid.b, an exploit that targets a Java vulnerability and allows the cybercriminal to run an arbitrary code on a computers where Java hasn’t been updated.
When the Flashfake botnet was discovered, Apple took a tougher stance on security for its operating system. Examples include releasing critical patches for Oracle Java simultaneously with their Windows versions, and new security features in Mac OS X Mountain Lion: only software from the official online store can be installed by default; programs downloaded from the store are launched in a sandbox; updates are installed automatically, etc.
Malicious programs on the Internet (attacks via the web)
The number of browser-based attacks in 2012 increased from 946,393,693 to 1 595 587 670. That means that Kaspersky Lab products protected users an average of 4 371 473 times every day when they were online.
Web-based attacks have increased at a similar rate to previous years. The number of attempted web-based infections in 2012 is 1.7 times greater than in 2011, while the number in 2011 was 1.6 times greater than in 2010. The main tool behind browser-based infections is still the exploit pack, which gives cybercriminals a surefire chance of infecting victim computers that do not have a security product installed, or have at least one popular application that is vulnerable (lacking security updates).
Vulnerable applications targeted by malicious users
While we called 2011 the year of the vulnerability, 2012 can justifiably be described as the year of the Java vulnerability, with half of all detected exploit-based attacks targeting vulnerabilities in Oracle Java.
Today, Java is installed on more than 3 billion devices running under various operating systems. Therefore, cross-platform exploits can be created for certain Java vulnerabilities. During the year, we detected both broad-scale attacks using exploit kits, and targeted attacks using Java exploits that targeted both PCs and Mac computers.
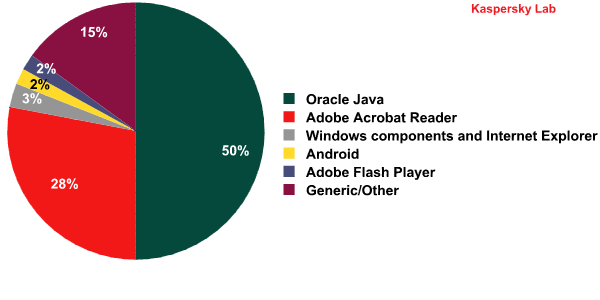
Applications containing vulnerabilities targeted by web exploits in 2012
In 2012, exploits for Adobe Reader lost some of their prominence, accounting for 28% of all incidents. This placed Adobe Reader in second place in our rating. It should be noted that Adobe has focused more on addressing the problem of vulnerabilities in the latest versions of Adobe Reader. In particular, tools were implemented to protect the application from exploit activity. These measures make it much harder to create effective exploits for the software.
Exploits for Windows and Internet Explorer were the third most popular. In 2012, active exploits were still targeting vulnerabilities detected as far back as 2010, namely MS10-042 in Windows Help and Support Center, and MS04-028 associated with incorrect handling of JPEG files.
Fourth place (2%) is occupied by Android exploits. Cybercriminals use these exploits to gain root privileges, after which they obtain almost complete control over the targeted system.
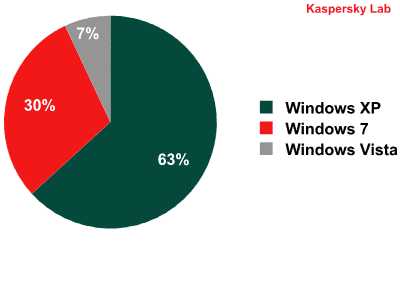
Windows versions installed on users’ computers, 2011
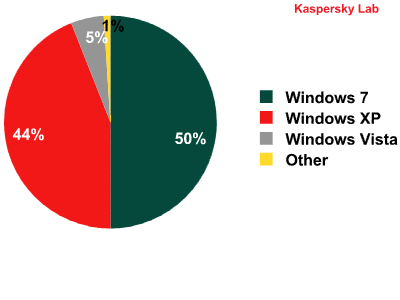
Windows versions installed on users’ computers, 2012
Over the past year, the proportion of computers running Windows 7 has jumped from 30% to 50%. Although Windows 7 updates automatically on a regular basis, this does not prevent attacks from taking place. As we wrote above, the system is typically breached via applications from other manufacturers rather than Windows components.
TOP 20 malicious programs on the Internet
We have identified the top 20 most active malicious programs involved in web attacks on users’ computers. This list accounts for 96% of all web attacks.
| Rank | Name* | Number of attacks | % of all attacks** |
| 1 | Malicious URL | 1 393 829 795 | 87.36% |
| 2 | Trojan.Script.Iframer | 58 279 262 | 3.65% |
| 3 | Trojan.Script.Generic | 38 948 140 | 2.44% |
| 4 | Trojan.Win32.Generic | 5 670 627 | 0.36% |
| 5 | Trojan-Downloader.Script.Generic | 4 695 210 | 0.29% |
| 6 | Exploit.Script.Blocker | 4 557 284 | 0.29% |
| 7 | Trojan.JS.Popupper.aw | 3 355 605 | 0.21% |
| 8 | Exploit.Script.Generic | 2 943 410 | 0.18% |
| 9 | Trojan-Downloader.SWF.Voleydaytor.h | 2 573 072 | 0.16% |
| 10 | AdWare.Win32.IBryte.x | 1 623 246 | 0.10% |
| 11 | Trojan-Downloader.Win32.Generic | 1 611 565 | 0.10% |
| 12 | AdWare.Win32.ScreenSaver.e | 1 381 242 | 0.09% |
| 13 | Trojan-Downloader.JS.Iframe.cxk | 1 376 898 | 0.09% |
| 14 | Trojan-Downloader.JS.Iframe.cyq | 1 079 163 | 0.07% |
| 15 | Trojan-Downloader.JS.Expack.sn | 1 071 626 | 0.07% |
| 16 | AdWare.Win32.ScreenSaver.i | 1 069 954 | 0.07% |
| 17 | Trojan-Downloader.JS.JScript.ag | 1 044 147 | 0.07% |
| 18 | Trojan-Downloader.JS.Agent.gmf | 1 040 738 | 0.07% |
| 19 | Trojan-Downloader.JS.Agent.gqu | 983 899 | 0.06% |
| 20 | Trojan-Downloader.Win32.Agent.gyai | 982 626 | 0.06% |
* These statistics represent detected verdicts of the web-based antivirus module and were submitted by users of Kaspersky Lab products who consented to share their local data.
**The percentage of unique users with computers running Kaspersky Lab products that blocked online threats.
First place is taken by malicious sites detected with the help of cloud-based heuristic detection methods that don’t rely on updates of traditional antivirus databases.
By developing new detection technologies which rely on KSN’s capabilities the percentage of threats detected via heuristic methods rose from 75% to 87% over the past year. Most malicious URL detections were for websites containing exploits.
In second place are malicious scripts that hackers have injected in the code of compromised legitimate websites. This suggests there are many legitimate sites containing malicious code in the form of hidden iframe tags. Such scripts are used to perform drive-by attacks, in which the user (who does not see anything suspicious) is redirected to malicious online resources. Similar malicious scripts also appear in 13th and 14th place.
The threats in third and fifth places are different heuristic verdicts that detect malicious code in the form of scripts and executable PE files. This malware falls into two categories. The first downloads and launches other malicious programs. The second carries the actual payload, which steals data from online banking and social network accounts, or similar login and user account details for other services.
Detected on various adult content sites, Trojan-Downloader.SWF.Voleydaytor.h occupies ninth place. It claims to update a video playback program, while actually delivering various malicious programs to users’ computers.
The ranking includes two exploits: Exploit.Script.Generic (nearly 3 million download attempts blocked) and Exploit.Script.Blocker (4.5 million download attempts blocked). In the vast majority of cases, users encounter exploit packs rather than individual exploits. Today, exploit packs are an integral part of drive-by attacks. Exploit packs can be modified and updated on the fly, ensuring they include exploits for new vulnerabilities and can counteract security tools.
Three entries in the Top 20 are adware programs from the iBryte and ScreenSaver families. The adware program AdWare.Win32.IBryte.x spreads as a downloader of popular freeware. Once started, it downloads the freeware program required by the user, and simultaneously installs an adware module. It’s just as easy to download the programs you need from their official sites, saving you the trouble of removing adware later. Last year, there were twice as many adware programs in this list. Their share is decreasing as they have gradually given way to more effective and, most importantly, legal methods of advertising, such as contextual advertising in search engines and social networks.
Unlike in 2011, the Top 20 does not include any malware programs used in short number scams such as Hoax.Win32.ArchSMS. These programs prompt the user to send a message to a short number to receive a code with which to decrypt an archive that the user has downloaded. In 2011, cybercriminals created sites that looked similar to regular file stores, but the archives on offer did not contain the promised content. In 2012, cybercriminals started to mass-produce sites that can implement similar scams without loading any files to the hard drive. Such sites are automatically denylisted by Kaspersky Lab’s products.
TOP 20 countries where web resources are seeded with malware
While launching 1 595 587 670 web attacks, cybercriminals used 6 537 320 unique domains – 2.5 million more than last year. Servers seeded with malicious code were detected in the Internet zones of 202 countries around the world. Just 20 of those countries accounted for 96.1% of all malicious hosting detected by Kaspersky Lab.
| Rank | Country* | Number of attacks** | % of all attacks |
| 1 | United States | 413 622 459 | 25.5% |
| 2 | Russian Federation | 317 697 806 | 19.6% |
| 3 | Netherlands | 271 583 924 | 16.8% |
| 4 | Germany | 184 661 326 | 11.4% |
| 5 | United Kingdom | 90 127 327 | 5.6% |
| 6 | Ukraine | 71 012 583 | 4.4% |
| 7 | France | 56 808 749 | 3.5% |
| 8 | China | 31 637 561 | 2.0% |
| 9 | Virgin Islands, British | 26 593 331 | 1.6% |
| 10 | Canada | 19 316 279 | 1.2% |
| 11 | Czech Republic | 13 311 441 | 0.8% |
| 12 | Israel | 9 953 064 | 0.6% |
| 13 | Sweden | 9 093 053 | 0.6% |
| 14 | Romania | 6 881 404 | 0.4% |
| 15 | Vietnam | 6 624 570 | 0.4% |
| 16 | Spain | 6 543 135 | 0.4% |
| 17 | Poland | 6 325 848 | 0.4% |
| 18 | Luxembourg | 5 669 370 | 0.3% |
| 19 | Ireland | 4 854 163 | 0.3% |
| 20 | Latvia | 4 685 861 | 0.3% |
These statistics are based on the detection verdicts of the web antivirus module, and were provided by users of Kaspersky Lab products who consented to transfer their statistical data.
* In order to determine the geographical source of an attack, the domain name is compared to the actual IP address where the domain in question is located, and the geographical location of the IP address is determined (GEOIP).
** The total number of unique attacks from web resources originating in the country as recorded by the web antivirus module.
The first two places in this Top 20 are taken by the US (25.5%) and Russia (19.6%).The Netherlands (16.8%) and Germany (11.4%) were ranked third and fourth for the third year in a row. While the US share in 2012 only increased by 0.1 percentage points, Russia’s (+5 percentage points), the Netherlands’ (+7 percentage points) and Germany’s (+2.7 percentage points) numbers increased more significantly.
Before 2010, China was the biggest host of malicious services, offering a home to more than 50% of all malicious resources around the world. In 2010, the Chinese authorities managed to remove a substantial number of malicious hosting services from the country’s local cyberspace. At the same time, stricter regulations were introduced for registering domains in the .cn zone. After that, China’s share in malicious hosting has plummeted. We have since seen a gradual consolidation of malicious hosting sites in the US, Russia, the Netherlands, and Germany.
As for the steady growth of Russia’s share, there are two underlying reasons. Firstly, all too often legitimate sites are hacked, including the largest portals in the .ru zone, and used to infect users’ computers with the help of exploits. Secondly, Russia’s authorities have historically been quite lax toward cybercriminals, so the latter go on creating lots of malicious sites. Under Russian legislation, cybercriminals are given pretty lenient (typically suspended) sentences; it’s rare to see a botnet C&C server taken down in Russia. Based on current growth rates, Russia could be the biggest source of malicious hosting services as early as next year.
Cybercriminals in the Netherlands and Germany are much more cautious in their activities.They register or hack huge numbers of sites; when the URLs of malicious sites are denylisted by Internet service providers, they are quick to migrate malicious content to other servers.
Local threats
Local infection statistics for user computers are a critically important indicator. This data points to threats that have penetrated a computer system through something other than the Internet, email, or network ports.
Kaspersky Lab antivirus solutions detected nearly 3 billion malware incidents on computers participating in the Kaspersky Security Network.
In total, 2.7 million different malicious or potentially unwanted programs were detected in these incidents.
Malicious objects detected on user computers: Top 20
The malicious programs in the Top 20 below are the most widespread local threats of 2012.
| Rank | Name | Number of unique users* | %% |
| 1 | Trojan.Win32.Generic | 9,761,684 | 22.1% |
| 2 | DangerousObject.Multi.Generic | 9,640,618 | 21.9% |
| 3 | Trojan.Win32.AutoRun.gen | 5,969,543 | 13.5% |
| 4 | Trojan.Win32.Starter.yy | 3,860,982 | 8.8% |
| 5 | Virus.Win32.Virut.ce | 3,017,527 | 6.8% |
| 6 | Net-Worm.Win32.Kido.ih | 2,752,409 | 6.2% |
| 7 | Net-Worm.Win32.Kido.ir | 2,181,181 | 4.9% |
| 8 | Virus.Win32.Sality.aa | 2,166,907 | 4.9% |
| 9 | Hoax.Win32.ArchSMS.gen | 2,030,664 | 4.6% |
| 10 | Virus.Win32.Generic | 2,017,478 | 4.6% |
| 11 | Virus.Win32.Nimnul.a | 1,793,115 | 4.1% |
| 12 | HiddenObject.Multi.Generic | 1,508,877 | 3.4% |
| 13 | Trojan.WinLNK.Runner.bl | 1,344,989 | 3.1% |
| 14 | Worm.Win32.AutoRun.hxw | 948,436 | 2.2% |
| 15 | Virus.Win32.Sality.ag | 841,994 | 1.9% |
| 16 | Virus.Win32.Suspic.gen | 408,201 | 0.9% |
| 17 | Trojan.Win32.Patched.dj | 367,371 | 0.8% |
| 18 | Email-Worm.Win32.Runouce.b | 295,887 | 0.7% |
| 19 | Trojan-Dropper.Script.Generic | 232,007 | 0.5% |
| 20 | AdWare.Win32.GoonSearch.b | 196,281 | 0.4% |
These statistics are based on the detection verdicts of the antivirus module, and were received from users of Kaspersky Lab products who consented to provide their statistical data.
*The number of unique users on whose computers an antivirus program detected this particular threat.
Infection attempts were blocked on 13.5 million computers after they were detected, using various heuristic methods, as Trojan.Win32.Generic (1st place), Virus.Win32.Generic (8th place), HiddenObject.Multi.Generic (12th place), and Trojan-Dropper.Script.Generic (19th place).
Second place is occupied by various malicious programs that were detected using cloud technologies as DangerousObject.Multi.Generic. Cloud technologies are effective when signatures or heuristics for detecting a specific malicious program are not yet available, but the antivirus vendor already has information about the threat in its cloud. In effect, this is how the latest malware is detected. Over 9.6 million user machines were protected in real time using the Urgent Detection System (UDS), which is part of the Kaspersky Security Network.
Seven programs in this Top 20 either have a self-replication mechanism or are used as components in the proliferation mechanism of worms: Trojan.Win32.Starter.yy (4th place), Net-Worm.Win32.Kido.ih (6th place), Net-Worm.Win32.Kido.ir (7th place), Virus.Win32.Sality.aa (8th place), Virus.Win32.Nimnul.a (11th place), Virus.Win32.Sality.ag (15th place) and Virus.Win32.Suspic.gen (16th place).
In 2012, over 2 million users came across scams involving premium SMS numbers (Hoax.Win32.ArchSMS.gen, 9th place). Attackers attempt to lure users into sending an SMS messages to premium numbers, mostly by promising them access to an archive installer for a game, program, e-book, etc. In most cases, users receive nothing in return after sending premium messages.
Trojan.WinLNK.Runner.bl (13th place) and Worm.Win32.AutoRun.hxw (14th place) are detection verdicts for malicious .lnk files (i.e. shortcuts). The .lnk files in these malware families launch cmd.exe with a parameter designed to execute a malicious .exe file. Worms commonly use such files to spread via USB drives.
Another curious specimen is Trojan.Win32.Patched.dj (17th place). This is a detection verdict for infected .exe and .dll files. The payload is designed to email information about the infection to the malware writer and then open a port on the computer and wait for commands. The hackers behind the malware can download files to the infected computer, execute them, terminate programs running on the computer, etc. Ultimately, this malware is used for building botnets.
Infection mechanisms are rapidly evolving, and we can see that this year no new virus or worm families are represented in the ranking: the show is run by Sality, Virut, last year’s Nimnul and Kido. Cybercriminals have, to a large extent, switched to creating botnets through infecting computers online using exploits. Techniques that involve infecting executable files are not popular among commercially-oriented malware writers, because controlling the self-replication of viruses and worms is very difficult and large botnets are quickly detected by law enforcement agencies.
The big picture
In order to assess in which countries users face cyber-threats most often, we calculated how often antivirus products returned detection verdicts on user machines in each country. The resulting data characterizes the risk of infection to which computers are exposed in different countries across the globe, providing an indicator of the aggressiveness of the environment in which computers work in different countries.
Web threats
The risk of online infection, which is the main source of malicious objects for users in most countries of the world, is of the greatest interest.
| Rank | Country | % of unique users* |
| 1 | Russian Federation | 58.6 |
| 2 | Tajikistan | 58.5 |
| 3 | Azerbaijan | 57.1 |
| 4 | Armenia | 55.7 |
| 5 | Kazakhstan | 55.5 |
| 6 | Belarus | 51.8 |
| 7 | Bangladesh | 51.7 |
| 8 | Sri Lanka | 51.5 |
| 9 | India | 51.1 |
| 10 | Sudan | 51.0 |
| 11 | Turkmenistan | 51.0 |
| 12 | Oman | 48,0 |
| 13 | Uzbekistan | 47.5 |
| 14 | Malaysia | 47.3 |
| 15 | Moldova | 47.2 |
| 16 | Maldives | 46.8 |
| 17 | Ukraine | 46.8 |
| 18 | Italy | 45.6 |
| 19 | United States | 45.1 |
| 20 | Spain | 44.7 |
These statistics are based on the detection verdicts returned by the web antivirus module, received from users of Kaspersky Lab products who have consented to provide their statistical data. We excluded those countries in which the number of Kaspersky Lab product users is relatively small (less than 10,000).
* Unique users whose computers have been targeted by web attacks as a percentage of all unique users of Kaspersky Lab products in the country.
Russia is at the top of the ranking for the second year in a row. Since last year, the level of risk for Russian users has increased from 55.9% to 58.6%. Unfortunately, the Russian segment of the Internet is home to numerous cybercriminal schemes. In 2012, cybercriminals took advantage of the growing popularity of online banking among individual users and entrepreneurs and actively spread malware targeting these systems. Another common scam in the Russian part of the Internet is making money on premium SMS messages: fraudsters ask users to pay for goods/services by sending a message to a premium number, but fail to provide the goods/services promised.
Tajikistan has moved up from 17th to second place in the ranking with 58.5%. Azerbaijan has moved from sixth place to third with 57.1% of users being subjected to attacks.
The bottom three positions in the Top 20 for 2012 are occupied by Italy, the US and Spain, respectively.
The United States, which was in third place in 2011, has fallen to 19th place: the proportion of users who were attacked has gone down from 50.1% to 45.1%. This is due to successful efforts to combat cybercrime, as well as to several large botnets having been taken down, including DNSChanger, Hlux and several ZeuS (Zbot) zombie networks.
Italy and Spain are newcomers to the Top 20 based on the proportion of users attacked while surfing the web. The number of incidents per user has increased in these countries throughout the year, primarily due to banking Trojan attacks.
All countries can be assigned to one of the following categories based on their online risk level:
- High risk
This group includes 31 countries with results in the range of 41-60%. In addition to the top 20 countries, Australia (44.4%), Indonesia (44.2%), Canada (42.8%), Georgia (42.3%) and the UK (41.1%) were in the high-risk group in 2012. - Moderate risk
This group includes 110 countries with risk levels ranging from 21% to 40.9%, including Turkey (39.9%), France (39.8%), Chile (39.4%), China (38.4%), Poland (37.1%), Lithuania (35.3%), Sweden (34.1%), Austria (34%), Ecuador (33.3%), Germany (31.8%), Finland(27.9%), Norway (27.3%), Japan (22.8), and Denmark (21.6%). - Low risk (0-20.9%)
In 2012, this group included 10 countries: Gabon (20.6%), Togo (20.5%), Reunion (20.2%), Niger (19.6%), Mauritius (18%), Guadeloupe (17.8%), Martinique (17.7%), Benin (17.2%), Burundi (16.9%) and Congo (16.7%).
The first group has grown to include eight new members. Most countries in the group are post-Soviet and Asian states. Sadly, the number of European countries in this group has also grown.
All the European countries have left the low-risk group, which now comprises African countries only. It is worth noting that the countries that moved to the low-risk group based on the risk while surfing the web still find themselves in maximum or high risk groups based on infection rates. The reason they are in the low-risk surfing group is that the Internet is not sufficiently well developed in these countries and people commonly use removable media to exchange files. As a result, web threats rarely show on our radars in those countries, while viruses and worms, which propagate via USB sticks and infected files, pose a threat to which an enormous number of users are exposed.
The average global Internet threat level has grown for two years in a row and reached 34.7% in 2012 -2.4% more than in 2011. Worldwide, one Internet user in three has been a target of a computer attack at least once during the year.
Local threats
In addition to web infections, another point of interest is data concerning the detection of malware on user machines or on removable media connected to computers — USB flash drives, camera and phone memory cards, external hard drives. Essentially, these statistics reflect the level of personal computer infections in different countries of the world.
| Rank | Country | %* |
| 1 | Bangladesh | 99.7 |
| 2 | Sudan | 88.2 |
| 3 | Malawi | 78.0 |
| 4 | Tanzania | 77.4 |
| 5 | Rwanda | 76.5 |
| 6 | Afghanistan | 75.6 |
| 7 | India | 75.2 |
| 8 | Laos | 73.3 |
| 9 | Nepal | 72.9 |
| 10 | Angola | 72.0 |
| 11 | Vietnam | 70.4 |
| 12 | Mauritania | 69.8 |
| 13 | Iraq | 69.6 |
| 14 | Maldives | 69.2 |
| 15 | Uganda | 69.0 |
| 16 | Sri Lanka | 68.5 |
| 17 | Mongolia | 68.0 |
| 18 | Djibouti | 67.4 |
| 19 | Mali | 67.3 |
| 20 | Cote D’Ivoire | 67.0 |
These statistics are based on the detection verdicts returned by the antivirus module, received from users of Kaspersky Lab products who have consented to provide their statistical data. We excluded those countries in which the number of Kaspersky Lab product users is relatively small (less than 10,000).
* Unique users whose computers have been targeted by local attacks as a percentage of all unique users of Kaspersky Lab products in the country.
The Top 20 for 2012 is made up of African and Asian countries. Since last year’s ranking, the situation in the top-ranking countries has not improved. As was the case in 2011, every nine computers out of 10 in Sudan and Bangladesh faced malware infections at least once during the year. On top of that, the lack of any antivirus security culture and highly limited knowledge of threats potentially targeting their machines make computers in these countries vulnerable to malware.
Countries can also be divided into categories in terms of local threats.
- Maximum risk (over 75%): seven countries in Asia and Africa, including India (75.2%) and Bangladesh (99.7%), which were also present in the online high-risk group.
- High risk (56-74.9%): 41 countries across the globe, including Indonesia (64.7%), Ethiopia (58.2%) and Kenya (58%).
- Moderate risk (35-55.9%): 67 countries, including China (52.7%), Kazakhstan (52.6%), Russia (48.7%), Turkey (48.67%), Brazil (43.5%), South Korea (39.8%), Spain (39.8%), Portugal (35.8%) and Lithuania (35.7%).
- Low risk (0-34.9%): 38 countries of the world, including the United States (33.3%), France (32.8%), the UK (30.9%), Latvia (31.4%) and Belgium (27.2%). Last year this group contained just 14 countries; the 2012 figure is almost three times that number. The changes are largely due to the gradual extinction of old-school viruses and autorun worms.
Top 10 countries with the lowest computer infection rates:
Rank Country* % 1 Denmark 15.0 2 Japan 19.5 3 Finland 19.8 4 Sweden 22.9 5 Czech Republic 23.5 6 Netherlands 23.9 7 Norway 24.0 8 Luxembourg 24.2 9 Germany 24.3 10 Switzerland 24.4 On average, 25.4% of user machines were attacked in the low risk group of countries. This is 4 percentage points less than last year.
Conclusion
2012 was the year when cybercriminals became more actively interested in new platforms, primarily Mac OS X and Android OS. Since cybercriminals always like the chance to infect a large number of computers and devices without too much hassle, the number of attacks on Mac and Android users is growing.
In early 2012, a botnet comprising over 700,000 Mac computers was discovered. The botnet had been created using the Flashfake malware. Attackers were able to install any additional malicious modules they wanted on infected machines. It is known that one module was responsible for spoofing search engine results. However, the story of malware targeting Macs is not about mass attacks only. Throughout the year, we detected targeted attacks using backdoors that targeted Mac OS X users. This is shown in our numbers: in 2012, the number of antivirus records for malware targeting Mac OS X grew by 30% compared to 2011.
The epidemic of Mac Trojans and the endless stream of Android malware added a new dimension to the issue of protecting new platforms. The need for such protection became obvious to most of the planet’s Internet population. Myths about Mac computers’ supposed invulnerability to malware were shattered. Vendors began to pay more attention to protecting their platforms: a new version of Mac OS X included a number of features which improved security; Google in turn began scanning applications added to its app store. The antivirus industry has responded to this turn of events and has begun offering solutions such as Kaspersky One, which protects the entire spectrum of devices – from PCs and Macs to smartphones and tablets.
Unfortunately, despite the achievements in combating cybercrime, the proportion of users attacked online continued to grow in 2012, reaching 34%. Not a single European country made it into the low risk group where less than 20% of users were attacked while online.
While we called 2011 the year of the vulnerability, 2012 can be specifically called the year of the Java vulnerability. According to our statistics, in 2012 half of all attacks involving exploits took advantage of Java vulnerabilities. Importantly, cybercriminals exploited vulnerabilities both in mass and in targeted attacks, with exploits targeting both PCs and Macs.
Table of Contents
- Mobile malware
- Malware for Android
- Rise in the number of malicious programs in official app stores
- The first mobile botnets
- Targeted attacks using mobile malware
- Mobile espionage
- Malware for Mac
- Malicious programs on the Internet (attacks via the web)
- Vulnerable applications targeted by malicious users
- TOP 20 malicious programs on the Internet
- TOP 20 countries where web resources are seeded with malware
- Local threats
- The big picture
- Conclusion
From the same authors


In the same category


Kaspersky Security Bulletin 2012. The overall statistics for 2012