
This report covers the most significant malware related events of the past year and provides an overview of the evolution of the illegal market for malware, as well as examining the current situation. It includes statistical data.
This report is primarily aimed at IT security professionals but may also be helpful to users who have an interest in malicious programs.
- Malware evolution
- Malware for Unix-type system
- Mobile malware
- Internet attacks
- Spam in 2006
Malicious code continued to evolve throughout 2006, demonstrating trends which had been previously noted: Trojan programs significantly outnumbered worms, and the number of new malicious programs targeting users’ e-funds increased.
The total number of new malicious programs was up 41% from 2005.
The most interesting trends in 2006 were the steady increase in the number of Trojan spy programs designed to steal user data from players in online games, and the continued evolution of Trojans which encrypt user data – these started using professional encryption algorithms. Also worth mentioning is the large number of new vulnerabilities identified in Microsoft Office, which caused virus writers to release new malicious programs to exploit the loopholes.
Other important events of 2006 included the first “real” viruses and worms for the MacOS operating system and Trojans for the J2ME mobile platform; the latter were designed to steal money from mobile user accounts. There were a number of interesting innovations – both theoretical and practical – in rootkit and anti-rootkit technologies. For example, the proof of concept rootkit SubVirt, created using Microsoft resources, and Joanna Rutkowska’s BluePill.
Equally interesting was virus writers’ decision to return to their roots; this was demonstrated by the latest turn of the screw in the evolution of polymorphic technologies, which were used not only in file viruses but in script viruses as well. .
The authors of malicious programs started using nonstandard infection vectors more actively: instant messaging (IM) applications such as ICQ, AOL and MSN became a serious security risk. Of course, this is directly connected to the large number of vulnerabilities in popular web browsers, primarily Internet Explorer.
Overall, it was a fairly interesting year from a technical point of view. Happily, there was no major global epidemic that could be compared to the epidemics in 2005, such as that caused by Mytob. On the other hand, global epidemics were replaced by local ones that appeared to be highly organized, hitting specific geographical locations (e.g. China and Russia), and by epidemics that lasted for an extremely short period of time.
All of these events are covered in more detail in our 2006 quarterly reports; this report provides additional statistical information.
Major virus epidemics in 2006
A total of 7 major virus epidemics were recorded in 2006, half the number recorded for the previous year (14).
The epidemics of 2006 can be divided into four groups: the Nyxem.e worm, the Bagle and Warezov worms, and several variants of Gpcode, a Trojan which encrypts user data.
At the end of January 2006, a new variant of Nyxem, an email worm, was mass mailed. This variant was interesting due to the fact that the worm was programmed in such a way as to cause infected machines to visit a specific site with a hit counter. The hit counter recorded hundreds of thousands of hits on the site in the space of a few days, which gave antivirus companies proof of a major epidemic. Additional analysis showed that most of the infected computers were located in India and in South American countries (especially Peru).
The worm’s malicious payload was to delete all user files, documents and archives on the third of every month. As Nyxem.e had managed to infect over a million computers by February 3rd, 2006, details of the worm were widely publicized in the media in order to inform computer users of the threat. This helped prevent massive data loss – users were aware that they should be on the lookout for signs of infection, and, if necessary, clean their machines. The result: on February 3rd itself, only a small number of hits were recorded on the website.
However, Nyxem.e did not disappear and continued to make up a relatively high proportion of all malicious code in mail traffic throughout 2006. The second peak of activity was recorded in August and September. Overall, Nyxem.e was the fifth most common malicious program in mail traffic in 2006.
In addition to Nyxem.e, January 2006 was also the first appearance of a Trojan which used a professional cryptographic algorithm to encrypt user data appeared. Gpcode.ac used an RSA 56-bit key. The Trojan encrypts user files, and then displays a message demanding money; once the money is received by the cyber criminal, the user’s data will be decrypted.
This malicious program became widespread on the Russian Internet as it was mass mailed. Despite many warnings not to open attachments from unknown senders, a large number of users nevertheless fell victim to this malicious program. Kaspersky Lab promptly released a decryption routine.
In early 2006 three more variants of Gpcode were distributed; each subsequent version used a longer encryption key, making it more difficult for analysts to crack the encryption.
Gpcode.ae used a 260-bit key and Gpcode.af a 330-bit key. Decrypting the different keys used in modifications of Gpcode.af (330-bit) required the very latest technologies and ten intense hours of work for Kaspersky Lab virus analysts. But then yet another new variant, Gpcode.ag, appeared, and this variants used a 660-bit key. This was also dispatched by Kaspersky Lab analysts, and since then there have been no sightings of any new Gpcode variants.
Since 2004 we have been tracking the evolution of Bagle, a family of highly malicious email worms. Programs from this family have evolved from simple worms to multi-component malicious programs with proxy-server, downloader, and spy functionality and a variety of propagation routines. Bagle had a peak of activity in 2005, but in 2006 the worm’s authors became much less active. However, that did not keep them from initiating two relatively serious epidemics in February and June. After each epidemic, there was a major increase in spam; computers infected by Bagle were being used as Trojan proxy servers.
A very similar tactic (short-lived, localized mass mailings) was later used by the unknown authors of the Warezov worm. However, the worm’s functionality is very similar to that of Bagle and Warezov is designed to enable cyber criminals to use infected computers to send spam. Between September and the end of 2006, more than 300 variants of this worm were detected; on some days the Kaspersky Virus Lab logged more than 20 new modifications, each of which was spreading via email. Despite its versatility, none of the Warezov variants made it into the top ten malicious programs in mail traffic. Nevertheless, Warezov is one of the most rapidly-evolving and most dangerous families of malicious programs on today’s Internet.
| Position | Name | Change in position in 2006 |
| 1 | Net-Worm.Win32.Mytob.c | 0 |
| 2 | Email-Worm.Win32.LovGate.w | +4 |
| 3 | Email-Worm.Win32.NetSky.b | +2 |
| 4 | Email-Worm.Win32.NetSky.t | New |
| 5 | Email-Worm.Win32.Nyxem.e | New |
| 6 | Email-Worm.Win32.NetSky.q | -4 |
| 7 | Net-Worm.Win32.Mytob.u | +2 |
| 8 | Net-Worm.Win32.Mytob.t | +7 |
| 9 | Net-Worm.Win32.Mytob.q | -1 |
| 10 | Email-Worm.Win32.Scano.gen | New |
Top 10 most widespread malicious programs in email traffic in 2006
Types of malicious program in 2006
Kaspersky Lab’s classification system divides malicious programs into three classes:
- TrojWare: this class includes a range of malicious programs which cannot replicate independently (backdoors, rootkits and all types of Trojan);
- VirWare: self-replicating malicious programs (viruses and worms);
- MalWare: programs which are used by malicious users to create malicious programs and organize attacks.
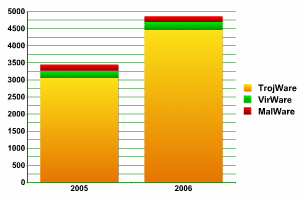
Average number of new malicious programs per month.
The share of new families and variants of malicious programs is illustrated in the pie chart below:
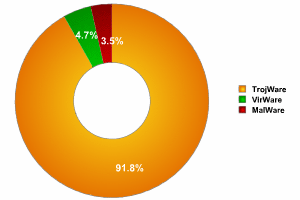
Breakdown of malicious programs by category at the close of 2006
| Class | Percentage | Change by year-end |
| TrojWare | 91.79% | +2.79% |
| VirWare | 4.70% | -1.3% |
| MalWare | 3.51% | -1.49% |
Change in percentages per class of malicious program by year-end
Various Trojans clearly represent the lion’s share of malicious programs, as they have over the past few years. The 2.79% increase from 2005 is considerably less than the 8.76% increase from 2004. It is relatively easy to create this class of malware (in comparison to creating worms and viruses) and use them to steal information, create botnets and conduct spam mailings. This is why the number of Trojans on the Internet continues to grow. This is confirmed by the large share of Trojans (90%) among new malicious programs.
The number of worms and viruses (VirWare) fell, but not quite as dramatically as during 2005 (-6.53%). However, this can be easily explained by the fact that VirWare itself accounts for an extremely small proportion of malicious programs overall. In the near future, the number of VirWare programs will either continue to fall or will reach a state of equilibrium. Worms and viruses are not going to disappear, and they may well increase a certain amount in 2007 – whether or not that happens will depend directly on new critical vulnerabilities being identified in Windows, and in particular in Vista.
As for the MalWare class is concerned, this is the smallest class of malicious programs. It contains programs with a wide range of behaviors, the most interesting of which are exploits. The most significant event in 2006 in this category was the appearance of a large number of exploits for MS Office. In 2007 we anticipate an increased number of this type of threat. Once again, this depends on the situation with Windows Vista and the new MS Office 2007 package.
The changes in each class will be examined in more detail below.
Trojan programs
The graph below illustrates the number of new programs in the TrojWare class detected by Kaspersky Lab analysts each month:
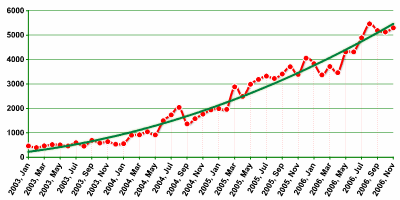
Number of new TrojWare programs detected by Kaspersky Lab analysts each month.
Even a quick look at the graph will reveal the continued steady increase in Trojan programs. The volume of such programs represents an ever increasing threat, as the majority of them are Trojans designed to cause financial damage.
The amount of Trojans is already so large that even the technical growth in the number of new Trojans (+46%, compared to +124% in 2005) does not mean we can expect cyber criminal activity to start dying down. Each month there are thousands of new Trojans, and each month we see an increased range of Trojan behaviors.
The pie chart below shows a breakdown of Trojan behaviors:
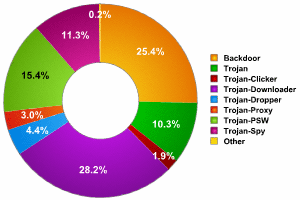
TrojWare: breakdown of behaviours within the class
The numbers below provide a clearer view of the changes in this particular class:
| Behavior | Change by year-end |
| Backdoor | +29% |
| Trojan | +11% |
| Trojan-Clicker | +3% |
| Trojan-Downloader | +93% |
| Trojan-Dropper | -15% |
| Trojan-Proxy | +58% |
| Trojan-PSW | +125% |
| Trojan-Spy | +27% |
| TrojWare | +46% |
Change in number of new TrojWare programs by year-end
Trojan-Droppers were the only behaviour which decreased in number from 2005. This is not a big surprise if you factor in the 212% growth that this class saw in 2005 – Trojan droppers are among the most common of all malicious programs. It’s tough to maintain such a strong growth rate and the 15% decline does not mean that Trojan dropper programs have become less of a threat.
The leaders of 2006 were Trojan-Downloader programs and Trojan-PSW programs, which increased by 93% and 125%, respectively.
These high figures aren’t unusual for Trojan-Downloader programs (which saw 270% growth in 2005). This is the most widespread behavior, and malicious users are highly invested in such programs as they are a universal way of delivering malicious code to victim machines. Trojan-Downloader programs can, as their name suggests, download other malicious programs to a system, which provides the Trojan author with a wide range of opportunities to utilize an infected system.
Trojan-PSW programs are the only behavior which has gained on 2005. This behaviour was up 125% in 2006 after a 122% increase the previous year. Most Trojan-PSW programs are so-called gaming Trojans which are used to steal user account details for popular online games. Online games are currently enjoying a boom in popularity, particularly games such as World of Warcraft, Lineage and Legend of Mir, with millions of people participating. These games are particularly popular in Asian countries. Often, the cost of an in-game character or various items used in these games can reach tens of thousands of dollars. Cyber criminals steal account access and virtual goods for subsequent sale on Internet auction sites.
Gaming Trojans turned out to be one of the top threats in 2006, and their evolutionary patterns show that in the near future, they are likely to be one of the most rapidly increasing behaviors among all malicious programs. In 2007 the appearance of several new online games is expected, which will of course attract millions of new virtual gamers, and in turn, cyber criminals.
In addition to the two behaviors mentioned above, the dynamic shown by Trojan-Proxy programs is worth looking at more closely. In 2005 this category increased 68%, and in 2006 the behavior climbed another 58%. Such Trojan programs continue to be popular because they can be used to send spam via infected computers. Unfortunately, despite active measures being taken against spam at both the legislative and technical level, the volume of spam continues to grow. By the end of 2006, spam accounted for approximately 80% of all email traffic. There seems to be a distinct correlation between the number of new Trojan-Proxy programs and the increase in spam. If the growth rate of this type of Trojan slows down in 2007, we should also see a decline in the volume of spam on the Internet.
Rootkits, which are also classified as TrojWare, are also worthy of attention. They were not included as a separate class in the table showing Trojan behaviors because they are currently relatively few in number (they are even outnumbered by Trojan-Clicker programs). However they are often used to hide a range of Trojan programs and one and the same rootkit can be used by several malicious users at once. In 2005 (when we began to classify rootkits as a separate behavior) they skyrocketed and demonstrated an unprecedented 415% growth rate over the course of the year. At that time, rootkits were one of the hottest topics in the antivirus industry, and virus writers were working actively in the field. After such enormous growth, a certain slowdown was expected; however they have remained at a relatively high level, with growth in 2006 closing at 74%. This proves that rootkits are still a major threat. We are waiting to see just what happens with rootkits when Windows Vista is released, since Microsoft developers have claimed that rootkits will simply not be able to function in this operating system.
One of the largest subgroups in the Trojan-Spy category, which saw a 27% increase over 2006, is so-called banking Trojans. These programs that designed to steal information used to access various online payment systems and e-banking systems, in addition to being a tool used in credit card fraud. This is one of the most predominant types of cybercrime. In 2006, this category continued to grow, and the number of new Bankers nearly doubled (+97%). The growth rate among these types of Trojans was not curbed by measures introduced by banks to protect users from this threat or by the significant increase in phishing attacks used to steal personal information. Access to a user’s account, the ability to manage an account via the Internet and using the Internet as a venue for making purchases is attracting more and more users, which means that in 2007 a major share of Trojans will designed with the aim of stealing personal data.
Worms and viruses
The chart below shows the number of new VirWare programs detected by Kaspersky Lab analysts each month:
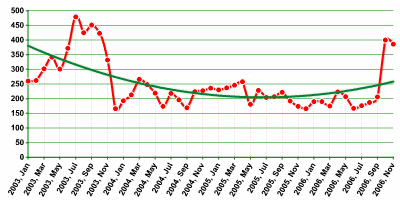
of new VirWare programs detected by Kaspersky Lab analysts each month.
The chart shows that this class remained relatively stable over the course of two years (2004 – 2005). But in 2006, this changed and the number of programs classified as VirWare began to rise, with momentum growing even more in the second half of the year. This was due to the fact that in the last six months of the year, virus writers began more actively to use certain tactics to organize a large number of short-lived virus epidemics. This was most clearly demonstrated by the authors of the Warezov family of worms. On certain days we detected over two dozen new variants of this worm that differed very little from each other. Each variant was sent to a different geographical destination (some of the worms were mass mailed throughout Russia, others were sent to Germany, etc.). The appearance of numerous variants over the course of a short period made Warezov the fastest growing family of all malicious programs in 2006.
In addition to Warezov, the Asian worm Viking also had a tremendous influence on the VirWare category. Viking was spread actively in China, for example, and was also distinguished by the large number of variants. This spurred an 8% increase in the number of new VirWare programs, up from 2005, during which the number of this type of malicious programs fell by 2%.
Just like in 2005, although this class of malicious programs maintained relative stability, it nonetheless increased overall due to the prevalence of two specific behaviors: Email-Worm and Worm.
The pie chart below shows a breakdown of different subgroups in the VirWare category:
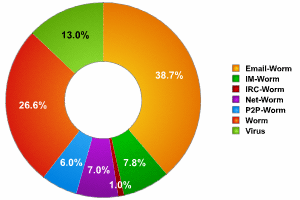
Breakdown of behaviors in the VirWare class.
In 2006 Email-Worm and Worm were the most consistent behaviors (showing changes of +2 and -3, respectively) of all malicious programs in this class. We can assume that these behaviors will act as the driving force behind in this class in 2007.
| Behavior | Change by year-end |
| Email-Worm | +43% |
| IM-Worm | -45% |
| IRC-Worm | -63% |
| Net-Worm | -55% |
| P2P-Worm | -5% |
| Worm | +221% |
| Virus | -29% |
| VirWare | +8% |
Changes in the number of new VirWare programs over 2006
As noted above, the highest growth among malicious programs in this category in 2006 was achieved by Email-Worm.Win32.Warezov and Worm.Win32.Viking.
Readers should note the significant reduction in the number of new Net-Worm programs. This is the most dangerous and fastest-spreading type of worm, which has seen a burst of activity in the past few years. Major epidemics have been triggered by malicious programs with this behavior, such as Lovesan (2003), Sasser (2004) and Mytob (2005). In 2005 this behavior saw a 43% increase. Thankfully, the situation turned around in 2006 (down 55% from 2005), due primarily to the fact that a relatively small number of critical vulnerabilities were found in Windows-based applications, and old vulnerabilities had already, for the most part, been patched. Additionally, firewalls became a regular part of computer security, just like antivirus software. Internet providers also played a part by installing filtration systems and hardware appliances which stopped epidemics before they reached end users.
More than likely, this falling trend among Net-Worm programs will continue in 2007 and the very existence of Net-Worm programs will depend on whether or not this propagation method can be combined with other infection vectors (email, network resources, IM-worms etc.).
Interestingly enough, IM-worms did not gain a very strong foothold. In 2005 virus writers started to spend more time developing this type of malware, although the first of these worms appeared in 2001. By the end of 2005, 32 new IM-worms were being detected per month. In early 2006, the IM-worm dynamic hit a plateau before a steady drop in the number of this type of program. Once again, we can thank IM services such as AOL and MSN for the measures they took to combat this type of threat. They introduced several filters and restrictions in their programs which made it considerably more difficult for the authors of IM-worms to use IM as an infection vector. The result was a 45% drop in the number of new IM-worms and we expect this trend to continue in 2007 to the point where IM-worms may almost become almost completely extinct.
Classic file viruses continue to fall in number, but that doesn’t mean that virus writers lost interest in file infecting technologies. On the contrary, this method is being used with increasing frequency, and is being resurrected by virus writers in combination with other propagation methods. One example is Worm.Win32.Viking, which can be used to infect files. Furthermore, viruses are becoming more and more complex, and they are more and more often making use of polymorphic code, which has always created headaches for antivirus companies. Overall, although this behaviour did experience a decline, the decline slowed in 2006: just 29% in 2006 (compared with -45% in 2005 and -54% in 2004).
Other worm and virus behaviors are not very widespread and thus do not pose much of an interest, as they represent an increasingly smaller share of the total VirWare category.
Other malicious programs
The MalWare class is the least widespread of all malicious programs. However, this class does contain the largest number of individual behaviors.
Based on year-end figures, this share of this class represented in the total number of malicious programs (see Table 1) not only fell, but the movement in the number of new programs in this category is on average lower than the growth rate in the two other categories.
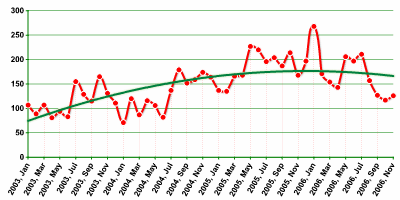
Number of new MalWare programs detected by Kaspersky Lab analysts every month.
The sluggish growth in the number of new malicious programs in this class observed in 2004 – 2005 (13% and 43%, respectively) plummeted to 7% in 2006, which prevents us from tracing any clear trends in this category’s dynamics. But considering the overall drop in the share of software used in this category in the total number of malicious programs (down to 3.5%), we can speculate that virus writers are losing interest in this type of program.
The pie chart below shows a breakdown of the different behaviors represented in the MalWare class:
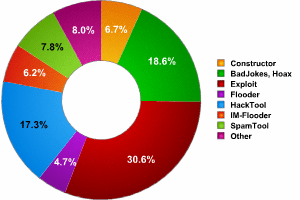
Breakdown of behaviors in the MalWare category.
Of all of the different kinds of behaviors that fall into this category, only seven deserve any real attention. Malicious programs that exhibit other behaviors are fairly rare, and they are consequently not really evolving. The seven main behaviors are listed in the table below:
| Behavior | Change by year-end |
| Constructor | -18% |
| BadJokes, Hoax | +167% |
| Exploit | -21% |
| Flooder | -34% |
| HackTool | -21% |
| IM-Flooder | +40% |
| SpamTool | +107% |
| Other | -64% |
| Other MalWare | -7% |
Change in the number of new programs classified as MalWare by year-end
Exploits represent the largest subgroup within this class. The number of exploits fell in 2006 due to a relatively small number of vulnerabilities which could be exploited by malicious users. The vulnerabilities that caused the most trouble in 2006 were flaws in MS Office. Malicious programs that took advantage of these flaws were classified by Kaspersky Lab experts as Trojans, not exploits.
As in many cases examined above, the forecast for this category in 2007 directly depends on what exploits are found in Windows Vista and MS Office 2007. It is possible that numerous critical vulnerabilities will be disclosed, and if this proves to be the case, the current fall in the number of exploits (-21%) will surely transform into a steady increase.
Growth of the once exotic IM-Flooder is of particular interest. These types of programs are used to spam IM programs such as ICQ, AOL and MSN. The 40% growth recorded in 2006 is due to the popularity of this type of spam, especially since there are no appropriate filters for IM applications yet which could provide the same level of protection as email antispam systems.
Programs classified as SpamTool are designed to harvest email addresses on infected computers and send these addresses to malicious users for subsequent use in spam mailings. In 2005 we saw a minimal but stable interest in this behavior. In 2006 it skyrocketed (+107%). However towards the end of the year the number began to fall. This was primarily because the authors of other Trojans and worms, particularly Email-Worm.Win32.Warezov, started to implement email harvesting routines in their creations.
2006 was a failure for MalWare as a class. Over the year, the popularity of MalWare fell steadily while TrojWare gained in popularity.
Related trends
RansomWare
One of the most dangerous trends noted in 2006 was the increased number of incidents where programs were used to modify or encrypt data on a victim machine. The remote malicious user then asks for payment in exchange for restoring the data. These programs are all very similar and either prevent the computer from working normally or block access to particular data.
In January 2006 these types of programs were represented by just one Trojan – Trojan.Win32.Krotten. The authors of Krotten sent out regular modifications of this Trojan every two weeks, constantly modifying the code in an effort to keep Krotten from being detected.
This burst of activity coincided with the appearance of an entire series of similar Trojans, the most noteworthy of which was Gpcode. In just six months, Gpcode had progressed in leaps and bounds: from used standard symmetrical encryption algorithms to asymmetric encryption algorithms, with the key growing ever longer – from 56 bits to 64, 260, 330 and finally 660 bits.
Further details of this malicious program can be found at https://securelist.com/blackmailer-the-story-of-gpcode/36089/.
During the first six months of 2006, the number of Trojan families used as RansomWare managed to grow from two to six (Krotten, Daideneg, Schoolboys, Cryzip, MayArchive and Gpcode). In the beginning of the year virus writers were just beginning to develop these types of programs and geographically, they were limited to mostly Russia and the CIS countries. But by mid-year, they had expanded considerably, with RansomWare sightings in Germany, Great Britain and a number of other countries.
AdWare
AdWare is another major MalWare subgroup. These are programs that deal in various forms of advertising on the Internet. AdWare fell 29% in 2006. As an earlier article (https://securelist.com/malware-evolution-april-june-2005/36052/) states, the boundaries of behavior in this subgroup are becoming blurred, and it is not always easy to definitively identify a program as malicious. This is further confirmed by the fact that AdWare programs using virus technologies are becoming more and more common. AdWare’s growth rate began to slow down considerably back in 2005 by 63%), and we predicted that AdWare numbers would continue to drop. That’s just what happened, mostly because this type of business was declared illegal by many countries and many AdWare manufacturers were called to account for their actions or they changed the code in their program in such a way so that antivirus companies eventually dropped claims regarding these programs.
More than likely, the volume of AdWare will decrease even further in 2007.
Antivirus databases
Kaspersky Lab has shortened its response time to the growing number and increasing speed of new threats by releasing an increased number of antivirus database updates.
The number of new records in Kaspersky Lab’s antivirus database each month in 2006 varied from approximately 5,000 to tens of thousands towards the end of the year. The average monthly number of new records amounts to 7,240 (not counting records in the extended databases). The average monthly number of new records was 4,496 in 2005.
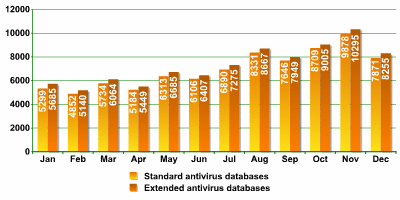
Number of new antivirus database records (yellow indicates standard databases; red indicates extended databases)
As the chart above shows, the number of monthly records in the antivirus databases increased irregularly over the course of the year. Each month with an increase was followed by a decrease. However by the end of the year there was steady growth that led to a record high of over 10,000 new records per month.
Kaspersky Lab responds to the appearance of new malicious programs by releasing two types of antivirus database updates: standard updates (about once an hour) and urgent updates (in the event of an epidemic).
The total number of standard database updates in 2006 exceeded 7,000, with a monthly average of 600.
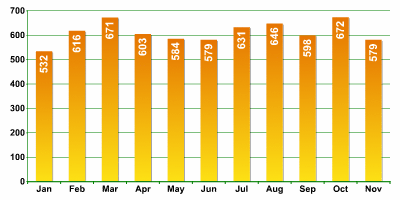
Number of standard updates per month
As far as urgent updates are concerned, the data shown in the charts is particularly interesting for two reasons. First of all, they show the total number of “epidemiological” situations in 2006 and provide the opportunity to compare this information with figures from 2005. In addition, they can help us track and predict when epidemics are likely to occur.
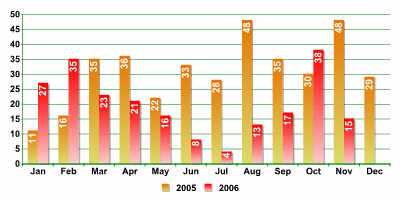
Number of urgent updates per month
These numbers show that events linked to the release of urgent updates were almost 30% fewer in 2006 than in 2005. In 2005 we saw an average of over 30 urgent updates per month, but in 2006 the monthly average was under 20.
These figures show that virus writers were particularly active twice in 2006: in February-April and again in October-December. The charts clearly show the traditional summer slow period in June and July.
Forecast
In light of all of the trends and events described above, we expect that in 2007 virus writers will continue to concentrate their efforts on various types of Trojans used to steal personal information. Attacks will largely be focused on the users of various banking and payment systems in addition to online gamers.
Virus writers and spammers will continue to pool their efforts; this symbiotic relationship will lead to the use of infected computers both for organizing epidemics and attacks, and for sending spam.
Browser vulnerabilities and email will remain the primary infection vectors. The use of direct port attacks will be less widespread and will fully depend on critical vulnerabilities being discovered in Windows services. P2P networks or IRC channels will not be widely used to infect machines, but they will be to some extent, especially locally (for example, the P2P client Winny, which is very popular in Japan, could become a serious threat to Asian users in 2007). IM systems will remain in the top three most actively used mean of attack, even though we do not expect to see any significant increase in malicious use.
Overall, epidemics and virus attacks will become defined in terms of geographical boundaries. For example, in-game Trojans and worms with virus functionality are typically seen in Asia, while Europe and the US tend to see Trojan spy programs and backdoors. South America is usually hit by a wide range of banking Trojans.
Without a doubt, the most important underlying theme of 2007 will be the new Microsoft Vista operating system and its vulnerabilities. Vista’s vulnerabilities and limitations will determine the development of the virus industry in the years to come. We do not expect to see any fast-moving or major changes, although this new OS will definitely define the trends in the year to come.
Malicious programs will continue to become more technically sophisticated and use methods to conceal their presence in infected systems. Polymorphic code, code obfuscation and rootkit technologies will be even more widespread and their use will become standard in most new malicious programs.
We can expect to see considerable growth in malicious programs for other operating systems, first and foremost for MacOS and *nix systems. Virus writers will also focus some efforts on gaming consoles like PlayStation and Nintendo. The increasing number of these types of devices and the opportunities to use them to interact online could attract the attention of virus writers, although most likely exclusively for “research” purposes only. It could happen that viruses for “non-computers” in 2007 will breakthrough and transition into a phase of major development, although the chances are low, and developments will probably be limited to a large amount of proof of concept malware.
The number of targeted attacks aimed at medium-sized and large businesses will increase. In addition to traditional data theft, these attacks will be aimed at extorting money from the victim organizations, and will use encryption (i.e. RansomWare). One of the main infection vectors will be MS Office files and vulnerabilities in this suite of applications.


Kaspersky Security Bulletin 2006: Malware Evolution