

Authors
- Kaspersky Security Bulletin. Malware Evolution 2010
- Statistics, 2010
- Kaspersky Security Bulletin. Spam Evolution 2010
About this report
This section of the report forms part of Kaspersky Security Bulletin 2010 and is based on data obtained and processed using the Kaspersky Security Network (KSN). KSN integrates cloud-based technologies into personal and corporate products and is one of Kaspersky Lab’s most important innovations.
KSN assists Kaspersky Lab’s experts to swiftly detect new malware in real-time, when no corresponding signature or heuristic detection exists for these threats. KSN helps identify sources of malware proliferation on the Internet and blocks user access to them.
Due to KSN’s very rapid response to new threats – i.e. in real-time – we are able to block new programs from launching on users’ computers within seconds of them being found to be malicious, and without having to update the antivirus database first.
The statistics in this report are based on data obtained from Kaspersky Lab products installed on users’ computers worldwide and was acquired with the full consent of the users involved.
Malicious programs on the Internet (attacks via the web)
Since we published our last report, the situation with attacks launched using Internet browsers has become considerably worse. In 2007, a total of 23,680,646 attacks were recorded against KSN users. In 2009, that number rose to 73,619,767 — however, in 2010, it skyrocketed to 580,371,937!
This surge in the number of incidents is linked to the emergence of many new exploits designed to launch drive-by download attacks. Eleonore and Neosploit are particularly noteworthy — they are primarily used by the cybercriminals to spread malware via Pay-Per-Install (PPI) partner programs.
Furthermore, we must not forget about self-proliferating web infections such as Gumblar and Pegel. These systems use passwords stolen by malicious users to access web resources capable of automatically infecting websites. With their constant expansion via the addition of more and more new zombie machines, botnets are one of the most complex problems currently facing the world of information security; the first step in the spreading of bots involves legitimate websites that have been hacked, with botnet growth a relatively steady process.
Internet attacks via web browsers became the primary means of spreading malicious software among users’ computers in 2010, and we expect this trend to continue for the time being. Vulnerabilities, primarily in Internet Explorer and the programs that work with browsers such as Adobe Flash Player or PDF Reader, are discovered almost monthly. Once found, malicious users quickly take advantage of each vulnerability.
In 2010, Kaspersky Lab added new, expanded algorithms to KSN to detect potential threats to websites and online applications. In combination with the phishing site detection system, these technologies allow us to detect over 60% of web attacks in the early stages, all without using traditional signature-based detection methods or antivirus database updates installed on users’ computers.
Malicious programs on the Internet: the Top 20
Of all of the malicious programs involved in Internet attacks against users, we have identified the twenty most active. We have recorded each of these twenty threats over one million times, and they account for approximately 80% (461,046,555) of all recorded incidents.
| Ranking | Name | Number of unique attacks* | % of all attacks |
| 1 | Blocked | 347,848,449 | 59.94% |
| 2 | Trojan.Script.Iframer | 37,436,009 | 6.45% |
| 3 | Trojan.Script.Generic | 19,601,498 | 3.38% |
| 4 | Trojan-Downloader.Script.Generic | 13,887,220 | 2.39% |
| 5 | Trojan.Win32.Generic | 9,515,072 | 1.64% |
| 6 | Exploit.Script.Generic | 9,118,706 | 1.57% |
| 7 | Exploit.JS.Agent.bab | 3,161,815 | 0.54% |
| 8 | AdWare.Win32.Shopper.l | 2,620,672 | 0.45% |
| 9 | Trojan-Clicker.JS.Iframe.bb | 2,320,419 | 0.40% |
| 10 | Trojan-Dropper.JS.Hexzone.bu | 2,125,007 | 0.37% |
| 11 | Trojan.JS.Agent.bhr | 2,014,679 | 0.35% |
| 12 | Trojan.Win32.StartPage | 1,610,123 | 0.28% |
| 13 | Trojan.HTML.Fraud.bl | 1,547,961 | 0.27% |
| 14 | AdWare.Win32.FunWeb.q | 1,463,179 | 0.25% |
| 15 | Trojan-Spy.Win32.Agent.bdpj | 1,290,311 | 0.22% |
| 16 | Exploit.Java.CVE-2010-0886.a | 1,246,382 | 0.21% |
| 17 | Trojan.JS.Iframe.fe | 1,109,354 | 0.19% |
| 18 | Trojan-Downloader.Win32.Generic | 1,071,929 | 0.18% |
| 19 | AdWare.Win32.HotBar.dh | 1,046,306 | 0.18% |
| 20 | Trojan-Downloader.Win32.Zlob.aces | 1,011,464 | 0.17% |
These statistics represent detected verdicts of the web-based antivirus module and were submitted by the users of Kaspersky Lab products who consented to share their local data. *The total number of unique incidents recorded by web-based antivirus on users’ computers.
In first place came those threats to which access was blocked using special algorithms that detect potentially harmful sites, links and applications, as discussed above.
Second place went to heuristically detected malicious links planted by hackers, often with malware itself planted into the code of the hacked websites. These links execute a hidden request from the browser to go to a different site, where typically, a basic collection of exploits is housed. These exploits target the vulnerabilities in web browsers and applications. Similar programs also appeared at 9th and 17th positions on the list, although in both cases, signature-based detection was involved. These are the most widespread of all iframe threats.
In 2009, the Top 5 web-based threats included Gumblar scripts and the Boran.z adware program. In 2010, malicious programs detected by heuristic analyzers occupied from 2nd to 6th positions, with programs comparable to Gumblar and Boran.z (Agent.bab and Shopper.l) ranked 7th and 8th.
In May 2010, Exploit.JS.Agent.bab exploded onto the scene with over 340,000 detections on the first day of the month alone. This threat targets the CVE-2010-0806 vulnerability and downloads a variety of malicious programs onto the victim computer. The range of malware involved in this exploit clearly marks it as being of Chinese origin: Trojan-Downloader.Win32.Geral and Backdoor.Win32.Hupigon, as well asTrojan-GameTheif.Win32.Maganiz, Trojan-GameTheif.Win32.WOW and others.
Adware.Win32.Shopper.l is a very aggressive program that employs a variety of tactics to penetrate a computer and install its extension for the Internet Explorer browser. Aside from Shopper, other adware programs that made the Top 20 include: Funweb.q (14th place) and HotBar.dh (19th place).
Almost all of the other threats that made the Top 20 are either exploits, or use exploits as part of their attack mechanisms.
Countries in which web resources were seeded with malware: the Top 20
The 580,371,937 attacks that we recorded in 2010 were launched from Internet resources located in 201 countries around the world. Approximately 90% of all of the malicious programs on the Internet that we detected were found to have originated in 20 countries.
| Ranking | Country* | Number of unique web-based attacks ** | % of all attacks |
| 1 | United States | 137,487,939 | 25.98% |
| 2 | Russian Federation | 80,053,584 | 15.13% |
| 3 | China | 69,178,484 | 13.07% |
| 4 | Netherlands | 35,248,627 | 6.66% |
| 5 | Germany | 31,502,020 | 5.95% |
| 6 | Spain | 22,266,022 | 4.21% |
| 7 | Ukraine | 20,304,022 | 3.84% |
| 8 | United Kingdom | 18,624,666 | 3.52% |
| 9 | Sweden | 13,747,084 | 2.60% |
| 10 | Latvia | 9,398,597 | 1.78% |
| 11 | France | 9,080,399 | 1.72% |
| 12 | Canada | 7,606,163 | 1.44% |
| 13 | British Virgin Islands | 5,447,433 | 1.03% |
| 14 | Poland | 3,867,382 | 0.73% |
| 15 | Moldova | 3,756,679 | 0.71% |
| 16 | Philippines | 2,618,504 | 0.49% |
| 17 | Turkey | 2,394,933 | 0.45% |
| 18 | Vietnam | 1,915,727 | 0.36% |
| 19 | Hong Kong | 1,909,675 | 0.36% |
| 20 | Australia | 1,908,612 | 0.36% |
These statistics are based on the detection verdicts of the web antivirus module, and were provided by users of Kaspersky Lab products who gave their consent to transfer their statistical data.
* In order to determine the geographical source of an attack, the domain name is compared to the actual IP-address where the domain in question is located, and the geographical location of the IP-address is determined (GEOIP).
** The total number of unique attacks from web resources originating in the country as recorded by the web antivirus module.
When analyzing these statistics, it should be remembered that the figures encompass not only malicious hosting services, which are created and maintained by malicious users, but also legitimate websites that were hacked and used as hosts for malicious content. The incorrect interpretation of this data could lead to the placing of blame on a particular country for an attack — which happens frequently, even though such an accusation is, in reality, unfounded. In fact, these statistics highlight those countries that are actually victims, where the local cyberspace is actively exploited by cybercriminals.
Compared to 2009, the geographical distribution of web-based threats has changed substantially. One year ago, China was ranked number one, with an unbelievably high 52%. In 2010, China’s authorities took steps toward improving the situation and were able to shut down numerous malicious hosting services used by cybercriminals around the world. China also introduced more stringent domain registration rules for the .cn zone. These efforts have been productive, and now China (13%) is no longer in the lead when it comes to web-based threats. Now, the leading positions are occupied by the USA (26%) and Russia (15%).
The percentage represented by the USA has increased on an annual basis, which is worrying. The actual figures are: 7% in 2008, 19% in 2009, and 26% in 2010. The situation has not changed despite a series of major shutdowns of rogue hosting services. Clearly, the principal problem remains the large number of infected legitimate websites.
The USA and China were consistently followed by Germany, the Netherlands and Russia, which never made it above 5th place. However, in 2010 Russia did climb to second place. The percentage of Internet resources located in Russia rose from 2.6% to 15.1% over a one-year period. The growth in the number of web resources in Russia seeded with malicious content was largely due to events in China, as discussed above. Russian cybercriminals were one of the main consumers, if not the main consumer, of disreputable hosting services in China. After the Chinese option ceased to exist, Russian cybercriminals were forced to use Russian resources.
The distribution of computer users who fell victim to web attacks, by country
The following is worth noting: it shows the countries and regions in which computer users were victims of online attacks.
Approximately 82% of the 561,869,053 attempted infections recorded were made against computers located in the following twenty countries:
| Ranking | Country* | % of web attacks** |
| 1 | China | 19.05% |
| 2 | Russian Federation | 17.52% |
| 3 | United States | 10.54% |
| 4 | India | 5.56% |
| 5 | Germany | 3.16% |
| 6 | Ukraine | 2.66% |
| 7 | Vietnam | 2.60% |
| 8 | United Kingdom | 2.56% |
| 9 | France | 2.55% |
| 10 | Italy | 2.39% |
| 11 | Spain | 2.06% |
| 12 | Saudi Arabia | 1.77% |
| 13 | Malaysia | 1.62% |
| 14 | Turkey | 1.60% |
| 15 | Brazil | 1.49% |
| 16 | Mexico | 1.47% |
| 17 | Canada | 1.31% |
| 18 | Thailand | 1.15% |
| 19 | Poland | 1.09% |
| 20 | Egypt | 1.02% |
These statistics are based on the detection verdicts of the web antivirus module, and were provided by users of Kaspersky Lab products who gave their consent to transfer their statistical data.
* In order to determine the geographical location of the attack target, the IP address of the user who provided the statistics was used.
** The percentage of online attacks recorded on the computers of individual users.
Here, we also see a marked change in the geographical distribution of attack victims compared to 2009. Despite the fact that the majority of attacks still targeted Chinese users, last year the number more than halved, from 46.8% to 19.1%.
Russia and the USA swapped places, although a rise in the number of attacks was observed in both countries, from 5.8% and 6.6% to 17.5% and 10.5%, respectively. The percentage of Russian users affected increased at an equally significant rate due to the large number of attacks launched via the prominent Russian social networking sites VKontakte and Odnoklassniki, as well as the related epidemic of various SMS blockers, which is covered in the main section of the report.
Germany and India maintained their places in the Top 5 countries targeted in online attacks.
The surge in the number of attacks targeting users in Ukraine, from 0.9% in 2009 to 2.7% in 2010, is largely due to the same factors that caused the increase in the number of Russian users targeted.
The drop in the number of attacks against users in Turkey, Egypt and Vietnam observed in 2009, continued — but only for the first two countries. The situation grew worse for users in Vietnam, and the country moved up to 7th place.
It is important to remember that these statistics reflect the total number of Internet users in any given country, and within those, the number of users of Kaspersky Lab products.
Network attacks
Firewalls are a critical element of modern security solutions. Firewalls block external attacks against a computer that are not launched from a browser. Firewalls also counter attempts to steal data from users’ computers.
Kaspersky Internet Security includes a firewall with intrusion detection system (IDS) functionality. This neutralizes threats such as exploits that target vulnerabilities in OS network services and which are capable of infecting a system that has unpatched vulnerabilities, or granting cybercriminals full access to a system.
In 2010, the IDS system logged 1,311,156,130 network attacks. That number was just 220 million in 2009.
The Top 20 malicious programs responsible for network attacks
| Ranking | Name | Number of unique attacks* | % |
| 1 | Intrusion.Win.NETAPI.buffer-overflow.exploit | 557,126,500 | 42.49% |
| 2 | DoS.Generic.SYNFlood | 400,491,518 | 30.54% |
| 3 | Intrusion.Win.MSSQL.worm.Helkern | 262,443,478 | 20.02% |
| 4 | Scan.Generic.UDP | 45,343,780 | 3.46% |
| 5 | Intrusion.Win.DCOM.exploit | 14,134,307 | 1.08% |
| 6 | Intrusion.Generic.TCP.Flags.Bad.Combine.attack | 10,631,023 | 0.81% |
| 7 | Scan.Generic.TCP | 5,238,178 | 0.40% |
| 8 | Intrusion.Win.LSASS.exploit | 5,089,038 | 0.39% |
| 9 | Intrusion.Win.LSASS.ASN1-kill-bill.exploit | 3,256,429 | 0.25% |
| 10 | DoS.Generic.ICMPFlood | 2,341,724 | 0.18% |
| 11 | DoS.Win.IGMP.Host-Membership-Query.exploit | 1,641,578 | 0.13% |
| 12 | Intrusion.Win.HTTPD.GET.buffer-overflow.exploit | 1,399,613 | 0.11% |
| 13 | Intrusion.Win.PnP.exploit | 579,249 | 0.04% |
| 14 | Intrusion.Win.EasyAddressWebServer.format-string.exploit | 384,278 | 0.03% |
| 15 | Intrusion.Win.SMB.CVE-2009-3103.exploit | 236,122 | 0.02% |
| 16 | Intrusion.Win.WINS.heap-overflow.exploit | 190,272 | 0.01% |
| 17 | DoS.Win.ICMP.BadCheckSum | 101,063 | 0.01% |
| 18 | Intrusion.Generic.FTPD.format-string.attack | 98,239 | 0.01% |
| 19 | Intrusion.Win.CVE-2010-2729.a.exploit | 71,671 | 0.01% |
| 20 | Intrusion.Win.MSFP2000SE.exploit | 44,674 | 0.004% |
These statistics are based on the detection verdicts of the web antivirus module, and were provided by users of Kaspersky Lab products who gave their consent to transfer their statistical data.
*The total number of unique incidents logged by the IDS on users’ computers.
The year 2010 saw a change in first place from the previous year. Based on the number of attacks, NETAPI.buffer-overflow.exploit took the number one slot. This exploit targets the MS08-067 vulnerability and was also used in the Kido family of worms. The rest of the Top 5 were the usual suspects, with malicious packets from Helkern (Slammer) worms and exploits targeting the MS03-026 vulnerability, which was used, for example, in the Lovesan worm in 2003.
Also of interest was the CVE-2010-2729.a attack in 19th place which was used by Stuxnet to exploit the MS10-61 vulnerability. Kaspersky Lab detected Stuxnet’s exploitation of this vulnerability. The Print Spooler service vulnerability aided the worm’s replication on local networks and was a zero-day vulnerability when it was detected. It was in the Top 20 for just five months, and Stuxnet is still the only malicious program to exploit this vulnerability.
Local infection
One critically important indicator is the number of local infections on users’ computers. This data includes threats that have penetrated computer systems, but not through the web, email or network ports.
Kaspersky Lab’s antivirus solutions successfully detected nearly 1.5 billion (1,325,667,443) malware incidents on users’ computers via the Kaspersky Security Network.
Examination of the 1.5 billion figure showed that it was made up of a total of 1,590,861 different malicious and potentially unwanted programs.
The malicious programs listed in the Top 20 were the most prevalent threats in 2010.
The Top 20 malicious programs detected on users’ computers
| Ranking | Detected threat | Number of unique users* | % |
| 1 | Trojan.Win32.Generic | 9,226,235 | 20.16% |
| 2 | DangerousObject.Multi.Generic | 8,400,880 | 18.36% |
| 3 | Net-Worm.Win32.Kido.ih | 6,386,762 | 13.96% |
| 4 | Virus.Win32.Sality.aa | 4,182,229 | 9.14% |
| 5 | Net-Worm.Win32.Kido.ir | 3,785,066 | 8.27% |
| 6 | Virus.Win32.Virut.ce | 1,950,967 | 4.26% |
| 7 | Worm.Win32.Generic | 1,706,624 | 3.73% |
| 8 | Worm.Win32.FlyStudio.cu | 1,384,379 | 3.02% |
| 9 | Net-Worm.Win32.Kido.iq | 1,057,900 | 2.31% |
| 10 | P2P-Worm.Win32.Palevo.fuc | 1,049,861 | 2.29% |
| 11 | HackTool.Win32.Kiser.il | 1,007,745 | 2.20% |
| 12 | Trojan.Win32.Invader | 974,957 | 2.13% |
| 13 | Trojan.Win32.Pakes.Katusha.o | 968,85 | 2.12% |
| 14 | Worm.Win32.VBNA.b | 941,102 | 2.06% |
| 15 | Trojan.JS.Agent.bhr | 941,092 | 2.06% |
| 16 | Trojan-Dropper.Win32.Flystud.yo | 886,356 | 1.94% |
| 17 | Exploit.Script.Generic | 855,842 | 1.87% |
| 18 | Trojan-Downloader.Win32.Generic | 806,024 | 1.76% |
| 19 | Worm.Win32.Mabezat.b | 783,831 | 1.71% |
| 20 | Virus.Win32.Sality.bh | 739,712 | 1.62% |
These statistics are based on the detection verdicts of the web antivirus module, and were provided by users of Kaspersky Lab products who gave their consent to transfer their statistical data.
*The number of unique users with computers running an antivirus program that detected this particular threat.
Over 14 million computers used universal heuristic methods to successfully detect and block attempted attacks by malware such as Trojan.Win32.Generic, Worm.Win32.Generic, Trojan.Win32.Invader, Exploit.Script.Generic, and Trojan-Downloader.Win32.Generic.
Over 8 million computer users were protected in real-time by the Urgent Detection System, UDS, which is part of Kaspersky Security Network. This technology detects new malware such as DangerousObject.Multi.Generic almost instantly.
The Kido worm remains one of the most widespread malicious programs to be blocked on users’ computers, despite the fact that by late 2010 it was two years old. What is even more worrying, the number of incidents involving this worm does not appear to be on the decline. On the contrary, in 2010, Kaspersky Lab registered more than double the number of cases. Clearly, Kido, like the Sality virus which was the number-one threat of 2008, will remain a major threat throughout 2011 at the very least. We do not expect to see either of these two threats disappear from the Top 20 for another 2-3 years.
One of the Palevo worm variants — responsible for the creation of the Mariposa botnet — took 10th place. The main section of this report covers the 2010 arrest of the worm’s authors and the botnet’s owners. Palevo’s appearance in the Top 20 just goes to show how prevalent such threats have become. Judging by what we have seen, the Spanish police’s estimate of 12 million computers infected by Palevo is absolutely realistic.
The malicious programs created using FlyStudio script that were noted in 2009 were still in 2010’s Top 20, coming in at 8th and 16th places.
Packing and obfuscating malicious programs using special packers remained common practice in 2010. Some packer programs that were used extensively in 2009 were replaced with the Katusha and VBNA packers in 2010.
The distribution of computers upon which local infections were logged: by country
The local infections described above were logged by users in just about every country in the world.
| Ranking | Country* | % of unique infection attempts** |
| 1 | China | 19.86% |
| 2 | Russian Federation | 15.53% |
| 3 | India | 7.35% |
| 4 | United States | 5.72% |
| 5 | Vietnam | 4.44% |
| 6 | Ukraine | 2.59% |
| 7 | Germany | 2.36% |
| 8 | Mexico | 2.18% |
| 9 | Italy | 2.08% |
| 10 | Malaysia | 2.07% |
| 11 | France | 2.00% |
| 12 | Saudi Arabia | 1.92% |
| 13 | Turkey | 1.91% |
| 14 | Spain | 1.88% |
| 15 | Brazil | 1.77% |
| 16 | United Kingdom | 1.67% |
| 17 | Egypt | 1.66% |
| 18 | Thailand | 1.58% |
| 19 | Poland | 1.26% |
| 20 | Indonesia | 1.12% |
These statistics are based on the detection verdicts of the web antivirus module, and were provided by users of Kaspersky Lab products who gave their consent to transfer their statistical data.
*In order to identify the geographical location of an attack, the IP-address of the user providing the statistics was used.
**The percentage of all unique infection attempts made on users’ computers.
The list of Top 20 countries in which 80% of unique infection attempts were made against users’ computers closely resembles the list of the Top 20 countries targeted by web attacks. However, it should be borne in mind that these statistics depend firstly on the number of Internet users in each particular country, and of those, the number running Kaspersky Lab products on their machines.
The global picture
The statistics quoted by the various antivirus companies are based primarily on information that they receive from their clients. The data obtained will greatly influence consumer interest in the company’s products in the various countries. As a result, as we have noted several times above, the results that we have obtained in terms of the distribution of all logged web attacks and local infections by country depend on the number of Internet users in that country, and primarily on the number of those Internet users that also run Kaspersky Lab products.
In order to provide an accurate assessment of the level of risk of infection for computer users around the world, we have calculated the frequency of user events in 2010 as a percentage for each country, based on antivirus program data obtained by Kaspersky Lab.
Web-based threats
| Ranking | Country | % of unique users* |
| 1 | Iraq | 61.8420 |
| 2 | Oman | 56.1884 |
| 3 | Russian Federation | 53.6922 |
| 4 | Belarus | 48.0310 |
| 5 | United States | 46.1497 |
| 6 | Sudan | 45.9262 |
| 7 | Kuwait | 44.2358 |
| 8 | Armenia | 44.1996 |
| 9 | Kazakhstan | 43.2014 |
| 10 | Angola | 42.9854 |
| 11 | Ukraine | 42.6281 |
| 12 | China | 41.3646 |
| 13 | Azerbaijan | 40.9806 |
| 14 | India | 40.6102 |
| 15 | Turkmenistan | 39.9695 |
| 16 | Bangladesh | 39.8528 |
| 17 | Libya | 39.7903 |
| 18 | Sri Lanka | 39.5818 |
| 19 | Saudi Arabia | 38.7151 |
| 20 | Djibouti | 37.7816 |
These statistics are based on the detection verdicts of the web antivirus module, and were provided by users of Kaspersky Lab products who gave their consent to transfer their statistical data. When calculating, we excluded those countries in which the number of Kaspersky Lab product users is relatively small (less than 10,000).
* The number of unique users subjected to online attacks, as a percentage of the total number of unique users of Kaspersky Lab products in the country.
These are the Top 20 countries in which users were most frequently subjected to online attacks. In Iraq in 2010, for example, two out of every three Internet users were attacked. In Russia, one in two Internet users became the subject of an online attack.
Generally speaking, it is possible to sort all of the countries in the world into just a handful of groups. The extremely high-risk group, in which over 60% of users reported web attacks, included just one country: Iraq. The high-risk group, with a risk level ranging anywhere from 41-60%, included the 11 countries following Iraq in the Top 20. The Average-risk group’s range was from 21-40%. Throughout 2010, this group included 116 countries around the world. The last group had an average risk level of around 20% and included five relatively safe countries: Germany, Japan, Luxembourg, Austria, and Norway, with risk levels varying somewhere between 19% and 20.8%.
Local threats
The same set of statistics can be obtained for local threat detection — local threats in this case meaning the same threats as before, but which have penetrated the system via a source other than the Internet, for example, over a local network or via removable media. These numbers show the average extent to which computers in the various countries are infected.
| Ranking | Country | % of unique users* |
| 1 | Iraq | 79.2608 |
| 2 | Sudan | 70.4211 |
| 3 | Rwanda | 69.1798 |
| 4 | Nigeria | 67.7693 |
| 5 | Tanzania | 67.6782 |
| 6 | Bangladesh | 67.2685 |
| 7 | Angola | 66.0113 |
| 8 | Burkina Faso | 62.5769 |
| 9 | Afghanistan | 62.5000 |
| 10 | Uganda | 62.0151 |
| 11 | Oman | 61.9510 |
| 12 | Turkmenistan | 61.2507 |
| 13 | Djibouti | 60.7995 |
| 14 | Nepal | 60.4366 |
| 15 | Mongolia | 60.0984 |
| 16 | Cameroon | 59.6633 |
| 17 | Kenya | 59.4906 |
| 18 | Maldives | 58.2855 |
| 19 | Zambia | 58.2437 |
| 20 | Mali | 58.0034 |
These statistics are based on the detection verdicts of the web antivirus module, and were provided by users of Kaspersky Lab products who gave their consent to transfer their statistical data. When calculating, we excluded those countries in which the number of Kaspersky Lab product users is relatively small (less than 10,000).
*The percentage of unique users in the country with computers running Kaspersky Lab products that blocked local threats.
The fact that this Top 20 list is exclusively made up of developing countries in Africa and Asia is explained by the steady increase of the availability of Internet access in these regions, and the relatively low level of computer literacy and lack of experience in combating cyber threats.
In the case of local threats, it also makes sense to divide the countries into several groups. The group with the highest levels of infection included the first twelve countries in the Top 20. The second group (41-60%) was made up of 66 countries, and the third (21-40%) included 45 countries.
The ‘cleanest’ computers (0-20%) were located in just 16 countries around the world. Naturally, this number is relative, as noted above, since these statistics only represent the data found on computers running Kaspersky Lab products.
The countries with the lowest percentage of infected computers were:
| Ranking | Country | % * |
| 1 | Japan | 8.6525 |
| 2 | Germany | 10.7865 |
| 3 | Luxembourg | 11.7887 |
| 4 | Austria | 12.8684 |
| 5 | Switzerland | 10.1475 |
| 6 | Denmark | 13.1531 |
| 7 | Finland | 15.9136 |
| 8 | Norway | 16.1966 |
| 9 | Sweden | 16.6120 |
| 10 | United Kingdom | 17.4274 |
| 11 | Canada | 18.2753 |
| 12 | Netherlands | 18.3106 |
| 13 | New Zealand | 19.7266 |
| 14 | Estonia | 19.9988 |
| 15 | United States | 20.0590 |
| 16 | Ireland | 20.0930 |
Here, we also see the five countries with the safest Internet environment: Austria, Germany, Luxembourg, Norway, and Japan. The fact that these countries are on both lists leads us to the assumption that computer users in these countries enjoy a high level of protection.
Vulnerabilities
Over the past five or six years, the number of vulnerabilities detected each year has been approximately the same. In 2010, according to statistics from CVE (cve.mitre.org), only slightly more vulnerabilities were found in Microsoft’s products and popular third-party Windows applications than in 2009.
Despite the fact that the number of detected vulnerabilities changes only slightly from year to year, malicious users are still proactively taking advantage of them for their own ends. In 2010, the problem of vulnerabilities in widely used programs captivated IT security professionals and journalists across the globe. Vulnerabilities were used in some of the most high-profile attacks, such as Aurora and Stuxnet , both of which received much coverage by the media. The effect of the coverage was twofold: on the one hand, other cybercriminals began using the ‘popular’ vulnerabilities; on the other hand, the developers worked to patch the loopholes in their software as soon as possible.
Previously, the most interesting targets for malicious users and researchers on the hunt for vulnerabilities were components of the Windows OS and Microsoft products. However, constant increases in the operating system’s security level and development of the automatic update module led to a situation in which most users began to update their Microsoft products relatively quickly, and vulnerabilities in related software could not be exploited for long. This forced cybercriminals to search out loopholes in programs whose developers paid less attention to security issues. These were the vulnerabilities in popular applications released by other vendors that were not included in the default version of the Windows OS. Every computer user typically has about twenty or so of these types of applications and rarely updates them regularly.
The fact that the most targeted programs were those not included with the operating system was also confirmed by our statistics: in the first quarter of 2010, 6 of the Top 10 list of most common vulnerabilities were found in Microsoft products, while in the fourth quarter, only 1 from the Top 10 list was found in a Microsoft product. All of the others were vulnerabilities in commonly used applications, such as music players, e-readers, web browsers and virtual machines.
| Microsoft | Adobe | Oracle | Mozilla | Apple | HP | |
| Q1 2010 | 6 | 3 | 1 | 0 | 0 | 0 |
| Q2 2010 | 6 | 3 | 1 | 0 | 0 | 0 |
| Q3 2010 | 5 | 4 | 1 | 0 | 0 | 0 |
| Q4 2010 | 1 | 5 | 1 | 1 | 1 | 1 |
In 2010, the vulnerability analysis system on users’ computers running KSN detected 510 vulnerabilities. We analyzed the Top 20 most commonly detected vulnerabilities in 2010, which represented 89.6% of all detected vulnerabilities.
| Vulnerability | Percentage of the total number of computers on which vulnerabilities were found | Name | Impact | Rating | Release date |
| 31744 | 26.98% | Microsoft Office OneNote URI Handling Vulnerability | System access | Highly critical | 09.09.2008 |
| 35377 | 26.64% | Microsoft Office Word Two Vulnerabilities | System access | Highly critical | 09.06.2009 |
| 38805 | 24.98% | Microsoft Office Excel Multiple Vulnerabilities | System access | Highly critical | 09.03.2010 |
| 37255 | 23.18% | Sun Java JDK / JRE Multiple Vulnerabilities | System access, DoS, Exposure of sensitive information, Exposure of system information, Manipulation of data, Security Bypass | Highly critical | 31.03.2010 |
| 38547 | 17.41% | Adobe Flash Player Domain Sandbox Bypass Vulnerability | Security Bypass | Moderately critical | 12.02.2010 |
| 34572 | 15.87% | Microsoft PowerPoint OutlineTextRefAtom Parsing Vulnerability | System access | Extremely critical | 03.04.2009 |
| 37690 | 14.46% | Adobe Reader/Acrobat Multiple Vulnerabilities | System access, Cross Site Scripting | Extremely critical | 15.12.2009 |
| 29320 | 12.96% | Microsoft Outlook “mailto:” URI Handling Vulnerability | System access | Highly critical | 11.03.2008 |
| 41340 | 12.63% | Adobe Reader / Acrobat SING “uniqueName” Buffer Overflow Vulnerability | System access | Extremely critical | 08.09.2010 |
| 39272 | 12.55% | Adobe Reader / Acrobat Multiple Vulnerabilities | System access, Cross Site Scripting | Highly critical | 14.04.2010 |
| 40026 | 12.38% | Adobe Flash Player Multiple Vulnerabilities | System access, Cross Site Scripting | Extremely critical | 05.06.2010 |
| 23655 | 12.27% | Microsoft XML Core Services Multiple Vulnerabilities | System access, Cross Site Scripting, DoS | Highly critical | 09.01.2007 |
| 41917 | 11.99% | Adobe Flash Player Multiple Vulnerabilities | System access, Exposure of sensitive information, Security Bypass | Extremely critical | 28.10.2010 |
| 41791 | 11.21% | Sun Java JDK / JRE / SDK Multiple Vulnerabilities | System access, DoS, Exposure of sensitive information, Exposure of system information, Manipulation of data, Security Bypass | Highly critical | 13.10.2010 |
| 32428 | 10.33% | Microsoft PowerPoint Multiple Vulnerabilities | System access | Highly critical | 12.05.2009 |
| 40907 | 9.99% | Adobe Flash Player Multiple Vulnerabilities | System access | Highly critical | 11.08.2010 |
| 25952 | 9.88% | ACDSee Products Image and Archive Plug-ins Buffer Overflows | System access | Highly critical | 02.11.2007 |
| 38551 | 9.50% | Adobe Reader/Acrobat Two Vulnerabilities | System access, Security Bypass | Highly critical | 12.02.2010 |
| 37231 | 9.03% | Sun Java JDK / JRE Multiple Vulnerabilities | System access, DoS, Exposure of sensitive information, Security Bypass | Highly critical | 04.11.2009 |
| 39375 | 8.51% | Microsoft Office Publisher File Parsing Buffer Overflow Vulnerability | System access | Highly critical | 13.04.2010 |
Note that nearly half of the list are vulnerabilities detected prior to 2010. Of particular interest is the fact that two of them were first detected back in 2007 – one in Microsoft XML Core Services, and the other in ACDSee Products’ Image and Archive Plug-in.
Based on 2010’s results, the Top 20 most common vulnerabilities were found in software developed by four companies: Microsoft, Adobe, Oracle and ACDSee:

Microsoft led the 2009 chart, but in 2010, the situation was vastly different: first place in terms of the number of detected vulnerabilities was shared by Microsoft and Adobe. One major contributing factor to this change is the fact that in 2009, only vulnerabilities from Adobe Flash Player made it to the Top 20, while in 2010, four of the eight vulnerabilities found in Adobe products were in Adobe Reader — a top target for malicious users.
The most vulnerable applications on Windows systems in 2010 included applications in the MS Office Suite, Adobe Reader and Adobe Flash Player. The number of vulnerabilities in Sun (Oracle) Java JDK/JRE products are also on the rise. Meanwhile, the Top 20 did not include any of the vulnerabilities in Apple’s QuickTime Player and which accounted for 70% of all vulnerable file detections in 2009.
When we categorize the Top 20 vulnerabilities detected on computers running KSN according to the type of operation executed on the system, we get the following distribution:
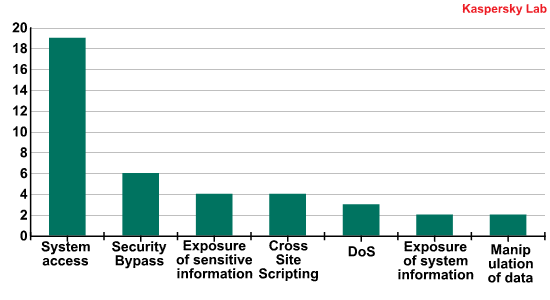
The primary objective for the cybercriminals is, of course, to obtain remote access to users’ systems. Some 19 out of every 20 vulnerabilities are malicious attempts to gain full access to systems (‘system access’ operations), just like in 2009. Remarkably, 6 of those 19 attempts also help cybercriminals to circumvent security systems.
When it comes to extremely critical vulnerabilities, these include two in Adobe Reader, two in Adobe Flash Player and one in Microsoft PowerPoint.
Unfortunately, not all vendors include or develop update systems for their products, and more often than not, the responsibility for downloading and installing system updates falls squarely on the shoulders of users. Most users are not particularly interested in application updates if those updates do not mean the addition of any new features. This has led to a situation whereby millions of computers around the world are running popular software programs that have never been updated — leaving millions of computers open to malicious attacks.
From the same authors


In the same category


Kaspersky Security Bulletin 2010. Statistics, 2010