

News overview
The start of the year saw the appearance of various new tools in the arsenal of DDoS-attack masterminds. In early February, for instance, the new botnet Cayosin, assembled from elements of Qbot, Mirai, and other publicly available malware, swam into view. Cybersecurity experts were intrigued less by the mosaic structure and frequent updating of its set of exploited vulnerabilities than by the fact that it was advertised (as a DDoS service) not on the dark web, but through YouTube. What’s more, it is up for sale on Instagram (botnetters are clearly making the most of the opportunities afforded by social media). In tracing the cybercriminals’ accounts, the researchers stumbled upon other malware and botnets as well, including the already discovered Yowai.
Mid-March turned up another find in the shape of a new version of Mirai, geared towards attacking business devices. The malware is now able to “botnetize” not only access points, routers, and network cameras, but wireless presentation and digital signage systems, too.
Despite all this, the number of observed high-profile attacks using new and not-so-new botnets was not that high. At the end of winter, the University of Albany (UAlbany) in the US came under assault: during the February 5 – March 1 period, 17 attacks were made on it, downing the university servers for at least five minutes. Data belonging to students and staff was not affected, but some services were unavailable; the head of IT security at UAlbany believes that the university was specifically targeted.
In early February, the website of the National Union of Journalists of the Philippines was also hit. The site was disabled for several hours by a series of powerful attacks, peaking at 468 GB/s of traffic. The attack was part of a widespread campaign against various news resources. The targets believe themselves to be the victims of political pressure on alternative sources of information.
Also in mid-March, Facebook encountered serious problems with its services when Facebook and Instagram users were unable to log into their accounts. Many observers consider the incident to be DDoS-related. However, Facebook itself rejects this version of events, meaning that the real cause can only be guessed at.
The lack of news about serious DDoS attacks coincided with a rise in the number of reports of major police operations against attack organizers, accompanied by arrests and charges.
The fight to bring down resources used for DDoS attacks continues: in early January, the US Department of Justice seized 15 Internet domains from which a series of DDoS attacks was launched last December. According to DoJ documents, those domains were used to carry out attacks on government systems, ISPs, universities, financial institutions, and gaming platforms worldwide.
Later that same month, a US court handed down a 10-year jail term to a Massachusetts hacker for conducting DDoS attacks against two health facilities. Also in January, a hacker-for-hire was arrested in Britain for having incapacitated mobile networks in Liberia and Germany (at the peak of his criminal career in 2015, he took the whole of Liberia offline). Although his “work history” is far longer than that, no other charges were brought.
The shockwaves from last year’s operation to close down Webstresser.org — one of the most notorious sites providing DDoS attack services — continue to spread. Cyber police decided to go after not just the attack organizers, but the customers as well. At the end of January, Europol announced the arrest of more than 250 users in Britain and the Netherlands. Instead of prison, one of the convicted cybercriminals will receive an alternative punishment under the Dutch Hack_Right program, aimed at rehabilitating young hackers arrested for the first time. Other sources report that an investigation is underway into all 150,000 Webstresser clients resident in 20 different countries.
Yet despite the law enforcement efforts, DDoS attacks remain a real threat to business. As a Neustar International Security Council survey of 200 senior technical staff members of large companies revealed, firms today consider DDoS attacks to be a serious problem: 52% of security services have already faced them, and 75% are concerned about the issue.
Quarter trends
Last quarter, we made two predictions about trends in the DDoS attack market: first, that the market overall would contract; second, that demand for long-term “smart” attacks, in particular HTTP flooding, would grow.
The first did not happen: Kaspersky DDoS Protection statistics show that all DDoS attack indicators increased last quarter. The total number of attacks climbed by 84%, and the number of sustained (over 60 minutes) DDoS sessions precisely doubled. The average duration increased by 4.21 times, while the segment of extremely long attacks posted a massive 487% growth.
This forces a reassessment of the assumption made in last year’s Q3 and Q4 reports that the decrease in DDoS activity is linked to cybercriminals switching to the more reliable and profitable cryptocurrency mining. Clearly, this hypothesis is at least partially wrong.
There is another, more likely explanation: over the last six months of the previous year, we have been observing less the redistribution of botnet capacity for other purposes and more the emergence of a market vacuum. Most likely, the supply deficit was linked to the clamping down on DDoS attacks, the closure of sites selling related services, and the arrest of some major players over the past year. Now it seems the vacuum is being filled: such explosive growth in the indicators is almost certainly due to the appearance of new suppliers and clients of DDoS services. It will be interesting to observe how this trend develops in Q2. Will the indicators continue to rise, or will the market settle at the current level?
The second prediction (growing demand for smart application-level attacks) was more accurate: the share of long, harder-to-organize attacks is still growing, both qualitatively and quantitatively. We see no reason why this trend should not continue throughout Q2.
Statistics
Methodology
Kaspersky Lab has a long history of combating cyber threats, including DDoS attacks of all types and complexity. Company experts monitor botnets using the Kaspersky DDoS Intelligence system.
A part of Kaspersky DDoS Protection, the DDoS Intelligence system intercepts and analyzes commands received by bots from C&C servers. The system is proactive, not reactive, meaning that it does not wait for a user device to get infected or a command to be executed.
This report contains DDoS Intelligence statistics for Q1 2019.
In the context of this report, the incident is counted as a single DDoS-attack only if the interval between botnet activity periods does not exceed 24 hours. For example, if the same web resource was attacked by the same botnet with an interval of 24 hours or more, then this is considered as two attacks. Bot requests originating from different botnets but directed at one resource also count as separate attacks.
The geographical locations of DDoS-attack victims and C&C servers used to send commands are determined by their respective IP addresses. The number of unique targets of DDoS attacks in this report is counted by the number of unique IP addresses in the quarterly statistics.
DDoS Intelligence statistics are limited to botnets detected and analyzed by Kaspersky Lab. Note that botnets are just one of the tools used for DDoS attacks, and that this section does not cover every single DDoS attack that occurred during the review period.
Quarter summary
- In terms of the geographical distribution of attacks, China remains out in front. Having nearly surrendered top spot at the end of 2018, it consolidated its positions in Q1 2019.
- The geographical distribution of targets roughly mirrors the geographical distribution of attacks: the Top 3 were again China (59.85%), the US (21.28%), and Hong Kong (4.21%).
- Both geographic Top 10s saw relatively little reshuffling compared to previous quarters. There was no more sudden growth observed in botnet activity in unexpected places.
- DDoS attacks peaked in the second half of March; the quietest period was January.
- The most dangerous day of the week for DDoS attacks was Saturday, while Sunday remains the calmest.
- The maximum attack duration decreased by more than a day against the previous quarter, although the percentage share of sustained DDoS sessions continued to rise and amounted to 21.34% (versus 16.66% in Q4 2018).
- The share of SYN flooding increased to 84%, bringing down the share of UDP and TCP flood, while the share of HTTP and ICMP attacks rose to 3.3% and 0.6%, respectively.
- The share of Linux botnets decreased slightly, but still remains predominant (95.71%).
- Most botnet C&C servers are still located in the US (34.10%), with the Netherlands in second place (12.72%), and Russia in third (10.40%). It is notable that the once perennial leader, South Korea, returned to the Top 10, albeit in last place (2.31%).
Attack geography
China remains the leader by number of attacks. It even returned to its previous level after a drop in previous quarters: its share rose from 50.43% to 67.89%. In second place came the US, although its share was reduced from 24.90% to 17.17%. Third place belonged to Hong Kong, up from seventh, increasing its share from 1.84% to 4.81%.
Interestingly, except for China and Hong Kong, all other countries’ shares decreased. This did not prevent the US from retaining second position; meanwhile, Australia, having taken bronze at the end of 2018, dropped to last place, down 4 p.p. (from 4.57% to 0.56%).
Among other significant changes, it is worth noting Britain, which fell from fifth to seventh place having shed 1.52 p.p. (from 2.18% to 0.66%), as well as Canada and Saudi Arabia. Each of the latter two lost around 1 p.p., but that did not stop Canada (0.86%) climbing from sixth to fourth, while Saudi Arabia (0.58%) dropped down a rung towards the foot of the table.
Brazil, meanwhile, dropped out of the Top 10 altogether, making way for Singapore, which came straight in at number 5 with 0.82% of attacks (tellingly, its share too was down on the previous quarter, albeit very slightly).
South Korea, which previously juggled second and third place with the US, remains outside the Top 10 (accounting for 0.30% of attacks). However, although the Top 10 still looks slightly odd to us, there was no repeat of the out-of-the-blue changes observed in the past three quarters.
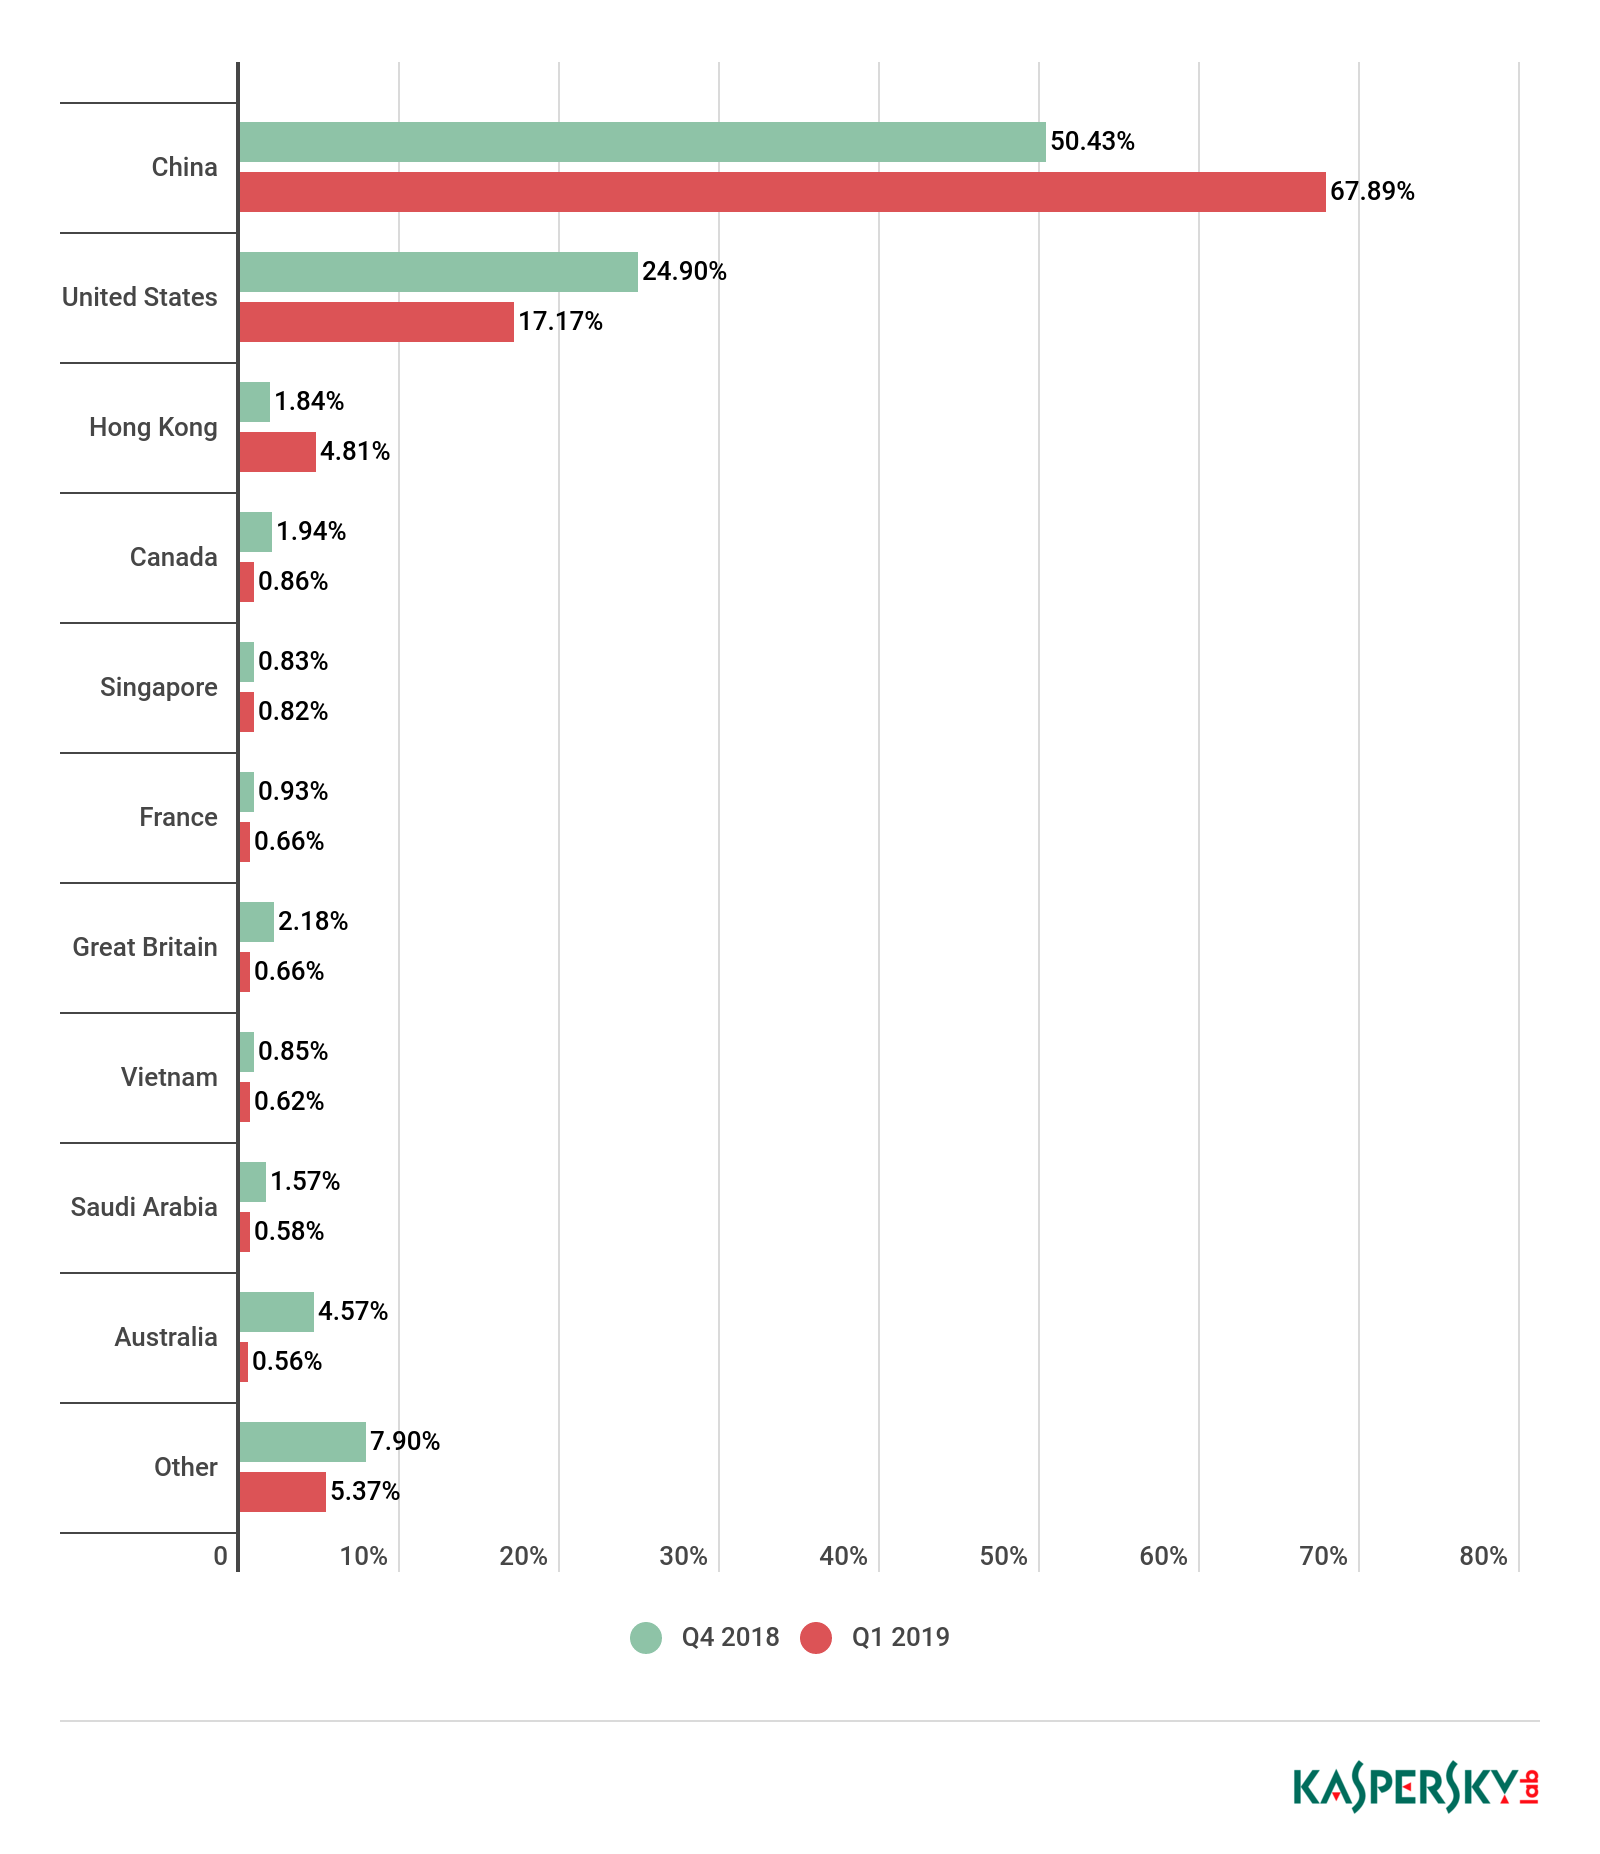
Distribution of DDoS attacks by country, Q4 2018 and Q1 2019
The results of the geographical distribution of targets are consistent with the geographical distribution of the attacks themselves: China is once again in first position (its share up from 43.26% to 59.85%), with the US in second (down from 29.14% to 21.28%) and Hong Kong in third (climbing from 1.76% to 4.21%).
Saudi Arabia dropped from fifth to sixth place, losing slightly more than 1 p.p. (its share decreased from 2.23% to 1.08%). Canada shed roughly the same amount (from 2.21% to 1.30%), yet rose from sixth to fourth place, while Britain’s more significant loss (from 2.73% to 1.18%) pushed it from fourth to fifth.
In the meantime, the Top 10 said goodbye to Australia and Brazil, which last quarter ranked third and eighth, respectively. They were replaced by Singapore, whose insignificant growth (from 0.72% to 0.94%) was enough to claim eighth place, and Poland, which saw its share nudge up from 0.33% to 0.90%, in ninth position. As before, the Top 10 was rounded off by Germany (0.77%).
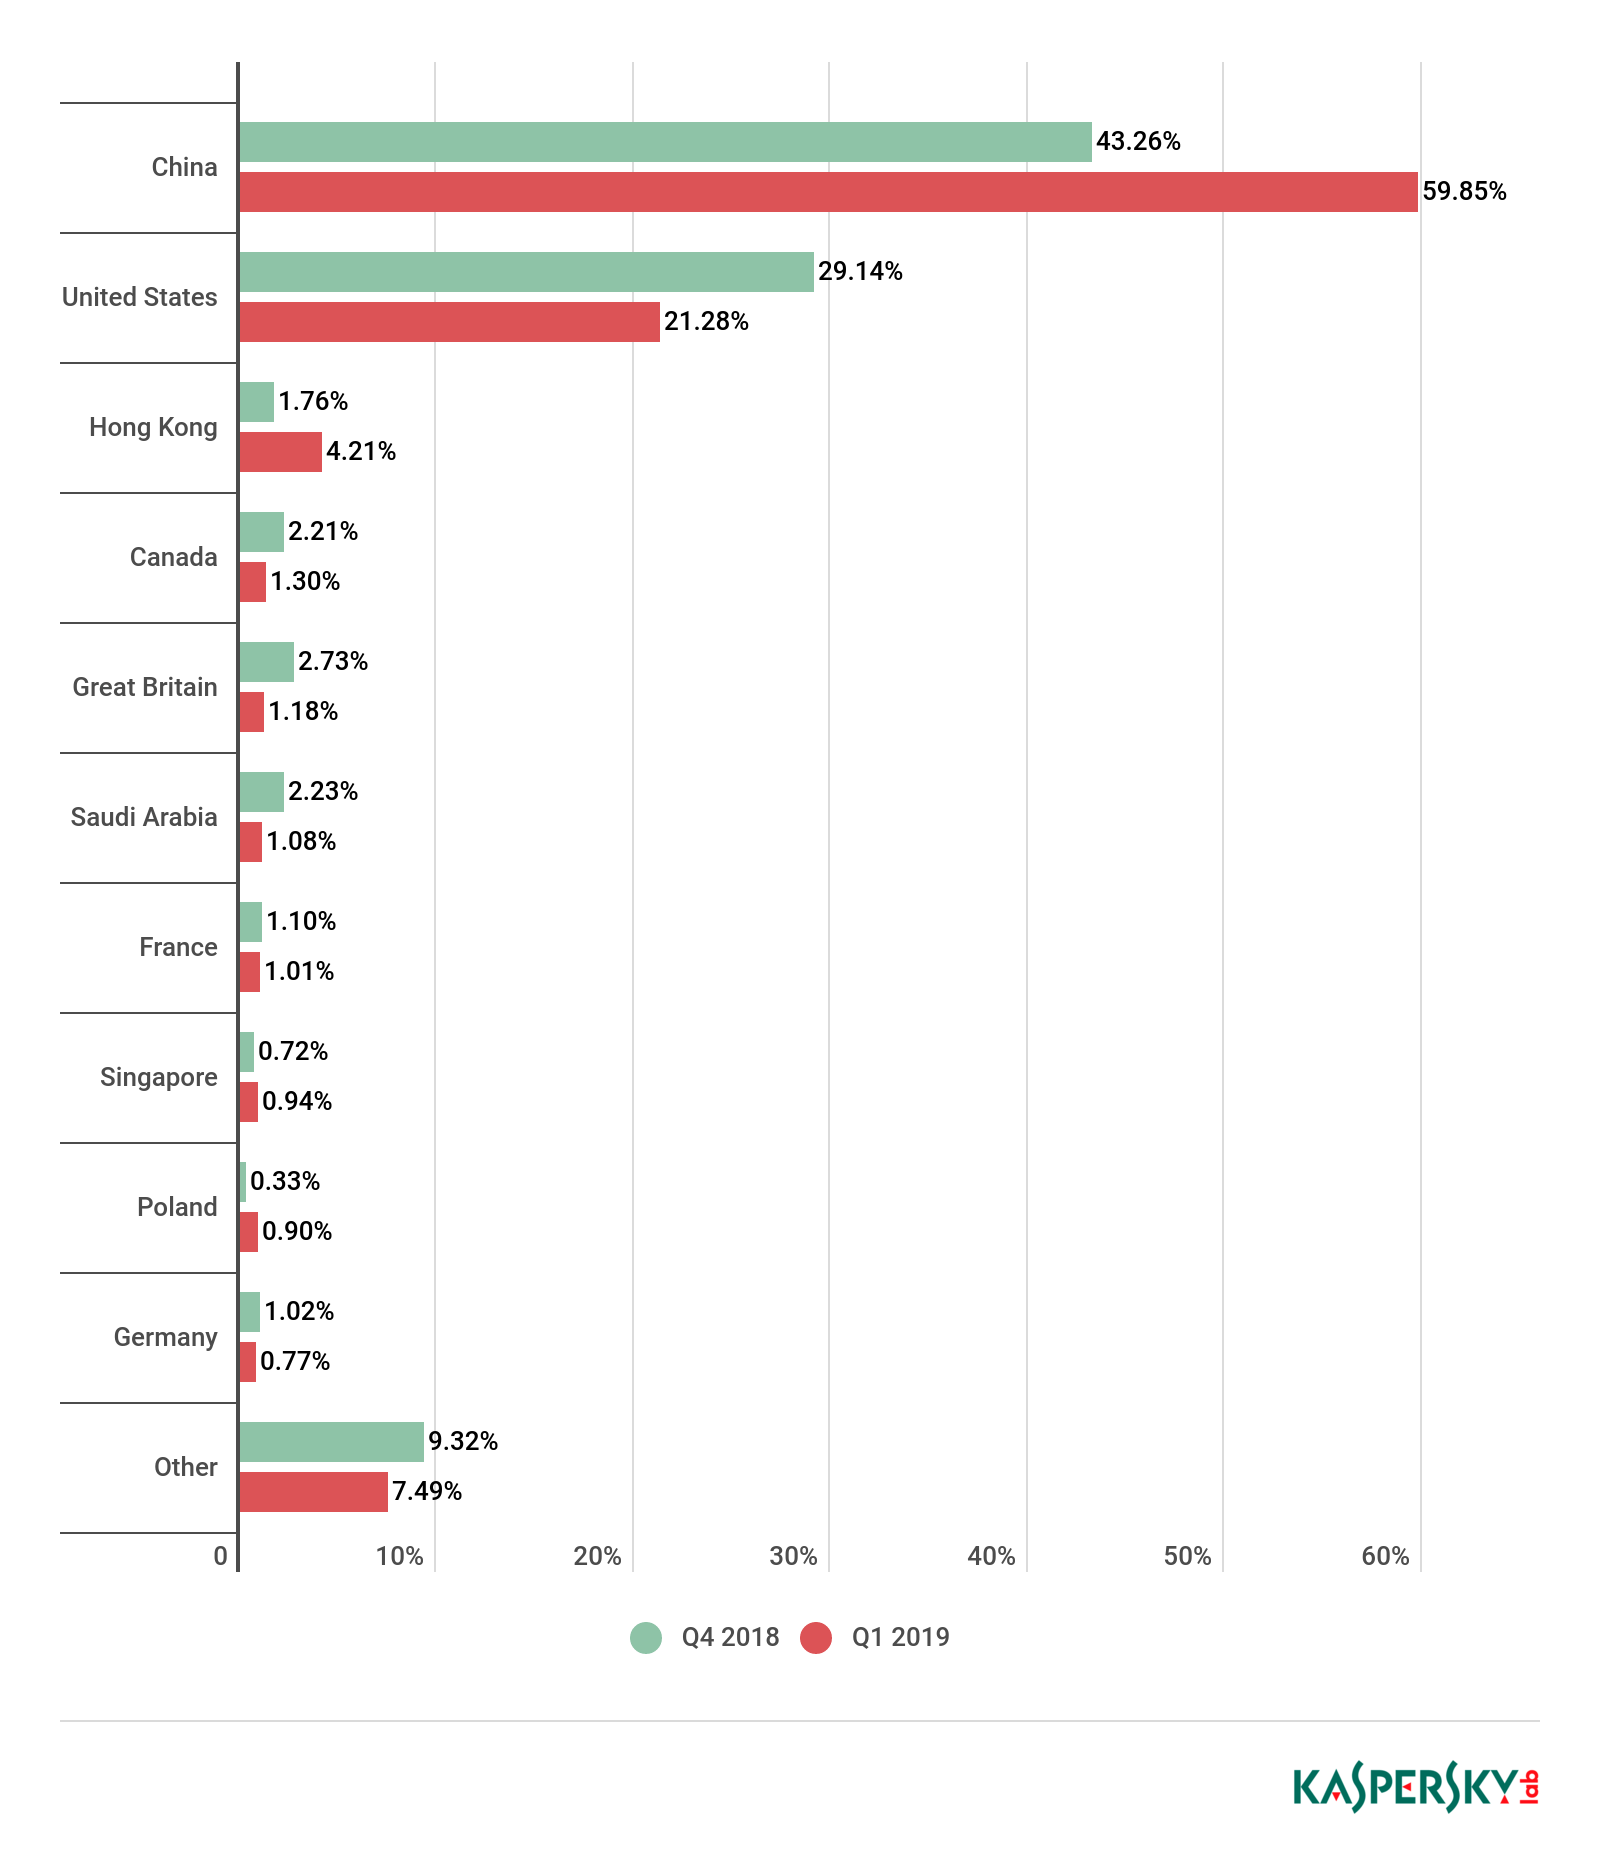
Distribution of unique DDoS-attack targets by country, Q4 2018 and Q1 2019
Dynamics of the number of DDoS attacks
In the last quarter, the most DDoS activity was observed in March, especially the second half. The highest peak was on March 16 (699 attacks). And a significant surge occurred on January 17, when we registered 532 attacks. Early January was calm as expected, with no prominent spikes or troughs; however, the quietest day of all was February 5 with a total of 51 attacks.
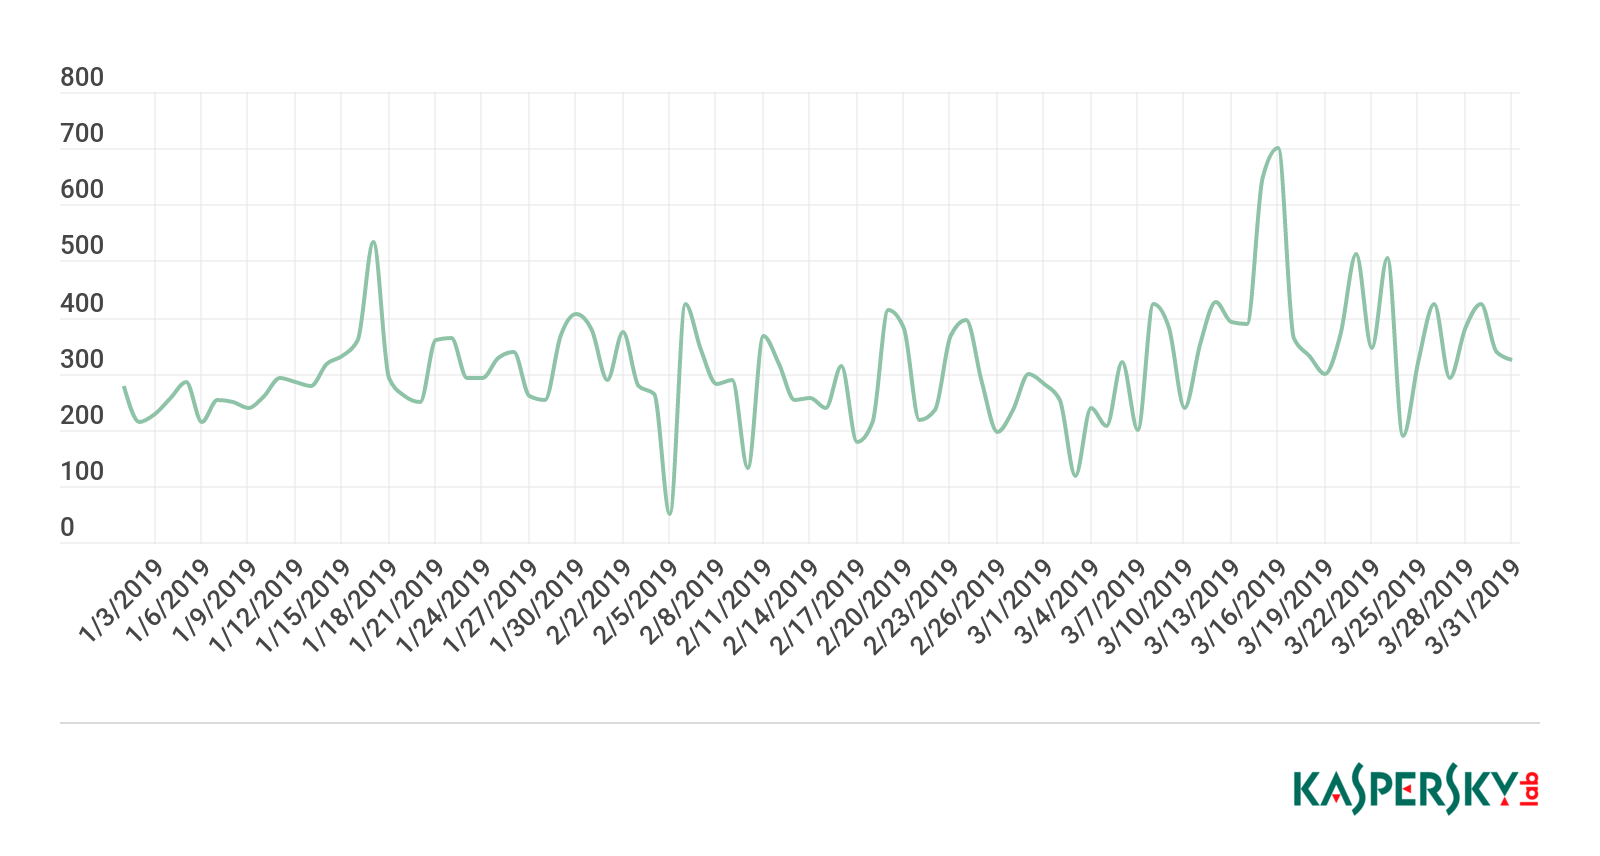
Dynamics of the number of DDoS attacks in Q1 2019
As for the distribution by day of the week, activity last quarter clearly shifted to the weekend: Saturday was the most intensive day (accounting for 16.65% of attacks), with Friday in second place (15.39%). Sundays saw a relative lull — just 11.41% of attacks. Recall that in late 2018 Thursday had the largest share of DDoS attacks (15.74%), with Sunday again the most peaceful.
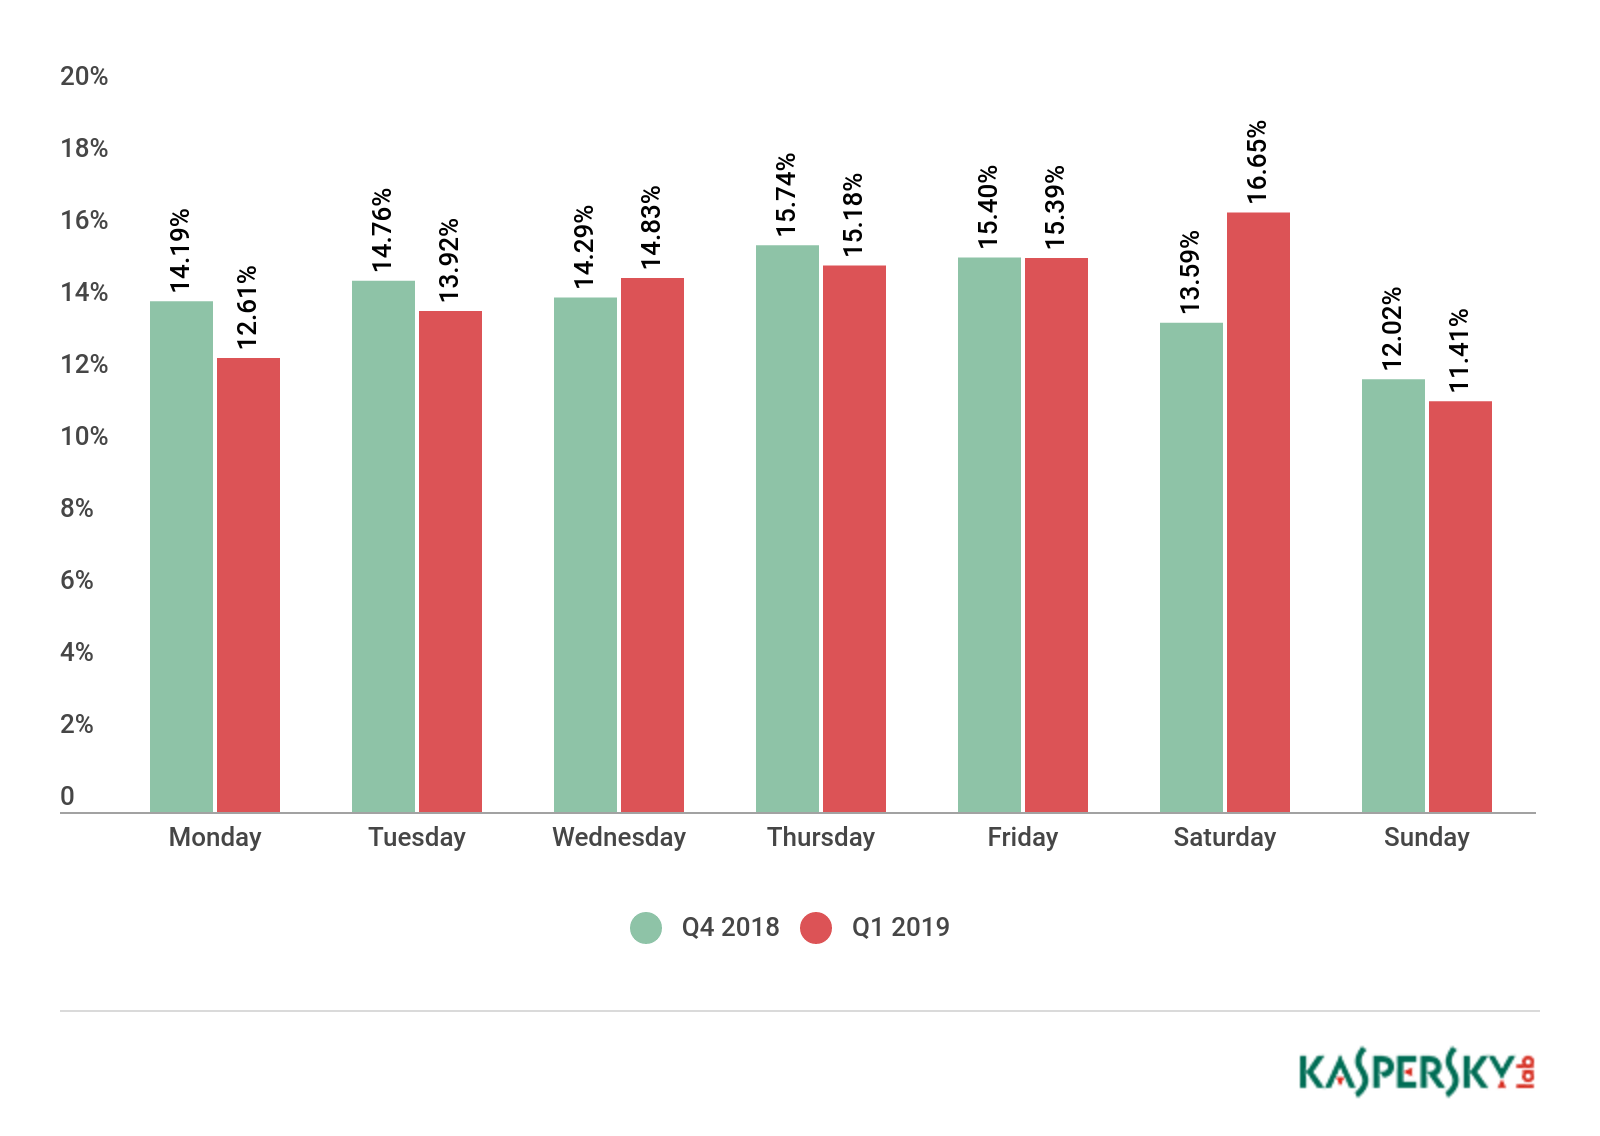
Distribution of DDoS attacks by day of the week, Q4 2018 and Q1 2019
Duration and types of DDoS attacks
In Q1, the share of sustained attacks almost doubled — from 0.11% to 0.21%. However, instead of lasting almost 14 days (329 hours) as in Q4 2018, the longest attack this quarter was just slightly more than 12 days (289 hours).
On top of that, the share of all attacks lasting more than five hours increased significantly: whereas at the end of 2018 it was 16.66%, now the figure stands at 21.34%. If this segment is sliced into smaller sections, as seen on the graph, most categories of long-duration attacks experienced a rise, while only the proportion of attacks lasting 100–139 hours decreased slightly (from 0.14% to 0.11%). Accordingly, the share of short-duration attacks fell by almost 5 p.p. to 78.66%.
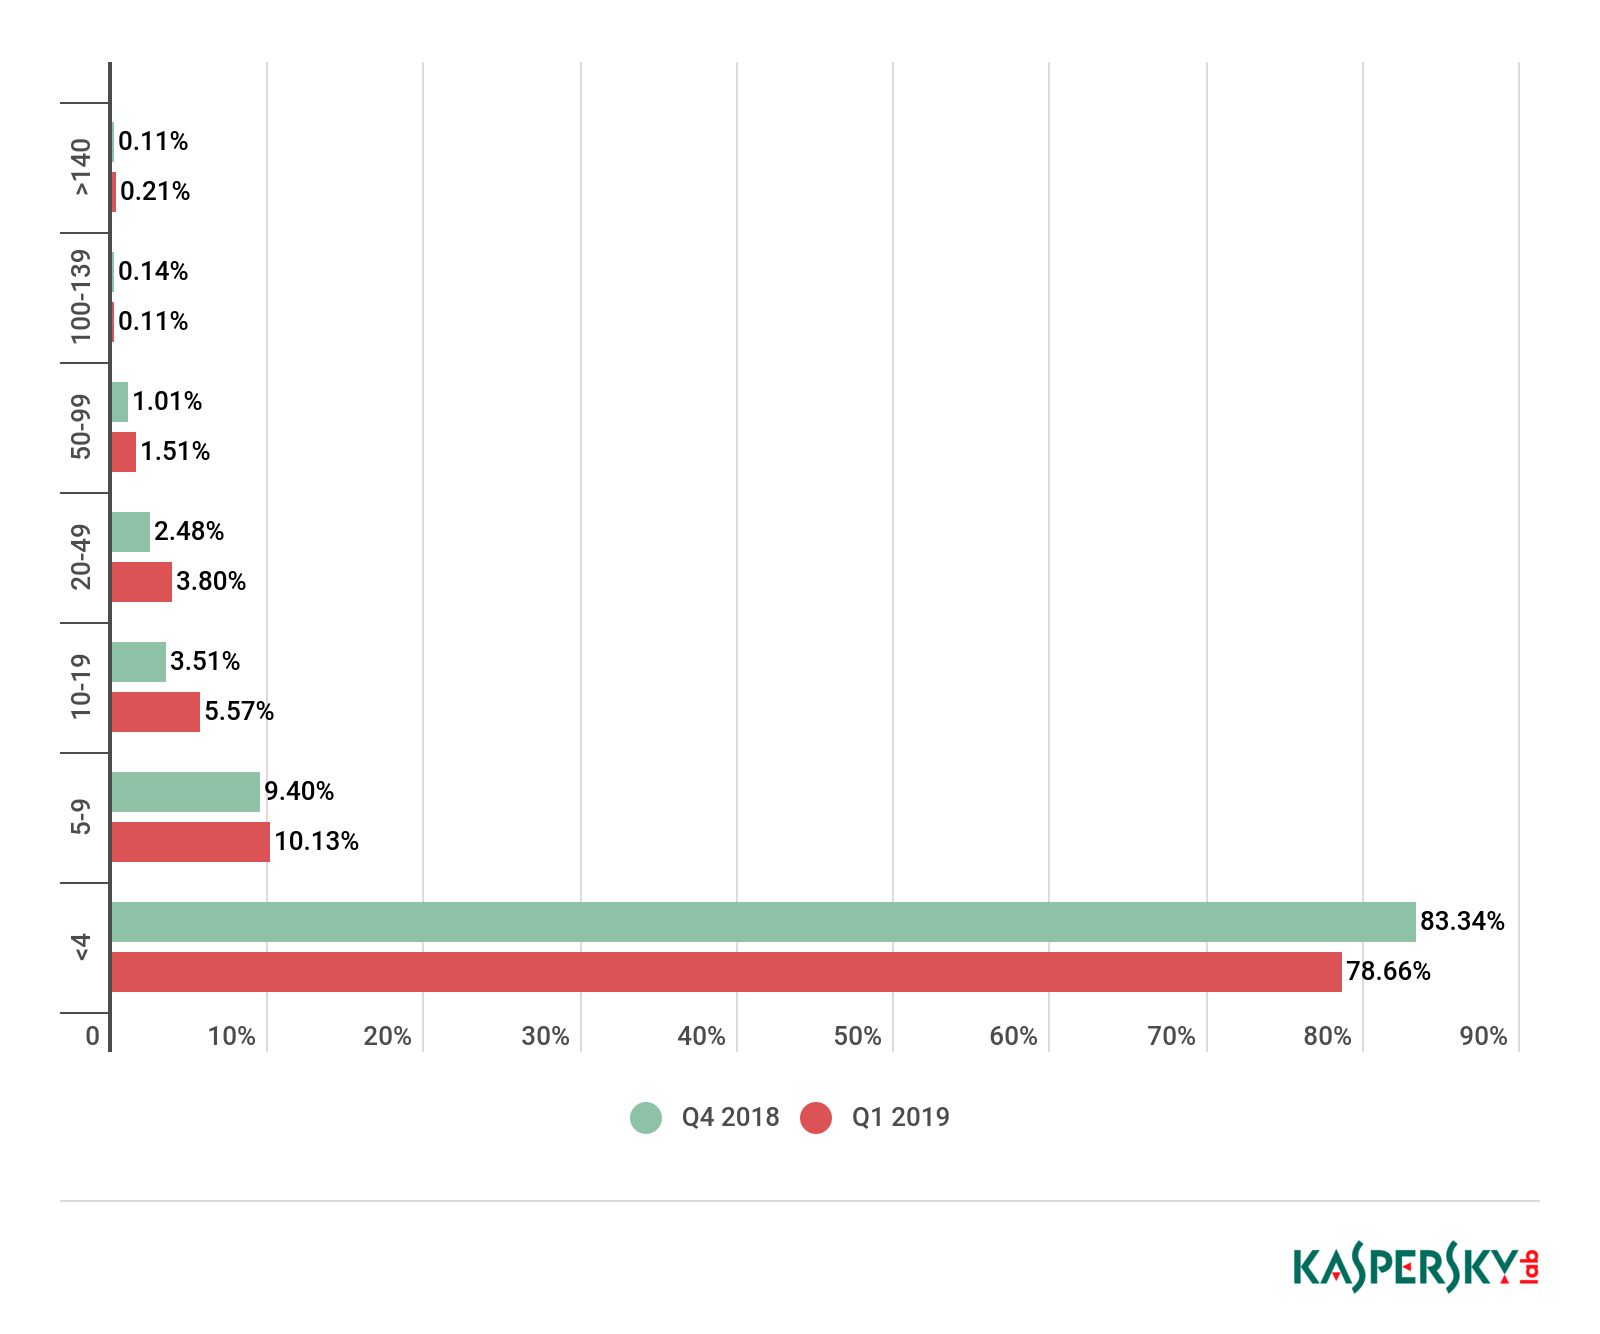
Distribution of DDoS attacks by duration (hours), Q4 2018 and Q1 2019
As in previous years, SYN flooding made up the lion’s share of junk traffic in Q1. Compared to Q4 2018, its share was even greater, climbing to 84.1%. Naturally, such a large rise (up from 58.2%, more than 20 p.p.) had an impact on the shares of other types of traffic.
For instance, UDP flooding, despite holding on to second spot, had a Q1 share of just 8.9% (down from 31.1%). The share of TCP flooding, previously ranked third, also dropped (from 8.4% to 3.1%), only good enough for fourth place behind HTTP flooding (which grew by 1.1 p.p. to 3.3%). ICMP traffic finished last as per tradition, despite its share rising from 0.1% to 0.6%.
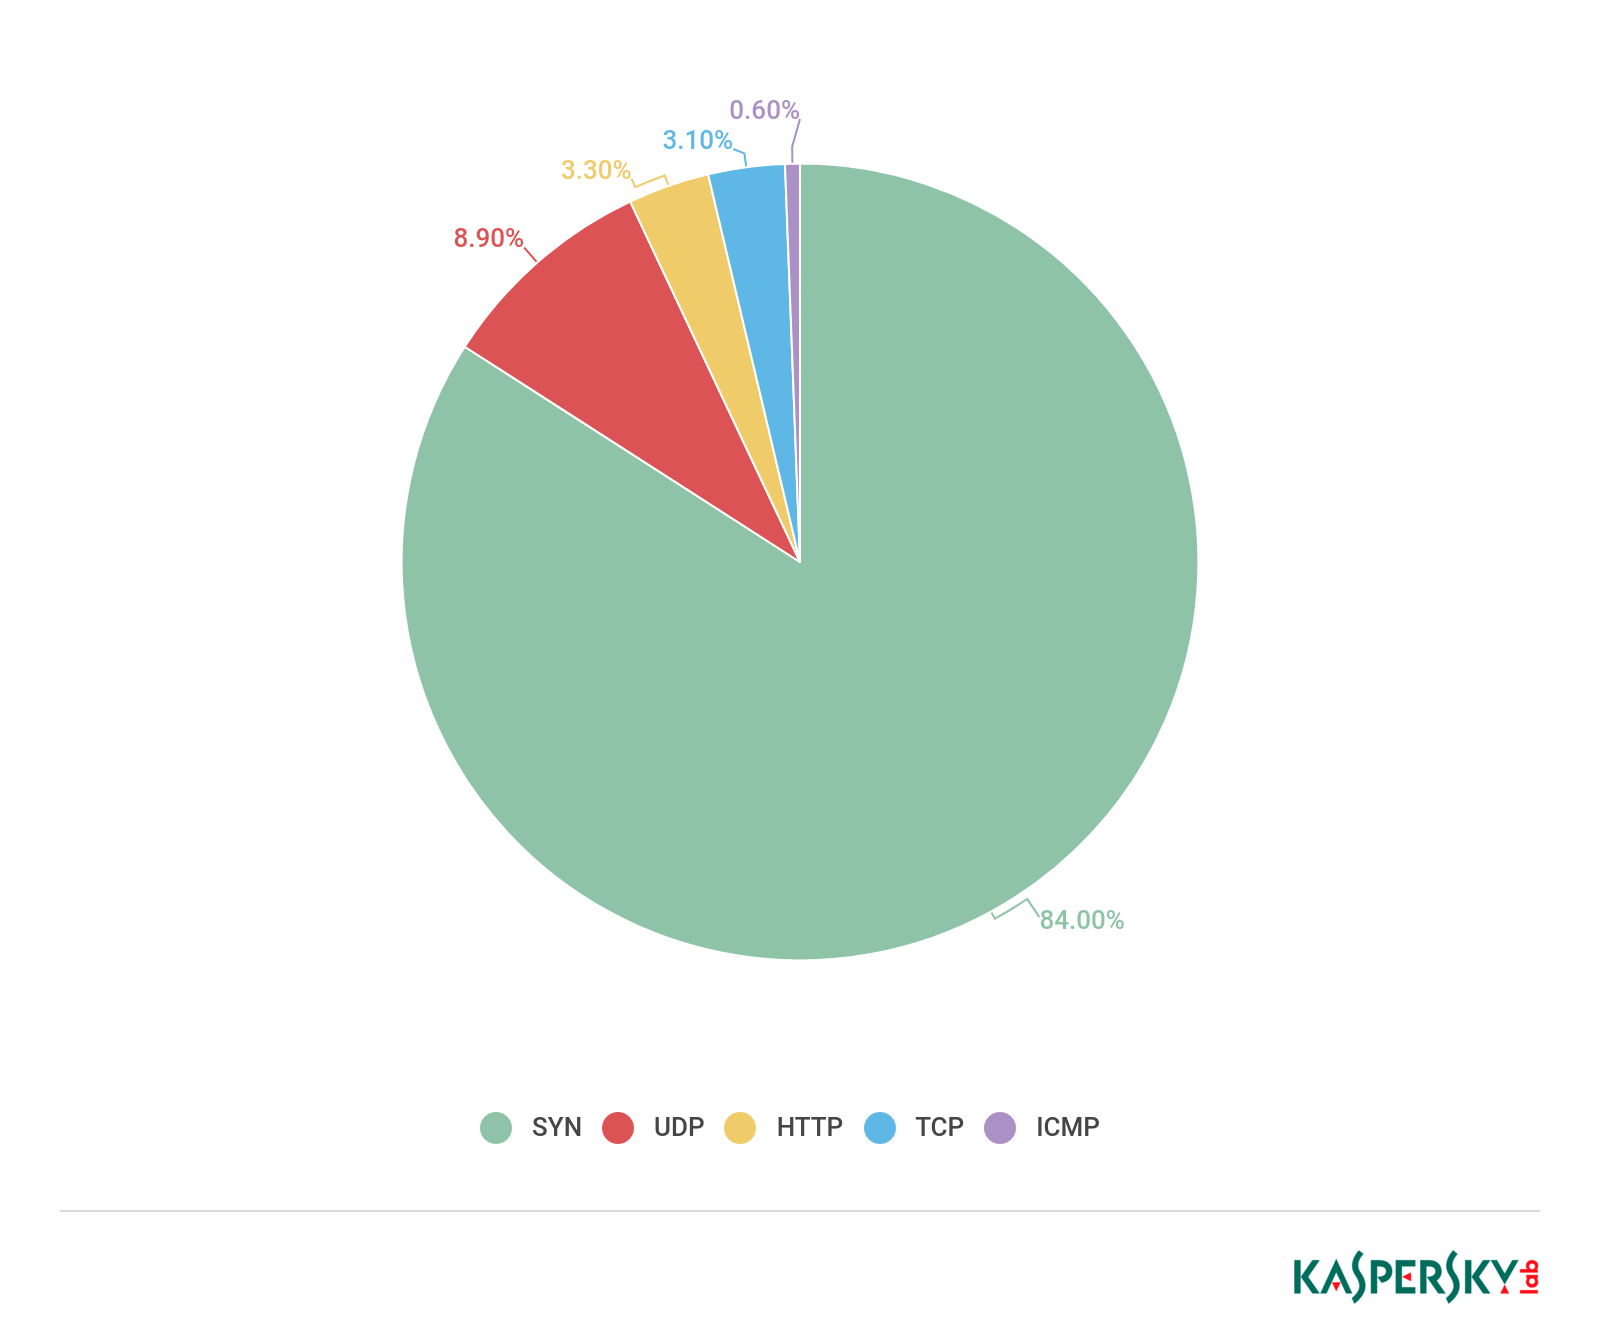
Distribution of DDoS attacks by type, Q1 2019
Linux botnets still vastly outnumber their Windows-based counterparts, although in Q1 2019 the gap closed slightly: Linux botnets now make up not 97.11% but 95.71% of the total, while the respective share of Windows botnets went up by approximately 1.5 p.p. to 4.29%. However, this is not because Windows devices are becoming more popular, but due to the declining number of C&C servers of the Mirai bot and its Darkai clone. As a result, the number of attacks by these bots decreased by three and seven times, respectively.
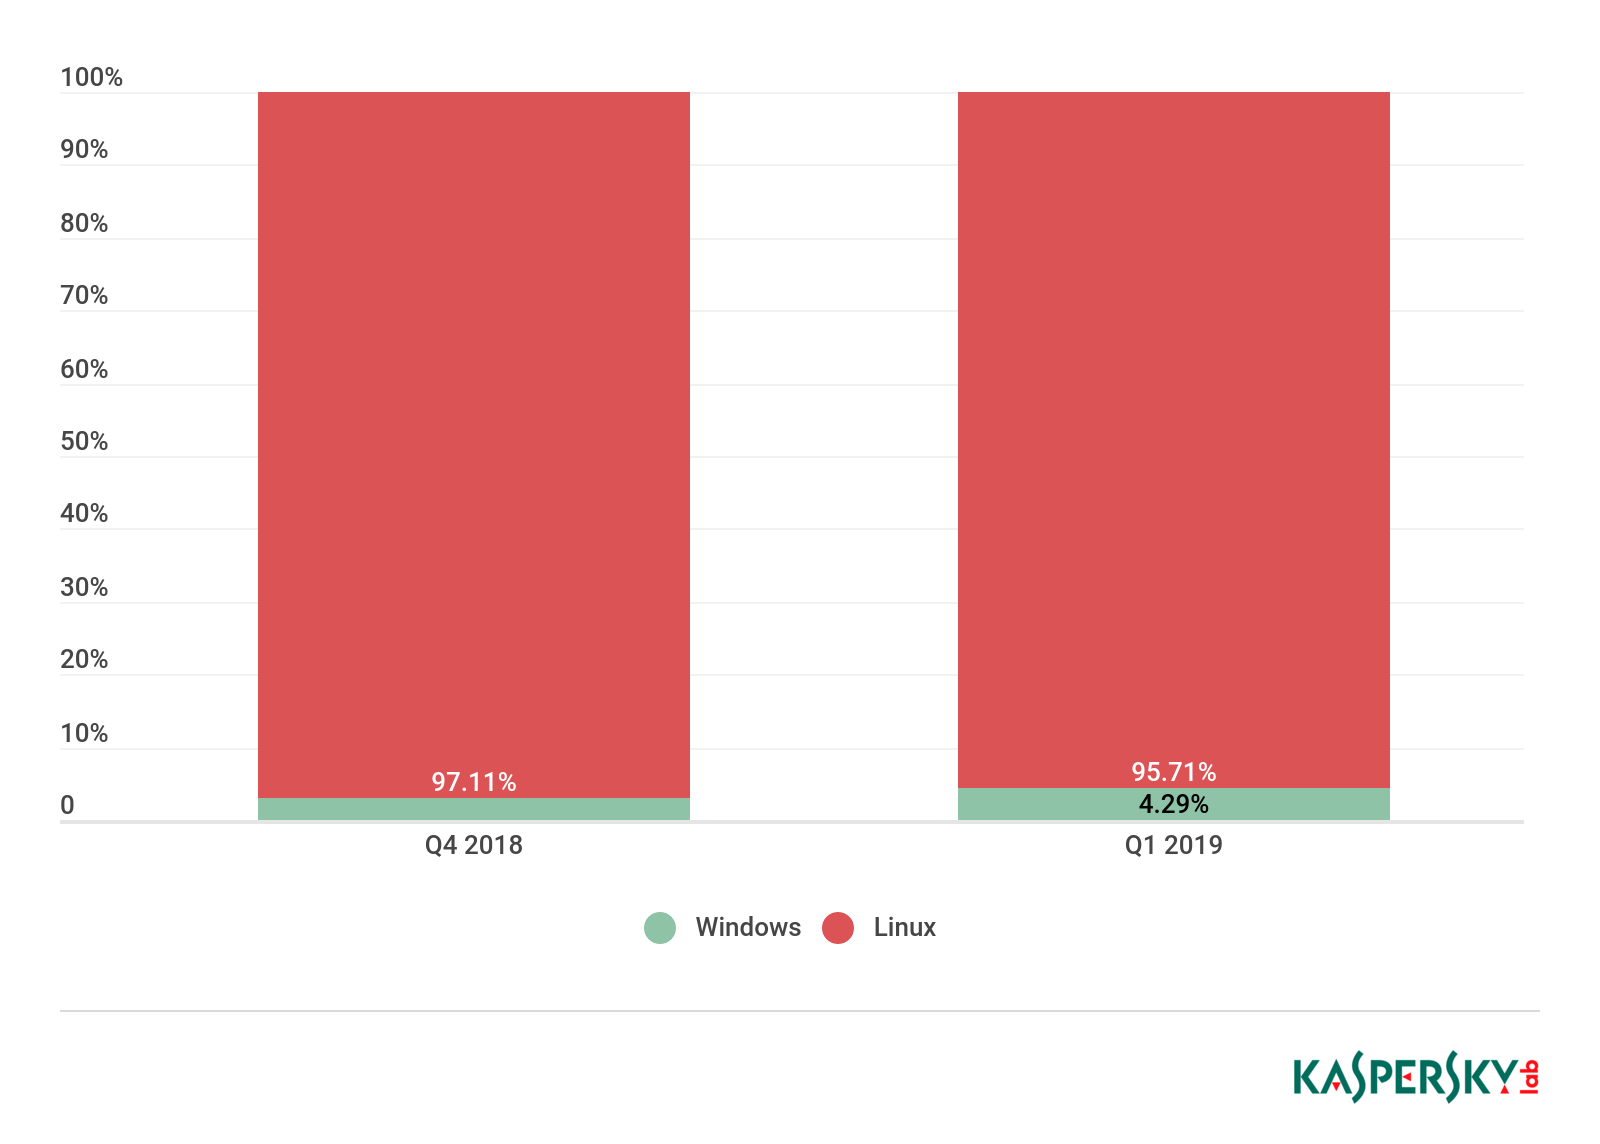
Ratio of Windows/Linux botnet attacks, Q4 2018 and Q1 2019
Botnet distribution geography
The leading country by number of botnets on its soil remains the US (34.10%). The Netherlands rose from third in Q4 2018 to second place (12.72%). Third place this time went to Russia (10.40%), which climbed all the way up from seventh. China (7.51%) rose from the foot of the ranking to fourth, just missing out on a return to the Top 3.
Greece and Germany, meanwhile, slipped out of the Top 10. They made room for Vietnam (4.05%) in seventh, and South Korea (2.31%). The latter only managed tenth place, despite previously having led this category for quite some time.
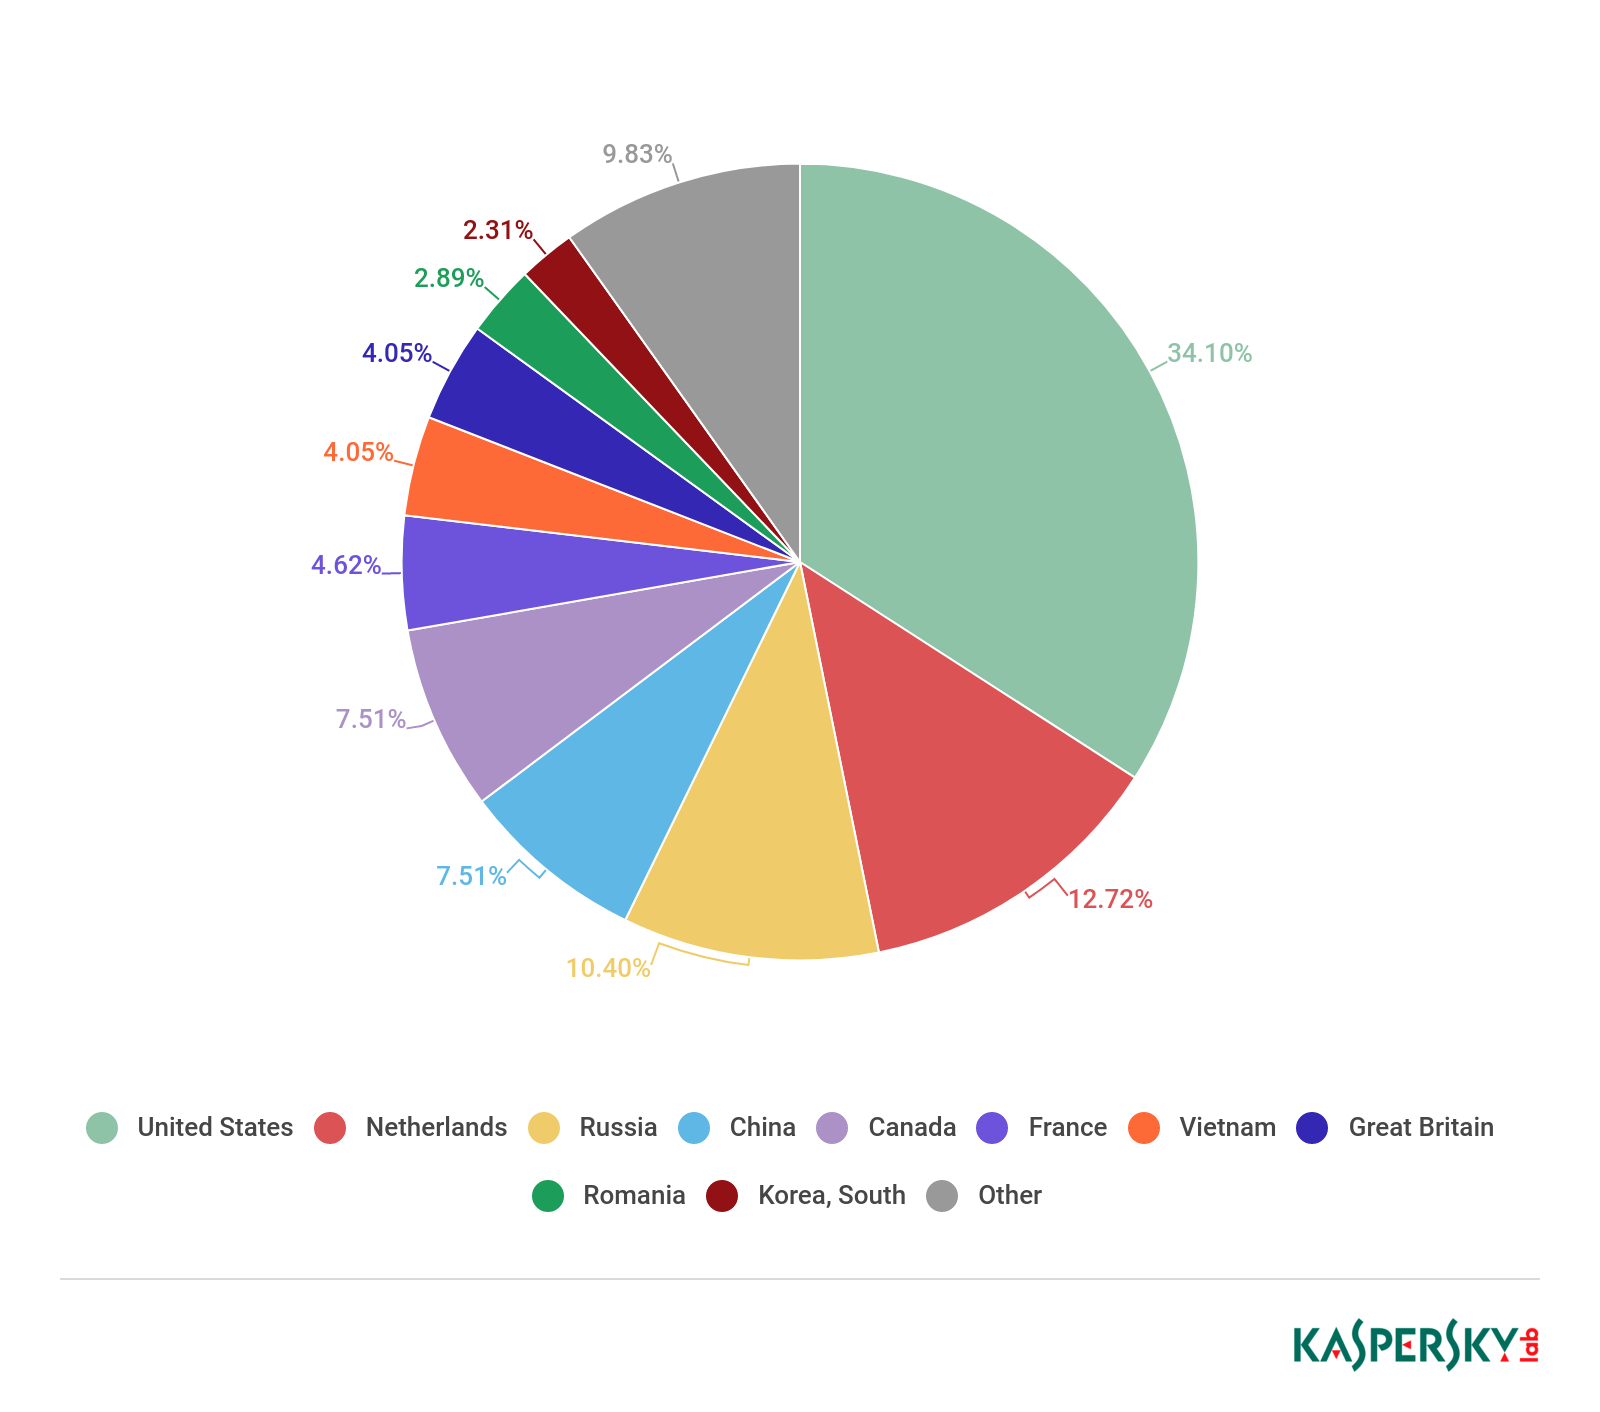
Distribution of botnet C&C servers by country, Q1 2019
Conclusion
In the previous three quarters, we saw some unexpected arrivals in several Top 10s — countries with no major track record as a source of DDoS threats suddenly asserted themselves. But Q1 2019 held no particular surprises, save for countries such as Saudi Arabia, the Netherlands, and Romania maintaining a high level of DDoS activity; in other words, their appearance in the Top 10s cannot be put down to random deviations. Meanwhile, cybercriminals previously based in South Korea seem to be in no hurry to reappear there. It is possible that we are witnessing the establishment of a new distribution of botnets by country.
Also worth noting is the significant decline in the botnet activity of Darkai, one of the Mirai clones: the number of attacks with its assistance decreased by seven times. Mirai itself was also hit hard, suffering a threefold drop in activity. This factor, among others, goes someway to explaining the certain decline in the number and duration of DDoS attacks.
From the same authors


In the same category


DDoS attacks in Q1 2019