
 Download PDF
![]() Download EPUB
Download EPUB
Download Full Report PDF
![]() Download Full Report EPUB
Download Full Report EPUB
All statistics used in this report were obtained using Kaspersky Security Network (KSN) a distributed antivirus network based on the work of various components of Kaspersky Lab’s anti-malware protection. The data was collected from KSN users who agreed to transfer it. Millions of Kaspersky Lab products users from 213 countries and territories worldwide participate in the global exchange of information about malicious activity.
The data presented covers the period from November 2013 to October 2014.
The year in figures
- According to KSN data, Kaspersky Lab products detected and neutralized a total of 6,167,233,068 threats during the reported period.
- A total of 3,693,936 attempts to infect Mac OS X- based computers were blocked by Kaspersky Lab products.
- Kaspersky Lab solutions blocked 1,363,549 attacks on Android-based devices.
- Kaspersky Lab solutions repelled 1,432,660,467 attacks launched from online resources located all over the world.
- To carry out their attacks, cybercriminals used 9,766,119 unique hosts.
- 44% of web attacks neutralized by Kaspersky Lab products were carried out using malicious web resources located in the US and Germany.
- 38% of user computers were subjected to at least one web attack over the year.
- A total of 1,910,520 attempts to launch banking malware on user computers were neutralized in 2014.
- Kaspersky Lab’s web antivirus detected 123,054,503 unique malicious objects: scripts, exploits, executable files, etc.
- Kaspersky Lab’s antivirus solutions detected a total of 1,849,949 unique malicious and potentially unwanted objects.
Mobile threats
During the reporting period Kaspersky Lab detected the following:
- 4,643,582 malicious installation packets
- 295,539 new malicious mobile programs
- 12,100 mobile banking Trojans
Overall from the beginning of November 2013 to the end of October 2014 Kaspersky Lab warded off 1,363,549 unique attacks. For the same period in 2012-2013 the figure was 335,000 unique attacks. There were four times as many attacks on Android devices compared with the previous 12 months.
19% of Android users encountered a mobile threat at least once during the year – nearly one in five users.
53% of Android-attacks used mobile Trojans designed to steal the user’s money (SMS Trojans and banking Trojans).
Geography of mobile threats
Attacks by malicious mobile software were recorded in more than 200 countries.

Percentage from total number of attacked users
TOP 10 countries by number of attacked users
| Country | % of attacked users* | |
| 1 | Russia | 45.7% |
| 2 | India | 6.8% |
| 3 | Kazakhstan | 4.1% |
| 4 | Germany | 4.0% |
| 5 | Ukraine | 3.0% |
| 6 | Vietnam | 2.7% |
| 7 | Iran | 2.3% |
| 8 | UK | 2.2% |
| 9 | Malaysia | 1.8% |
| 10 | Brazil | 1.6% |
*percentage of attacked users in the country from total number of attacked users
Russia maintained its leading position in terms of the number of users attacked.
The number of recorded attacks greatly depends on the number of users in a country. To evaluate the danger of infection by mobile malware in various countries we counted the percentage of malicious applications among the total number applications that users tried to install. This method produced very different results from those shown above.
TOP 10 countries by risk of infection
| Country* | % of malicious applications | |
| 1 | Vietnam | 2.34% |
| 2 | Poland | 1.88% |
| 3 | Greece | 1.70% |
| 4 | Kazakhstan | 1.62% |
| 5 | Uzbekistan | 1.29% |
| 6 | Serbia | 1.23% |
| 7 | Armenia | 1.21% |
| 8 | Czech Republic | 1.02% |
| 9 | Morocco | 0.97% |
| 10 | Malaysia | 0.93% |
* Countries where the number of downloaded applications was less than 100,000 were excluded from these results
Vietnam leads this rating: 2.34% of all applications that users tried to download were malicious.
Russia, which suffered by far the most attacks, was only 22nd in terms of risk of infection with 0.69%.
In Spain the risk of infection was 0.54%, in Germany 0.18% and in the UK 0.16%, in Italy 0.09% and in the USA 0.07%. The situation is best of all in Japan, where only 0.01% of all applications that users tried to install proved to be malicious.
TOP 20 mobile threats of 2014
| Name | % of attacks | |
| 1 | Trojan-SMS.AndroidOS.Stealer.a | 18.0% |
| 2 | RiskTool.AndroidOS.MimobSMS.a | 7.1% |
| 3 | DangerousObject.Multi.Generic | 6.9% |
| 4 | RiskTool.AndroidOS.SMSreg.gc | 6.7% |
| 5 | Trojan-SMS.AndroidOS.OpFake.bo | 6.4% |
| 6 | AdWare.AndroidOS.Viser.a | 5.9% |
| 7 | Trojan-SMS.AndroidOS.FakeInst.a | 5.4% |
| 8 | Trojan-SMS.AndroidOS.OpFake.a | 5.1% |
| 9 | Trojan-SMS.AndroidOS.FakeInst.fb | 4.6% |
| 10 | Trojan-SMS.AndroidOS.Erop.a | 4.0% |
| 11 | AdWare.AndroidOS.Ganlet.a | 3.8% |
| 12 | Trojan-SMS.AndroidOS.Agent.u | 3.4% |
| 13 | Trojan-SMS.AndroidOS.FakeInst.ff | 3.0% |
| 14 | RiskTool.AndroidOS.Mobogen.a | 3.0% |
| 15 | RiskTool.AndroidOS.CallPay.a | 2.9% |
| 16 | Trojan-SMS.AndroidOS.Agent.ao | 2.5% |
| 17 | Exploit.AndroidOS.Lotoor.be | 2.5% |
| 18 | Trojan-SMS.AndroidOS.FakeInst.ei | 2.4% |
| 19 | Backdoor.AndroidOS.Fobus.a | 1.9% |
| 20 | Trojan-Banker.AndroidOS.Faketoken.a | 1.7% |
10 out of the 20 programs in this rating are SMS Trojans from the following families: Stealer, OpFake, FakeInst, Agent and Erop.
Trojan-SMS.AndroidOS.Stealer.a were among the most widespread families throughout the year and finished up on top of the annual ranking by a considerable margin.
This SMS Trojan spread very actively. After May 2014 the number of Stealer attacks matched the total number of attacks involving all other SMS Trojans.
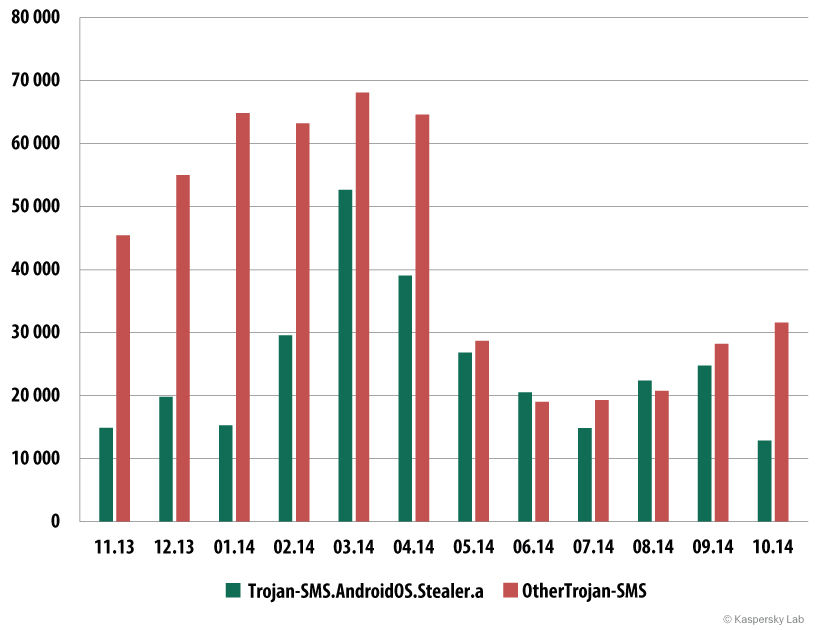
The number of users attacked with Trojan-SMS.AndroidOS.Stealer.a and all other SMS Trojans (November 2013 – October 2014)
Reduction in attacks by SMS Trojans
As before, SMS Trojans are the single biggest component in the flow of mobile malware; in our figures they have 23.9% of the total.

Distribution of mobile threats by type (Kaspersky Lab collection)
However, as the above diagram shows, in the second half of 2014 there were fewer attacks with SMS Trojans. As a result for the year their amount reduced by 12.3%.
Let’s look in a bit more detail at the change in distribution of the SMS Trojans that are most popular with cybercriminals (other than Stealer.a).
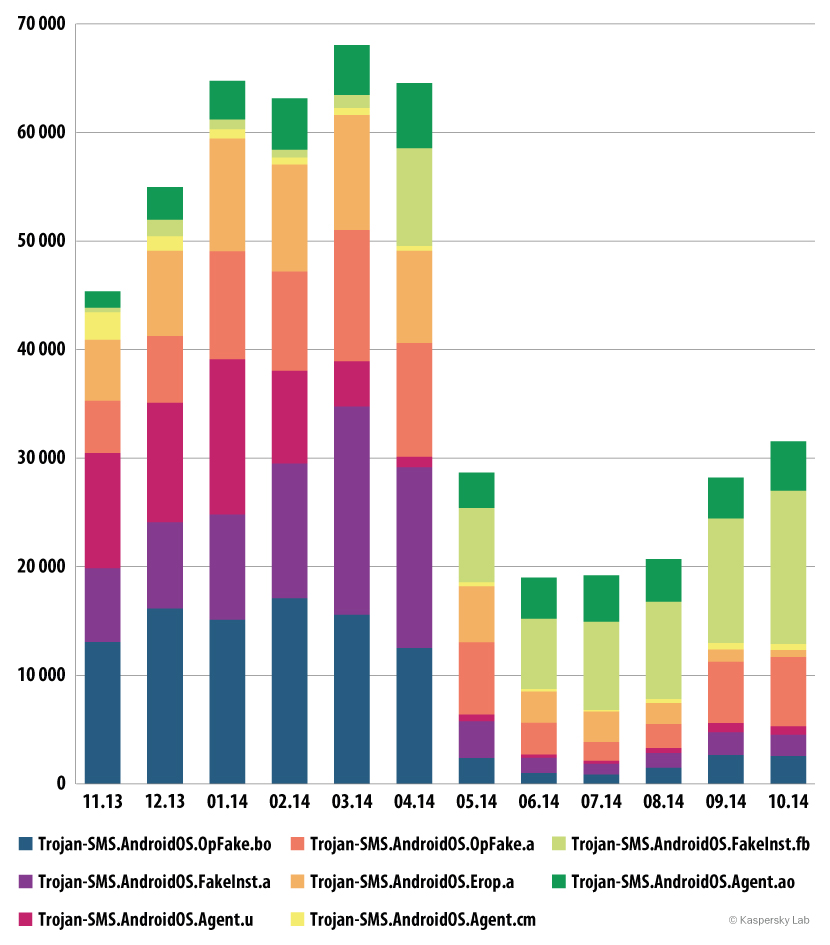
Number of users attacked by popular SMS Trojans (November 2013 — October 2014)
May saw a sharp fall in the number of SMS Trojans detected in Russia, where attacks with the use of SMS Trojans are particularly widespread. The fall was caused by a change in the way paid messages work in Russia. In May 2014 mobile operators in Russia were forced to use an Advice of Charge (AoC) mechanism. Now when a mobile device sends a message to a paid number the operator must inform the device owner of the cost of the service and get confirmation of the payment.
As a result, SMS Trojans are less profitable and their criminal nature is clearly exposed. Now the only way to make a profit is to use Trojans that can send an SMS to a premium rate number and then intercept the operator’s request and return a confirmation on behalf of the user.
As a result partners in several semi-legal programs, which had earlier distributed applications with SMS Trojan functionality, left this business. Their operating model had been based on badly explained conditions for the provision of paid services, or subscription and service charges that were simply not indicated.
We can assume that Russian creators of SMS Trojans who found themselves out of work will have to look for new projects. Some of them might switch to attacking users in other countries and some to working on more serious malware such as banking programs. Hopefully at least some of them will turn their backs on the underworld and will put their skills to lawful use.
The changes in distribution patterns are clearly visible with once-popular SMS trojans like OpFake.bo, FakeInst.a and OpFake.a. They used to be seen in 10-20,000 attacks a month; now the numbers are 1-2,000.
Mobile banking Trojans
During the period in question we detected 12,100 mobile banking Trojans — nine times as many as than in 2013.

Number of mobile banking Trojans in the Kaspersky Lab collection (November 2013 — October 2014)
45,032 users were attacked with mobile banking Trojans at least once in the course of the year.
And the number of countries under attack is growing: at least one attack using a mobile banking Trojan was recorded in 90 different countries worldwide.

Geography of mobile banking threats (number of attacked users in the period November 2013 — October 2014)
TOP 10 countries for banking Trojan attacks
| Country | Number of attacked users | % of all attacks* | |
| 1 | Russia | 39,561 | 87.85% |
| 2 | Kazakhstan | 1,195 | 2.65% |
| 3 | Ukraine | 902 | 2.00% |
| 4 | USA | 831 | 1.85% |
| 5 | Belorus | 567 | 1.26% |
| 6 | Germany | 203 | 0.45% |
| 7 | Lithuania | 201 | 0.45% |
| 8 | Azeraijan | 194 | 0.43% |
| 9 | Bulgaria | 178 | 0.40% |
| 10 | Uzbekistan | 125 | 0.28% |
* Percentage of attacked users in each country from the total all attacked users
Russia has retained its place as the leader in this rating.
Threats designed for Mac OS X
In 2014 Kaspersky Lab security products designed to protect Mac OS X-based computers blocked 3,693,936 infection attempts.
Kaspersky Lab experts detected 1,499 new malicious programs for Mac OS X, 200 samples more than in the previous year.
Every second user of Kaspersky Lab products was exposed to a malicious attack.
An average Mac user encountered 9 threats during the year.
TOP 20 threats designed for Mac OS X
| Name | % of attacks* | |
| 1 | AdWare.OSX.Geonei.b | 9.04% |
| 2 | Trojan.Script.Generic | 5.85% |
| 3 | Trojan.OSX.Vsrch.a | 4.42% |
| 4 | Trojan.Script.Iframer | 3.77% |
| 5 | AdWare.OSX.Geonei.d | 3.43% |
| 6 | DangerousObject.Multi.Generic | 2.40% |
| 7 | AdWare.OSX.Vsrch.a | 2.18% |
| 8 | Trojan.Win32.Generic | 2.09% |
| 9 | AdWare.OSX.FkCodec.b | 1.35% |
| 10 | Trojan.OSX.Yontoo.i | 1.29% |
| 11 | Trojan-PSW.Win32.LdPinch.ex | 0.84% |
| 12 | AdWare.Win32.Yotoon.heur | 0.82% |
| 13 | Trojan.OSX.Yontoo.j | 0.80% |
| 14 | Exploit.Script.Generic | 0.76% |
| 15 | AdWare.OSX.Bnodlero.a | 0.58% |
| 16 | AdWare.JS.Agent.an | 0.57% |
| 17 | Trojan.OSX.Yontoo.h | 0.52% |
| 18 | Exploit.PDF.Generic | 0.51% |
| 19 | AdWare.Win32.MegaSearch.am | 0.50% |
| 20 | Trojan.Win32.AutoRun.gen | 0.43% |
* The percentage of users attacked by the malicious program of all attacked users
Almost half of our TOP 20 programs, including the one in first place, were occupied by AdWare programs. As a rule, these malicious programs arrive on users’ computers alongside legitimate programs if they are downloaded from a software store rather than from the official website of the developer. These legitimate programs might become a carrier for the AdWare-module: once installed on the user’s computer it can add advertising links to browser bookmarks, change the default search engine, add contextual advertising, etc.
Interestingly, 8th place is occupied by Trojan.Win32.Generic which affects Windows OS. This is probably because this particular Trojan can penetrate into virtual machines that run under Windows.
In 2014 the experts detected several interesting malicious programs for Mac OS X that should be mentioned separately.
- Backdoor.OSX.Callme – a backdoor that provides the fraudster with remote access to the system and at the same time steals contact lists, apparently, to find new victims. It is distributed in the body of a specially designed MS Word document: when run it installs the backdoor via the vulnerability in the system.
- Backdoor.OSX.Laoshu – a malicious program which makes screenshots every minute. This backdoor is signed by the trusted certificate of the developer which means the creators of the program were about to place it in the AppStore.
- Backdoor.OSX.Ventir – a multi-module Trojan spy with a hidden remote control function. It includes the keystrokes interception driver logkext, the source code for which is publicly available.
- Trojan.OSX.IOSinfector – used to install the mobile version of Trojan-Spy.IPhoneOS.Mekir (OSX/Crisis).
- Trojan-Ransom.OSX.FileCoder – the first file coder for OS X. It is a conditionally working prototype produced by an author who, for whatever reason, decided to abandon malware development.
- Trojan-Spy.OSX.CoinStealer – the first malicious program designed to steal bitcoins for OS X. It imitates different bitcoin utilities built from open source code while it installs a malicious browser extension and/or a patched version of bitcoin-qt.
- Trojan-Downloader.OSX.WireLurker – an unusual piece of malware designed to steal victims’ data. It attacks not only Mac-based computers but iOS-based devices connected to them. There is also a Windows-based version of this malicious program. It is distributed via a well-known Chinese store that sells apps for OS X and iOS.
The geography of threats

The geography of attacks on Mac OS X users in 2014 (based on the number of all attacked users)
The TOP 10 of countries under attack
| Country | Number of attacked users | % of all attacks* | |
| 1 | USA | 98,077 | 39.14% |
| 2 | Germany | 31,466 | 12.56% |
| 3 | Japan | 13,808 | 5.51% |
| 4 | UK | 13,763 | 5.49% |
| 5 | Russia | 12,207 | 4.87% |
| 6 | France | 9,239 | 3.69% |
| 7 | Switzerland | 6,548 | 2.61% |
| 8 | Canada | 5,841 | 2.33% |
| 9 | Brazil | 5,558 | 2.22% |
| 10 | Italy | 5,334 | 2.13% |
* The percentage of users attacked per country
The USA (39.14%) tops this rating, perhaps because of the popularity of Apple computers in the country. Germany (12.56%) came second followed by Japan (5.51%).
Vulnerable applications used by fraudsters
The graph of vulnerable applications shown below is based on information about the exploits blocked by our products. These exploits were used by hackers in Internet attacks and when compromising local applications, including those installed on mobile devices.

The distribution of exploits used by fraudsters, by type of application attacked, 2014
In 2014, the fraudsters most often exploited Oracle Java vulnerabilities. However, the popularity of Java vulnerabilities declined steadily throughout the year, and its overall share was less than half of last year’s figure – 45% against 90.5% 12 months ago. This might be due to the closure of old vulnerabilities and a lack of information about any new ones.
Second place was occupied by the Browsers category (42%) which includes exploits for Internet Explorer, Google Chrome, Mozilla Firefox, etc. According to the quarterly ratings, for much of 2014 this was the leading category but it didn’t quite outstrip the large number of Java exploits in late 2013 and early 2014.
Adobe Reader exploits were in third place (5%). These vulnerabilities are exploited in drive-by attacks via the Internet, and PDF exploits form part of many exploit packs.
During the year, we saw a decrease in the number of attacks using exploit packs. There may be several reasons for this, including the arrests of some of their developers. In addition, many exploit packs have stopped attacking computers protected by Kaspersky Lab products (exploit packs check the victim computer and halt the attack if a Kaspersky Lab solution is installed on it). Despite this, exploitation of vulnerabilities remains one of the main ways to deliver malicious software on the user’s computer.
Online threats (Web-based attacks)
The statistics in this section were derived from web antivirus components that protect Windows users when malicious code attempts to download from a malicious/infected website. Malicious websites are deliberately created by cybercriminals; infected sites include those with user-contributed content (such as forums) as well as legitimate resources that have been hacked
In 2014, there were 1,432,660,467 attacks launched from online resources #KLReport
Tweet
In 2014, there were 1,432,660,467 attacks launched from online resources located all over the world. It means that Kaspersky Lab products protected users an average of 3,925,097 times per day during their Internet sessions.
The main attack method – via exploit packs – gives attackers an almost guaranteed opportunity to infect the user computer if it is not protected with a security solution and if it has at least one popular and vulnerable (not updated) application installed.
Online threats in the banking sector
During the reporting period, Kaspersky Lab solutions blocked 1,910,520 attacks attempting to launch malware capable of stealing money from online banking accounts.

The number of computers attacked by financial malware, November 2013-October 2014
Noticeably, the number of attacks grew considerably in May and June 2014. This might have been be caused by an increase in online banking activity at the beginning of the holiday season as well as by the main sport event of the year – the World Cup-2014 in Brazil – where cybercriminals used financial malware to steal tourists’ payment data.
A total of 16,552,498 notifications of malicious activity by programs designed to steal money via online access to bank accounts were registered by Kaspersky Lab security solutions in 2014.
The geography of attacks

The geography of banking malware attacks in 2014
The TOP 20 countries by the number of attacked users:
| Country | Number of attacked users | |
| 1 | Brazil | 299,830 |
| 2 | Russia | 251,917 |
| 3 | Germany | 155,773 |
| 4 | India | 98,344 |
| 5 | USA | 92,224 |
| 6 | Italy | 88,756 |
| 7 | UK | 54,618 |
| 8 | Vietnam | 50,040 |
| 9 | Austria | 44,445 |
| 10 | Algeria | 33,640 |
The TOP 10 banking malware families
The table below shows the programs most commonly used in 2014 to attack online banking users, based on the number of reported infection attempts:
| Name | Number of attacked users | |
| 1 | Trojan-Spy.Win32.Zbot | 742,794 |
| 2 | Trojan-Banker.Win32.ChePro | 192,229 |
| 3 | Trojan-Banker.Win32.Lohmys | 121,439 |
| 4 | Trojan-Banker.Win32.Shiotob | 95,236 |
| 5 | Trojan-Banker.Win32.Agent | 83,243 |
| 6 | Trojan-Banker.AndroidOS.Faketoken | 50,334 |
| 7 | Trojan-Banker.Win32.Banker | 41,665 |
| 8 | Trojan-Banker.Win32.Banbra | 40,836 |
| 9 | Trojan-Spy.Win32.SpyEyes | 36,065 |
| 10 | Trojan-Banker.HTML.Agent | 19,770 |
Zeus (Trojan-Spy.Win32.Zbot) remained the most widespread banking Trojan. It kept its leading position in quarterly ratings so its 1st place in the TOP 10 for 2014 is not a surprise. Second came Trojan-Banker.Win32.ChePro, followed by Trojan-Banker.Win32.Lohmys. Both families have the same functionality and are spread via spam messages with a theme related to online banking (for example, an invoice from an online banking service). The email includes a Word document with the attached picture: clicking on the picture launches malicious code execution.
Trojan-Banker.Win32.Shiotob was in 4th place. This malicious program is most often spread via spam messages and is designed to monitor traffic in order to intercept payment data.
The majority of the Top 10 malicious programs work by injecting random HTML code in the web page displayed by the browser and intercepting any payment data entered by the user in the original or inserted web forms.
Although three quarters of attacks targeting users’ money were carried out with the help of banking malware these are not the only financial threats.

Distribution of attacks targeting user money by malware type, 2014
Bitcoin wallet theft was the second most popular banking threat (14%). Yet another threat related to crypto currency is Bitcoin mining software (10%) which uses computing resources to generate bitcoins.
The TOP 20 malicious objects detected online
In 2014, Kaspersky Lab’s web antivirus detected 123,054,503 unique malicious objects: scripts, exploits, executable files, etc.
We identified the 20 malicious programs most actively involved in online attacks launched against computers in 2014. These 20 accounted for 95.8% of all online attacks.
| Name* | % of all attacks** | |
| 1 | Malicious URL | 73.70% |
| 2 | Trojan.Script.Generic | 9.10% |
| 3 | AdWare.Script.Generic | 4.75% |
| 4 | Trojan.Script.Iframer | 2.12% |
| 5 | Trojan-Downloader.Script.Generic | 2.10% |
| 6 | AdWare.Win32.BetterSurf.b | 0.60% |
| 7 | AdWare.Win32.Agent.fflm | 0.41% |
| 8 | AdWare.Win32.Agent.aiyc | 0.38% |
| 9 | AdWare.Win32.Agent.allm | 0.34% |
| 10 | Adware.Win32.Amonetize.heur | 0.32% |
| 11 | Trojan.Win32.Generic | 0.27% |
| 12 | AdWare.Win32.MegaSearch.am | 0.26% |
| 13 | Trojan.Win32.AntiFW.b | 0.24% |
| 14 | AdWare.JS.Agent.an | 0.23% |
| 15 | AdWare.Win32.Agent.ahbx | 0.19% |
| 16 | AdWare.Win32.Yotoon.heur | 0.19% |
| 17 | AdWare.JS.Agent.ao | 0.18% |
| 18 | Trojan-Downloader.Win32.Generic | 0.16% |
| 19 | Trojan-Clicker.JS.Agent.im | 0.14% |
| 20 | AdWare.Win32.OutBrowse.g | 0.11% |
* These statistics represent detection verdicts from the web antivirus module. Information was provided by users of Kaspersky Lab products who consented to share their local data
** The percentage of all web attacks recorded on the computers of unique users
As is often the case, the TOP 20 is largely made up of objects used in drive-by attacks, as well as adware programs. 73.7% of all verdicts identified links from these black lists.
Noticeably, in 2014 there was an increase in the number of advertising programs in the TOP 20, up from 5 to 12 compared to the previous year and accounting for 8.2% of all malicious objects detected online (+7.01 percentage points). The growth in the amount of advertising programs, along with their aggressive distribution schemes and their efforts to counteract anti-virus detection, has become the trend of 2014.
In 2014, #Kaspersky Lab’s web antivirus detected 123,054,503 unique malicious objects #KLReport
Tweet
The Trojan-Clicker.JS.Agent.im verdict is also connected to advertising and all sorts of “potentially unwanted” activities. This is how scripts placed on Amazon Cloudfront to redirect users to pages with advertising content are detected. Links to these scripts are inserted by adware and various extensions for browsers, mainly on users’ search pages. The scripts can also redirect users to malicious pages containing recommendations to update Adobe Flash and Java – a popular method of spreading malware.
The TOP 10 countries where online resources are seeded with malware
The following stats are based on the physical location of the online resources that were used in attacks and blocked by our antivirus components (web pages containing redirects to exploits, sites containing exploits and other malware, botnet command centers, etc.). Any unique host could be the source of one or more web attacks.
In order to determine the geographical source of web-based attacks, domain names are matched up against their actual domain IP addresses, and then the geographical location of a specific IP address (GEOIP) is established.
In 2014, Kaspersky Lab solutions blocked 1,432,660,467 web-attacks #KLReport
Tweet
In 2014, Kaspersky Lab solutions blocked 1,432,660,467 attacks launched from web resources located in various countries around the world. To carry out their attacks, the fraudsters used 9,766,119 unique hosts, 838,154 hosts or 8% fewer than in 2013.
87% of notifications about attacks blocked by antivirus components were received from online resources located in 10 countries. This is 5 percentage points more than in the previous year.

The distribution of online resources seeded with malicious programs in 2014
In 2014, the TOP 10 rating of countries where online resources are seeded with malware remained largely unchanged from the previous year. However four countries changed places: Germany and Russia swapped, with the Germans climbing to 2nd and Russia dropping to fourth. Ukraine overtook Britain to move up to 5th.
44% of all web attacks came from resources located in the USA and Germany.
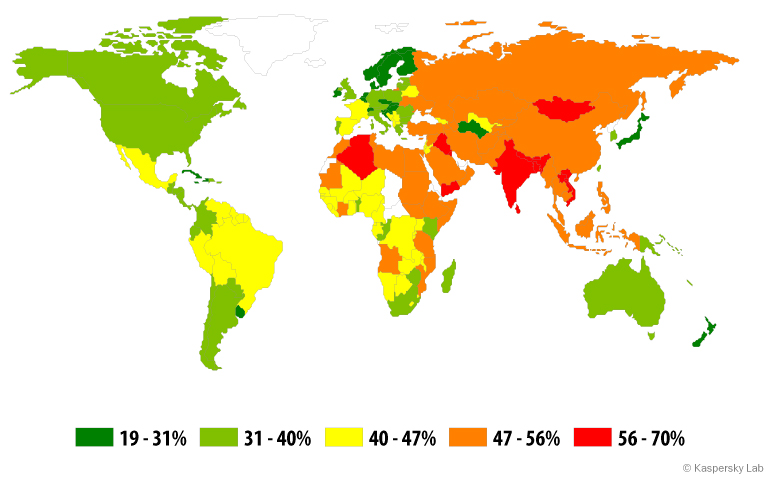
Countries where users face the greatest risk of online infection
In order to assess the countries in which users most often face cyber threats, we calculated how often Kaspersky users encountered detection verdicts on their machines in each country. The resulting data characterizes the risk of infection that computers are exposed to in different countries across the globe, providing an indicator of the aggressiveness of the environment facing computers in different parts of the world.
The TOP 20 countries where users face the greatest risk of online infection
| Country* | % of unique users** | |
| 1 | Russia | 53.81% |
| 2 | Kazakhstan | 53.04% |
| 3 | Azerbaijan | 49.64% |
| 4 | Vietnam | 49.13% |
| 5 | Armenia | 48.66% |
| 6 | Ukraine | 46.70% |
| 7 | Mongolia | 45.18% |
| 8 | Belarus | 43.81% |
| 9 | Moldova | 42.41% |
| 10 | Kyrgyzstan | 40.06% |
| 11 | Germany | 39.56% |
| 12 | Algeria | 39.05% |
| 13 | Qatar | 38.77% |
| 14 | Tadjikistan | 38.49% |
| 15 | Georgia | 37.67% |
| 16 | Saudi Arabia | 36.01% |
| 17 | Austria | 35.58% |
| 18 | Lithuania | 35.44% |
| 19 | Sri Lanka | 35.42% |
| 20 | Turkey | 35.40% |
These statistics are based on the detection verdicts returned by the web antivirus module, received from users of Kaspersky Lab products who have consented to provide their statistical data.
* We excluded those countries in which the number of Kaspersky Lab product users is relatively small (less than 10,000)
** Unique users whose computers have been targeted by web attacks as a percentage of all unique users of Kaspersky Lab products in the country
The year 2014 saw a change of leader in the TOP 20: the rating was topped by Russia where 53.81% of users faced the risk of online infection.
Last year’s leader, Azerbaijan, fell to 3rd position (49.64%).
Uzbekistan, Malaysia, Greece and Italy dropped out of the TOP 20. Among the newcomers were Mongolia, Qatar, Saudi Arabia, Turkey and Lithuania.
All countries can be divided into three groups expressing different levels of infection risk.
- The high risk group (over 41%)
- The risk group (21-40%)
- The low risk group (0-20.9%)
In 2014, this group includes nine countries from the TOP 20, compared to 15 countries in 2013.
This group includes 111 countries; among them are Kyrgyzstan (40.1%), Germany (39.6%), Qatar (38.8%), Tajikistan (38.5%), Georgia (37.7), Saudi Arabia (36%), Turkey (35. 4%), France (34.9%), India (34.8%), Spain (34.4%), USA (33.8%), Canada (33.4%), Australia (32.5% ), Brazil (32.1%), Poland (31.7%), Italy (31.5%), Israel (30.2%), China (30.1%), the UK (30%), Egypt (27.8%), Mexico (27.5%), the Philippines (27.2%), Croatia (26.2%), Pakistan (26.1%), Romania (25.7%), Japan (21. 2%), Argentina (21. 1%).
The 39 countries with the safest online surfing environments include Sweden (19.5%), Denmark (19.2%), Uruguay (19.5%) and a number of African countries.

In 2014, 38.3% of computers were attacked at least once while their owners were online.
On average, the risk of being infected while surfing the Internet decreased by 3.3 percentage points over the year. This may be caused several factors:
- Firstly, developers of browsers and search engines realized the necessity of securing their users and started to contribute to the fight against malicious sites
- Secondly, many exploit packs have started to check if Kaspersky Lab’s product is installed on the user’s computer. If it is, the exploits do not even try to attack the computer.
- Thirdly, users using more and more mobile devices and tablets to surf the Internet.
In addition, the number of attacks using exploit packs slightly decreased: arresting the developers of these packs was not in vain. However there are no grounds to expect some drastic change in the situation with exploits: they are still the main technique used to deliver malware, including for targeted attacks. The Internet remains the major source of malware for users in most countries.
Local threats
Local infection statistics for user computers are a very important indicator. This data points to threats that have penetrated the Windows operating system through something other than the Internet, email, or network ports.
This section contains an analysis of the statistical data obtained based on antivirus scans of files on the hard drive at the moment they are created or accessed, and the results of scanning various removable data storages.
The TOP 20 malicious objects detected on user computers
In 2014, Kaspersky Lab’s antivirus solutions detected 1,849,949 unique malicious and potentially unwanted objects.
| Name | % of unique attacked users* | |
| 1 | DangerousObject.Multi.Generic | 26.04% |
| 2 | Trojan.Win32.Generic | 25.32% |
| 3 | AdWare.Win32.Agent.ahbx | 12.78% |
| 4 | Trojan.Win32.AutoRun.gen | 8.24% |
| 5 | Adware.Win32.Amonetize.heur | 7.25% |
| 6 | Virus.Win32.Sality.gen | 6.69% |
| 7 | Worm.VBS.Dinihou.r | 5.77% |
| 8 | AdWare.MSIL.Kranet.heur | 5.46% |
| 9 | AdWare.Win32.Yotoon.heur | 4.67% |
| 10 | Worm.Win32.Debris.a | 4.05% |
| 11 | AdWare.Win32.BetterSurf.b | 3.97% |
| 12 | Trojan.Win32.Starter.lgb | 3.69% |
| 13 | Exploit.Java.Generic | 3.66% |
| 14 | Trojan.Script.Generic | 3.52% |
| 15 | Virus.Win32.Nimnul.a | 2.80% |
| 16 | Trojan-Dropper.Win32.Agent.jkcd | 2.78% |
| 17 | Worm.Script.Generic | 2.61% |
| 18 | AdWare.Win32.Agent.aljt | 2.53% |
| 19 | AdWare.Win32.Kranet.heur | 2.52% |
| 20 | Trojan.WinLNK.Runner.ea | 2.49% |
These statistics are compiled from malware detection verdicts generated by the on-access and on-demand scanner modules on the computers of those users running Kaspersky Lab products who consented to submit their statistical data.
* The proportion of individual users on whose computers the antivirus module detected these objects as a percentage of all individual users of Kaspersky Lab products on whose computers a malicious program was detected
The DangerousObject.Multi.Generic verdict, which is used for malware detected with the help of cloud technologies, is in 1st place (26.04%). Cloud technologies work when the antivirus databases do not yet contain either signatures or heuristics to detect a malicious program but the company’s cloud antivirus database already includes the information about the object. In fact, this is how the latest malware is detected.
The notorious worm Net-Worm.Win32.Kido dropped out of the TOP 20. In general the proportion of viruses continues to decrease: for example, last year Virus.Win32.Sality.gen affected 13.4% of users while in 2014 – only 6.69%.
Both this rating and the rating of web detections show that advertising programs are becoming more common. In 2014, the number of users who encountered adware doubled from the previous year and reached 25,406,107. At the same time advertising programs are becoming both more intrusive and more dangerous. Some of them “cross the border” into the category of potentially unwanted programs and are assigned a “harsher” verdict. For example, Trojan-Dropper.Win32.Agent.jkcd (16th place), in addition to displaying ads and changing search results, can download malware on the computer.
Countries where users face the highest risk of local infection
For each country we calculated the number of file antivirus detections the users faced during the year. The data includes detections of malicious programs located on users’ computers or on removable media connected to the computers, such as flash drives, camera and phone memory cards, or external hard drives.
The TOP 20 countries by the level of infection
| Country* | %** | |
| 1 | Vietnam | 69.58% |
| 2 | Mongolia | 64.24% |
| 3 | Nepal | 61.03% |
| 4 | Bangladesh | 60.54% |
| 5 | Yemen | 59.51% |
| 6 | Algeria | 58.84% |
| 7 | Iraq | 57.62% |
| 8 | Laos | 56.32% |
| 9 | India | 56.05% |
| 10 | Cambodia | 55.98% |
| 11 | Afghanistan | 55.69% |
| 12 | Egypt | 54.54% |
| 13 | Saudi Arabia | 54.37% |
| 14 | Kazakhstan | 54.27% |
| 15 | Pakistan | 54.00% |
| 16 | Syria | 53.91% |
| 17 | Soudan | 53.88% |
| 18 | Sri Lanka | 53.77% |
| 19 | Myanma | 53.34% |
| 20 | Turkey | 52.94% |
These statistics are based on the detection verdicts returned by the antivirus module, received from users of Kaspersky Lab products who have consented to provide their statistical data.
* When calculating, we excluded countries where there are fewer than 10,000 Kaspersky Lab users
** The percentage of unique users in the country with computers that blocked local threats as a percentage of all unique users of Kaspersky Lab products
The TOP 4 countries for risk of local infection remained largely unchanged from the previous year: Vietnam was in 1st position; Mongolia and Bangladesh changed places – Bangladesh moved down from 2nd to 4th position while Mongolia climbed from 4th to 2nd place.
Djibouti, Maldives, Mauritania, Indonesia, Rwanda and Angola left the TOP 20. The newcomers were Yemen, Saudi Arabia, Kazakhstan, Syria, Myanmar and Turkey.
Within the TOP 20 countries at least one malicious object was found on an average of 58.7% of computers, hard drives or removable media belonging to KSN users. The 2013 figure was 60.1%.
Countries can be divided into four risk categories for local threats.
- Maximum risk (over 60%): four countries including Vietnam (69.6%), Mongolia (64.2%), Nepal (61.0%) and Bangladesh (60.5%).
- High risk (41-60%): 83 countries including India (56.0%), Kazakhstan (54.3%), Turkey (52.9%), Russia (52.0%), China (49.7%), Brazil (46.5%), Belarus (45.3%), Mexico (41.6%), the Philippines (48.4%).
- Moderate local infection rate (21-40.99%): 70 countries including Spain (40.9%), France (40.3%), Poland (39.5%), Lithuania (39.1%), Greece (37.8%), Portugal (37.7%), Korea (37.4%), Argentina (37.2%), Italy (36.6%), Austria (36.5%), Australia (35.3%), Canada (34.8%), Romania (34. 5%), the US (34.4%), the UK (33.8%), Switzerland (30.8%), Hong Kong (30.4%), Ireland (29.7%), Uruguay (27.8% ), the Netherlands (26.4%), Norway (25.1%), Singapore (23.5%), Japan (22.9%), Sweden (23%), Denmark (21.3%)
- Low local infection rate (0- 20.99%): 3 countries including Finland (20%), Cuba (19.1%) and Seychelles (19%).
The 10 safest countries were:
| Country | %* | |
| 1 | Seychelles | 19.03% |
| 2 | Cuba | 19.08% |
| 3 | Finland | 20.03% |
| 4 | Denmark | 21.34% |
| 5 | Japan | 22.89% |
| 6 | Sweden | 22.98% |
| 7 | Czech Republic | 23.13% |
| 8 | Singapore | 23.54% |
| 9 | Martinique | 25.04% |
| 10 | Norway | 25.13% |
* The percentage of unique users in the country with computers that blocked local threats as a percentage of all unique users of Kaspersky Lab products
In 2014, three new countries appeared in this TOP 10 — Martinique, Singapore and Sweden. Slovakia, Slovenia and Malta dropped out of the rating.
In 2014, on average, 23% of user machines were attacked in the 10 safest countries at least once #KLReport
Tweet
On average, 23% of user machines were attacked in the 10 safest countries at least once during the year. This is 4.2 percentage points more than last year.
Kaspersky Security Bulletin 2014. Overall statistics for 2014
Table of Contents
- The year in figures
- Mobile threats
- Geography of mobile threats
- TOP 20 mobile threats of 2014
- Reduction in attacks by SMS Trojans
- Mobile banking Trojans
- Threats designed for Mac OS X
- Vulnerable applications used by fraudsters
- Online threats (Web-based attacks)
- Online threats in the banking sector
- The TOP 20 malicious objects detected online
- The TOP 10 countries where online resources are seeded with malware
- Countries where users face the greatest risk of online infection
- Local threats
From the same authors


In the same category


OFK
Is it possible to learn proportion of which protocols (HTTP, FTP, POP and HTTPS, FTPS, SecurePOP) distribute viruses or malicious things. For example %95 – http, %1 https etc.
Doron
Thanks for the informative report