

Authors
Over the last few days, Stuxnet has been covered extensively in the mass media. And it’s been covered differently by different sources. “Iran”, “Bushehr nuclear plant” and “cyber-weapon” are phrases which are already inexorably linked to Stuxnet. One of the main arguments behind the “Iranian” theory is that Iran is the epicentre of the epidemic, as it has the largest number of computers identified as being infected.
However, any estimates about the number of infected machines can only be based on the data which AV companies get from their clients’ machines. And such data only comes from those countries where a company actually has clients. So if there aren’t any clients, or the antivirus product in question isn’t widely used, any estimates have to be regarded as having a serious margin of error.
You have to look at data from several companies in order to get a reasonable idea of what’s going on. And in addition to this, you have to know what market share the company in question has in the relevant country.
Nearly all sources agree on one point: that Iran, India, and Indonesia lead in terms of infections. Some put Iran in first place, some India. Unfortunately, what’s getting forgotten is that the Stuxnet epidemic (like any epidemic) isn’t static: the worm is continuing to spread, and while some systems remain infected, many of them have been cleaned.
We’ve been monitoring the epidemic. A look at the data from the last three months gives us a chance to pinpoint what changes have taken place, and to maybe establish which country the worm initially spread from.
Our data set comes from the Kaspersky Security Network, our in-the-cloud service. The data throws up some interesting facts, but it should be stressed that this is data from our personal product line, and not data collected by our other products.
The table below lists the twenty most infected countries from the start of July (when detection for Stuxnet was added to our bases) until now. India, Iran, and Indonesia take the top three. But Iran isn’t in first place; neither is it in second.
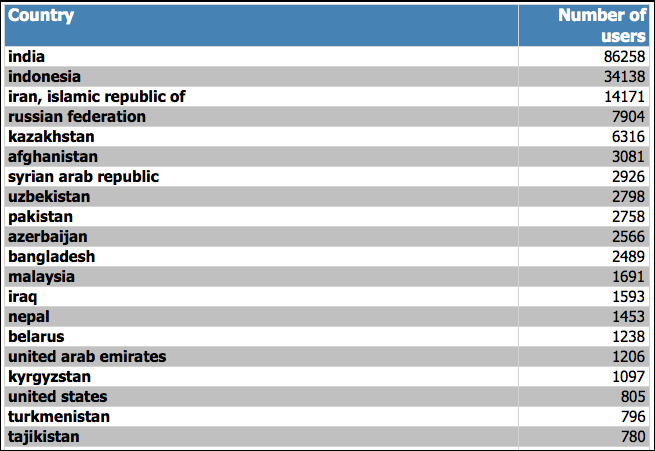
As I said above, these statistics are for the whole three month period. In reality, the epidemic is evolving in different ways in different countries, and at the start of the outbreak, the difference between the three leading countries was not nearly so marked.
We’ve divided the entire period into five day sections. Here are the five most infected countries in the first five days following Stuxnet’s detection:
- India – 8565
- Indonesia – 5148
- Iran – 3062
- Afghanistan – 533
- Azerbaijan – 454
And here are the five most infected countries for the last five days (20 – 25 September):
- India – 8179
- Indonesia – 3052
- Kazakhstan – 1340
- Russia – 1138
- Iran– 765
The number of infected systems in India and Indonesia dropped. In contrast, Stuxnet started hitting Kazakhstan and Russia in earnest.
These graphs give a picture of how the epidemic developed in different countries:
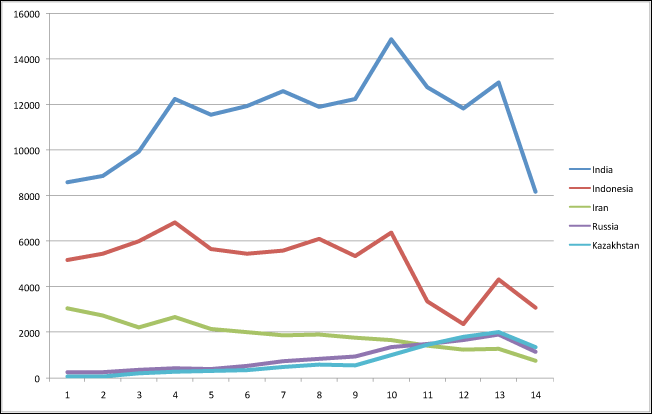
As you can see, Iran managed to significantly cut its infection rate by cleaning many infected systems. If this trend is maintained, then Iran will stop being one of the centres of the epidemic. India, on the other hand, has stayed more or less at the same level; it is encouraging, though, the the epidemic doesn’t seem to be on the rise. Indonesia, like Iran, seems to have been successful in preventing Stuxnet from spreading.
The same can’t be said for Russia and Kazakhstan. These two countries currently seem to be the most vulnerabile, and the epidemic is only starting to reach a peak. Stuxnet is new to these countries, so it’s clear that the worm didn’t start spreading from either of these two territories.
Here’s a graph similar to the one above showing data for other countries:
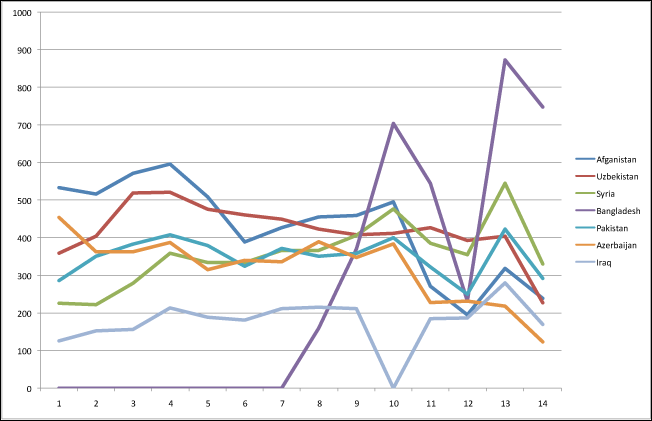
It’s clear that in three countries – Bangladesh, Iraq and Syria – the epidemic is on the rise. The first infections in Bangladesh were only detected in August, after Stuxnet was first detected, and it may well be that the worm came to Bangladesh from India. The epidemics in Iraq and Syria indicate that the worm probably came from Iran.
Here’s how the number of Stuxnet related incidents in September has changed in comparison to those in July:
- India: -5%
- Indonesia: -41%
- Iran: -75%
- Russia: +308%
- Kazakhstan: +1711%
- Afghanistan:-55%
- Uzbekistan:-37%
- Syria: +47%
- Bangladesh: +370% (in comparison with August)
- Pakistan: +2%
- Azerbaijan:-73%
- Iraq: +35%
Unfortunately, it has to be said that Stuxnet was only detected after it had reached a peak in Iran and India. At the moment, it’s extremely difficult to determine exactly when it first appeared.
It’s clear that AV companies only detected the worm in those countries once it was on the downswing. Looking at the stats, it seems that the worm must have started spreading 3 – 4 months prior to July 2010 – according to our data set, Stuxnet would have needed this period of time in order to infect such a large number of machines.
Authors
From the same authors


In the same category


Myrtus and Guava: the epidemic, the trends, the numbers