

Authors
It is well known that large quantities of spam are now being sent by networks of compromised computers that can be controlled remotely by individuals or organizations. These networks are called botnets and have been a constant source of concern to security professionals all over the world.
This paper presents a method to automatically separate and block those networks in real time. The method uses a statistical approach exploiting the fact that computers in a botnet have to have some similarities in their behavior. By monitoring e-mail traffic from numerous sources over a period of time it is possible to notice that message streams from some of the sources share common characteristics which mark them out from the rest of the computers sending e-mail messages. Depending on the way the streams are compared, the number of messages in each stream and the number of sources isolated, it can be stated with greater or lesser probability that these sources make up a network of “zombie” computers – a botnet.
Introduction
Sending spam, among other criminal activity such as DDOS attacks, identity theft, sniffing traffic, spreading malware etc., is the most favored use for botnets. Significant surges in spam activity are now being linked to the increasing use of botnets by spammers. Large distributed networks of computers are hard to track, and the dynamic nature of IP addresses of machines that constitute a botnet makes it almost impossible to use traditional denylist services.
This paper provides an introduction to a method that can be used to isolate botnets in almost real time. The method is a statistical one and assumes we can monitor a large amount of mail messages from different locations; the more sources that are analyzed and the more messages from each of the sources that are handled, the better the results.
The main idea behind the method is that a distribution of some numerical parameters of e-mail messages sent from one location is compared with the same distributions from other locations.
In the most trivial case, all machines from a botnet distribute an exact copy of one message. We could easily track such a network by collecting and comparing MD5 message hashes from different sources. If there are hundreds or thousands of machines sending out messages with the same MD5 hash, it is definitely a botnet. But if our goal is to counteract spam, not to investigate botnets, it is easier to use another type of technology called Distributed Checksum Clearinghouse (DCC) which blocks bulk e-mail by maintaining a denylist of message hashes.
In practice, things are much more complicated. The content of e-mail messages varies significantly even within the same distribution. The message parts and attributes that can be altered are the text, the number and size of attachments, image dimensions, encodings, formats and so on. As a result, many e-mail parameters vary, making it difficult to extract similar patterns. In this situation we can compose a distribution of message numbers by size for every source IP address. These distributions are then compared with each other. Of course, distributions from different sources will differ, but they will resemble each other as long as the sources are from the same botnet. That is the point. We compare functions, not scalar values! It is intuitively obvious that if we lived in a world where botnets did not exist, it would be difficult to find several thousand computers that have almost identical “nontrivial” distributions among several million randomly chosen machines. Precise calculations and numerous experiments back up this idea and for some isolated networks the estimations of “false positives” (the probability of a “good” host being placed in a “bad” group) were close to zero. Other networks showed more modest results. The estimation of false positives is regarded as a part of the method and will be discussed later.
Implementation
Because it involves mail transactions on a large scale, a system designed to resist ‘spam attacks’ from botnets has to be highly distributed. Mail Transfer Agents (MTA) have to send information about messages they receive to one or more locations where it is gathered and then analyzed. The resulting groups of IP addresses classified as botnets, along with the numbers or weights describing to what degree we can trust those groups, are organized into denylists, which can be accessed via ordinary DNS requests, for example. The main problem here is the volatile nature of the source addresses we deal with. Most of the infected machines that constitute a botnet are home PCs connected to the networks of their ISP via dial-up, DSL, cable or LAN connections. The IP addresses are often allocated dynamically to those computers. It means that a normal lifetime of a given IP address may be days or just a few hours. The system has to react quickly, putting the address into a denylist as soon as it starts spamming, and removing it when it expires.
Work on tracking botnets distributing bulk e-mail has been carried out in Kaspersky Lab since October 2006. Figure 1 illustrates the system that has been used in that work. An existing system called Urgent Detection System (UDS), which was designed for another type of spam filtering technology, was adopted for our purposes as a transport system. Mail messages are transmitted from the sources (labeled ‘S’) to their destinations (labeled ‘D’), which are mail systems that are to be spam protected. In this implementation the only attribute under investigation was message size. Message sizes, along with source IP addresses, are relayed to one of the UDS servers where they are gathered and finally transmitted to the botnet analyzer. For every source, the analyzer draws up distributions of message numbers by size and compares them, producing denylists of IP addresses to be blocked. The distributions data are updated and processed every two hours to correct denylists and reinitialized every 24 hours.
A few words about the way the set of distributions is compared. A straightforward one-to-one comparison of several million distributions would result in many hours of computational work. Devising effective algorithms that solve the problem is a real challenge. In the present implementation each distribution is divided into parts and it is these parts from different distributions that are compared after being ordered. The algorithm itself is an iterative process. The first iteration produces sets of IP addresses that are coarse approximations of botnets. The following iterations produce fine-grained botnets. It takes about 60-90 minutes to handle the distributions for a 24-hour period.
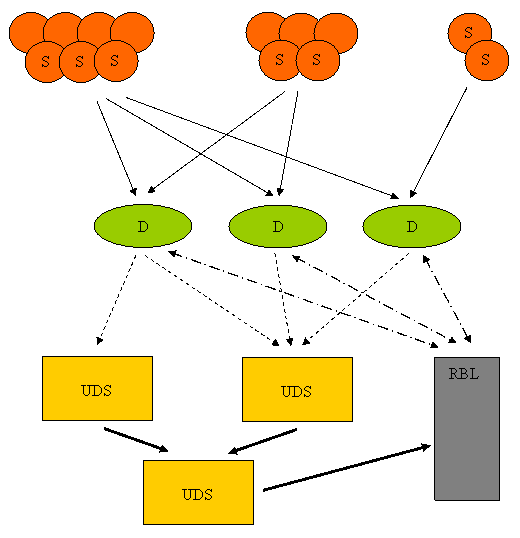
Figure 1
False Positives
Whether we use the system to block spam or just for botnet research, the main concern is how much we can trust the results. We need to estimate how many “good” hosts can be mistakenly placed in every resultant botnet. Such estimates depend heavily on the way the distributions are compared. Strictly speaking, we need to determine a metric space in which our distributions live. A metric (i.e. a distance function between any two distributions) should be chosen carefully to properly reflect the subject matter. Figure 2 shows what this metric space would look like in a botnet-free world (the points on the figure are our distributions or functionals). The points are placed rather uniformly in the region of interest and it is impossible to cover many points by a sphere of a rather small radius (a sphere with radius R in a metric space is a set of points whose distances from the center are less than R). In the world with botnets (Figure 3) there are high density regions that can be covered by spheres of rather small radiuses. It is obvious from these figures that the smaller the radius, the fewer the machines that are picked up and the smaller the probability of false positives.
A practical approach was used in this implementation of false positive estimation where we stored 24-hour distributions that were outside any isolated botnet. These distributions represent our botnet-free world (Figure2). Every time we need to make an estimation for a botnet, we restore 24-hour distributions for several (the more, the better) days that were stored a month or two ago, take one representative distribution from the botnet (the one nearest the center of the sphere discussed above) and see how many distributions from the restored botnet-free world would be adjacent to (inside the sphere) the botnet distribution. This number determines how many “good” hosts can end up among the botnet’s hosts. For a “well defined” botnet this number has to be small (0, 1, 2 or so). Larger numbers mean the distribution is too “trivial” to use.
A simpler approach is to estimate the “complexity” of the botnet distributions. Many “complex” distributions almost certainly signify a botnet.
It is important to note “pseudo false positives”. A host can distribute legitimate e-mails along with content prescribed by a botnet owner. If it is a noticeable portion of all e-mail messages, the computer will most likely be outside any isolated botnet, since additional messages distort the host distribution. This is not the case when these legitimate e-mails are outside the scope of our system. So, it is desirable to give the resulting denylists to those clients which contribute to the distribution data.

Figure 2

Figure 3
Some results
On average, a few dozen networks are isolated every 24 hours. The number of sources in each of them ranges from several hundred to several thousand. As an example, two botnets which were isolated in July 2007 are described below. One of them had up to 2000 addresses, mainly from Russia, and was monitored over several weeks. It is interesting to note that this botnet was inactive on weekends and only 20-25% of the addresses survived beyond the day they were detected. Another network had about 200 addresses registered in Brazil, Argentina, China, India and other countries. In general, almost all networks from outside Russia are presented in a shrunken state because of insufficient statistical information. The two charts below show regional distributions of these botnets.

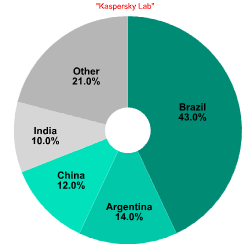
Figure 4-5
At the end of this paper there are 12 images that are typical distributions obtained for six representatives of the first and second botnets respectively. The header of each image shows IP number, domain name, region, and the number of messages sent by this host over 24 hours. The abscissa represents message sizes (100-byte intervals) and the ordinate shows the number of messages. For example, a point with X=5000 and Y=30 means that the host issued 30 messages which have sizes ranging from 5000 to 5099 bytes. The images show how similar the distributions from the same botnet are in spite of the different amount of statistical information used to build those distributions.
Conclusions
Many details concerning the implementation of the method have been mentioned in passing and many more have been left out of the paper. However, once the main idea of the method is known, it is possible to understand its advantages and disadvantages. The main problem in the implementation of this technology is the need to have a considerable quantity of statistical information gathered from different sources. To confidently analyze a distribution for a particular source it is desirable to collect information from at least a few dozen (preferably hundreds) messages issued by this source. This is not always possible. Besides, as statistical information is being gathered, spam messages are being freely delivered to user mailboxes. Another disadvantage is the complexity of botnet analyzer algorithms, which also require thorough testing and tuning in order to obtain an acceptable result. The advantages of the method are the simplicity of implementation on the client side and the insignificant amount of information transmitted by a client. This method appears to be one of the few that can shape the boundaries of zombie networks with some degree of precision while they are affecting a particular group of hosts. Thus, apart from spam filtering, this method can be used for botnet research. Further evolution of the technology will probably lead to the analysis of distributions by parameters other than sizes, and the analysis of vector distributions composed of several message characteristics.
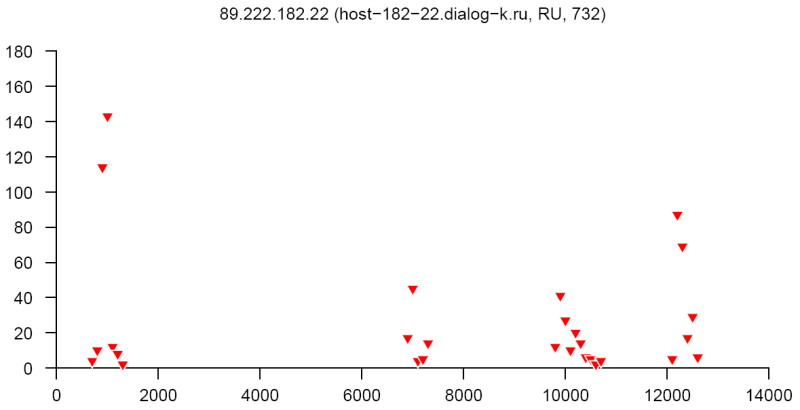
Figure 6
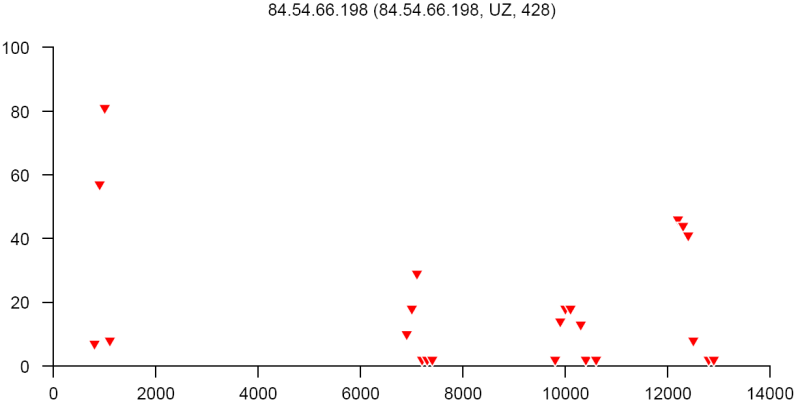
Figure 7
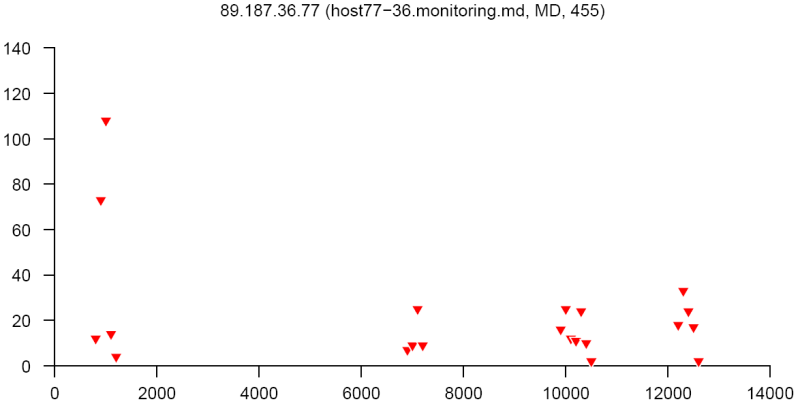
Figure 8

Figure 9

Figure 10

Figure 11
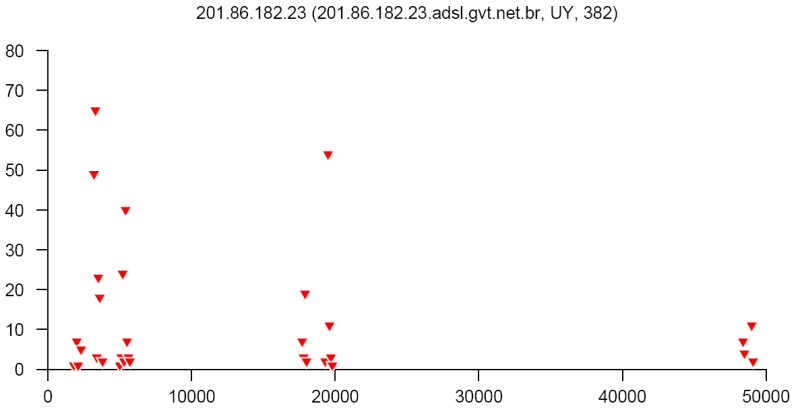
Figure 12
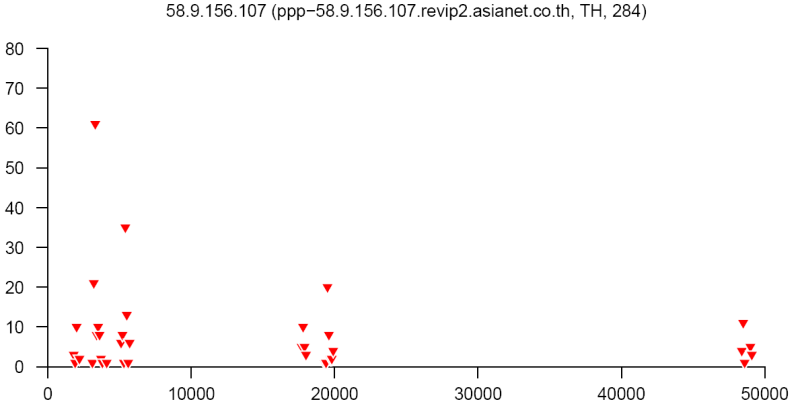
Figure 13
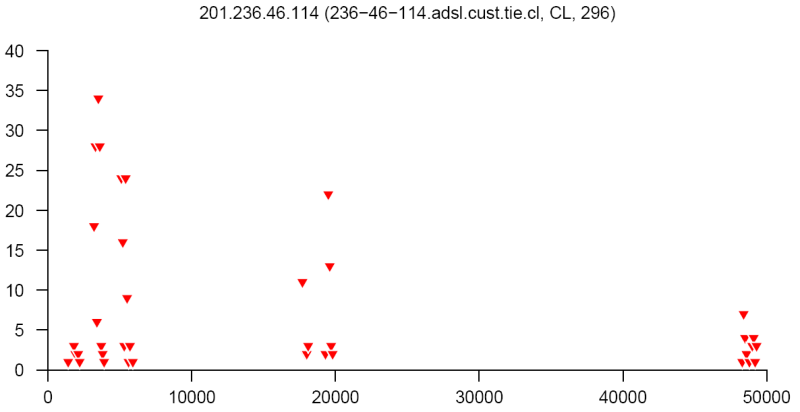
Figure 14

Figure 15
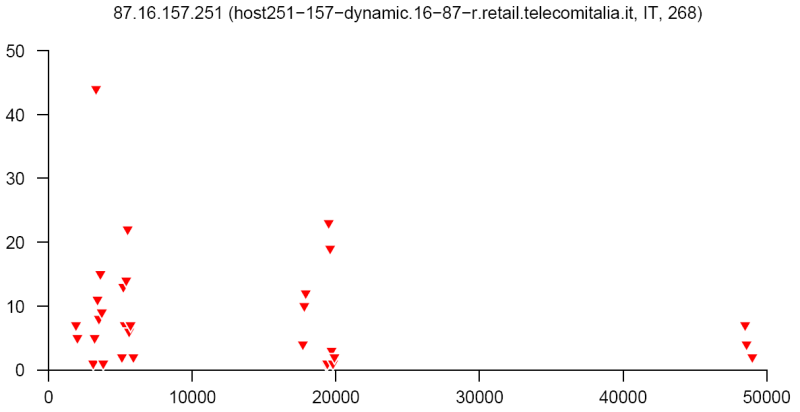
Figure 16
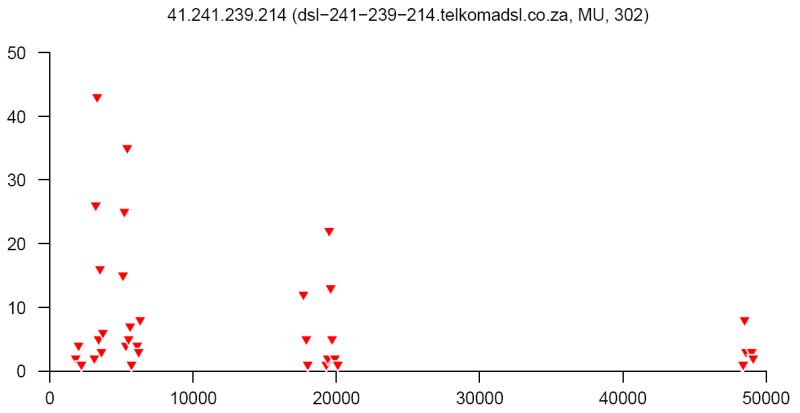
Figure 17
Authors
Table of Contents
In the same category


Coordinated distributions method for tracking botnets sending out spam